
Thank you to the two subscribers who participated in Reader Request Day today. One person just requested one symbol and since they don't often send in symbols, I wanted to make sure to cover it. It is "Diamond in the Rough" material for sure, but it is overbought right now.
The other two selections also have overbought conditions, but they are set up well on both the daily and weekly charts so we could easily see prices move higher from here. At this point, we do need to consider "winners that keep on winning" and those stocks will likely be somewhat overbought.
The market is struggling and I do need to tell you that the Diamond Dog Scan which picks up shorting opportunities, had about 200 scan results! This suggests the market will stay in a downturn so make sure you set your stops for protection and maybe consider adding a short.
Tomorrow is the Diamond Mine trading room! Be sure to register using the link below. Hope to see you there! Remember with us retiring, there are only so many of these trading rooms left. Come join us!
Good Luck & Good Trading,
Erin
Today's "Diamonds in the Rough": CBRL, CLS and MELI.
Other requests: EBAY and LITE.

Diamond Mine Trading Room:
RECORDING & DOWNLOAD LINK (5/16/2025):
Topic: DecisionPoint Diamond Mine (5/16/2025) LIVE Trading Room
Download & Recording Link
Passcode: May#16th
REGISTRATION for 5/23/2025:
When: May 23, 2025 09:00 AM Pacific Time (US and Canada)
Topic: DecisionPoint Diamond Mine LIVE Trading Room
Register in advance for this webinar HERE
After registering, you will receive a confirmation email containing information about joining the webinar.
Welcome to DecisionPoint Diamonds, wherein I highlight ten "Diamonds in the Rough" per week. These are selected from the results of my DecisionPoint Scans which search for stocks that could benefit from the trend and condition of the market. Remember, these are not recommendations to buy or sell, but are the most interesting of the stocks that surfaced in my scans. My objective is to save you the work of the initial, tedious culling process, but you need to apply your own analysis to see if these stocks pique your interest as well. There are no guaranteed winners here!
"Predefined Scans Triggered" are taken from StockCharts.com using the "Symbol Summary" option instead of a "SharpChart" on the workbench.
Stop levels are all rounded down.
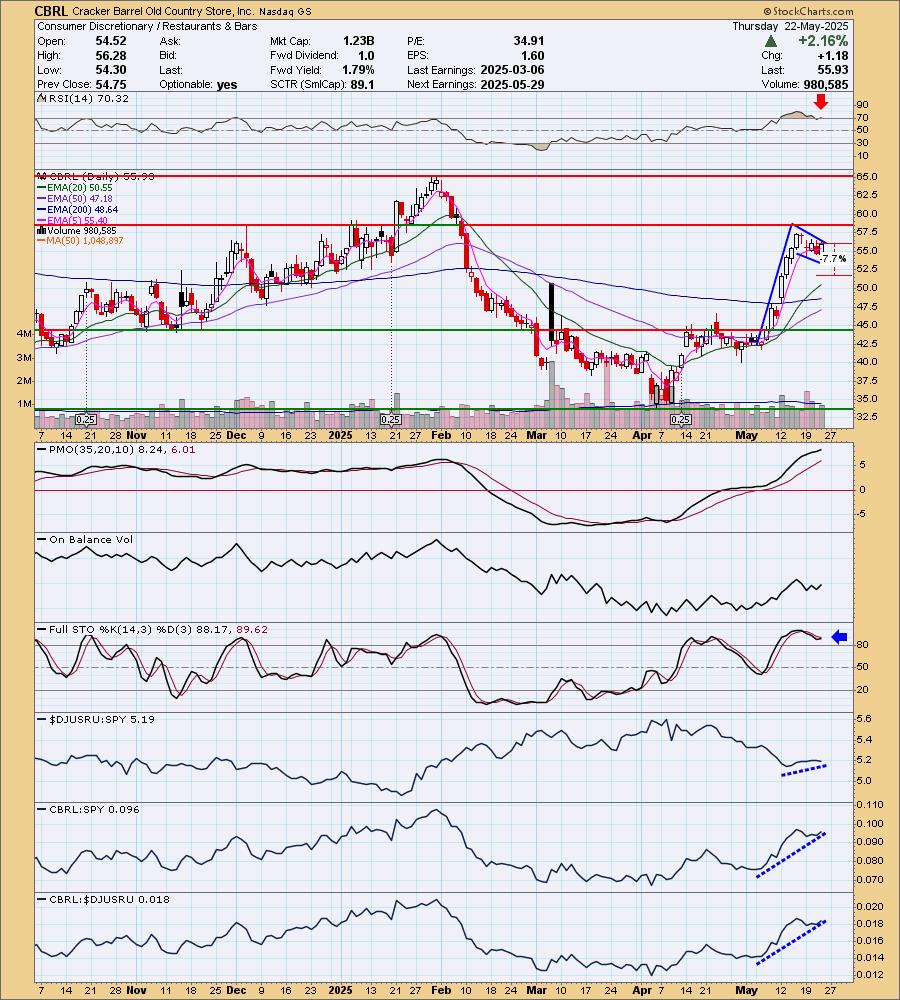
Cracker Barrel Old Country Store, Inc. (CBRL)
EARNINGS: 2025-05-29 (BMO)
Cracker Barrel Old Country Store, Inc. engages in the operation and development of restaurant and retail outlets. The format of its stores consists of a trademarked rustic old country-store design that offers restaurant menu featuring home-style country food. The company was founded by Dan W. Evins on September 19, 1969 and is headquartered in Lebanon, TN.
Predefined Scans Triggered: P&F Double Top Breakout.
CBRL is unchanged in after-hours trading. What caught my eye and likely this reader's eye was the textbook bull flag on the chart. The RSI is a little bit overbought and that could mean that the flag will build more. However, with today's big rally, I think it is ready to head back up. The PMO is accelerating higher well above the zero line. Stochastics are rising after reversing above 80. Relative strength lines are all rising overall. The flag formation implies a possible breakout move to $72.50. Not sure it will get that far, but it certainly is possible. The stop is set arbitrarily at 7.7% or $51.62.
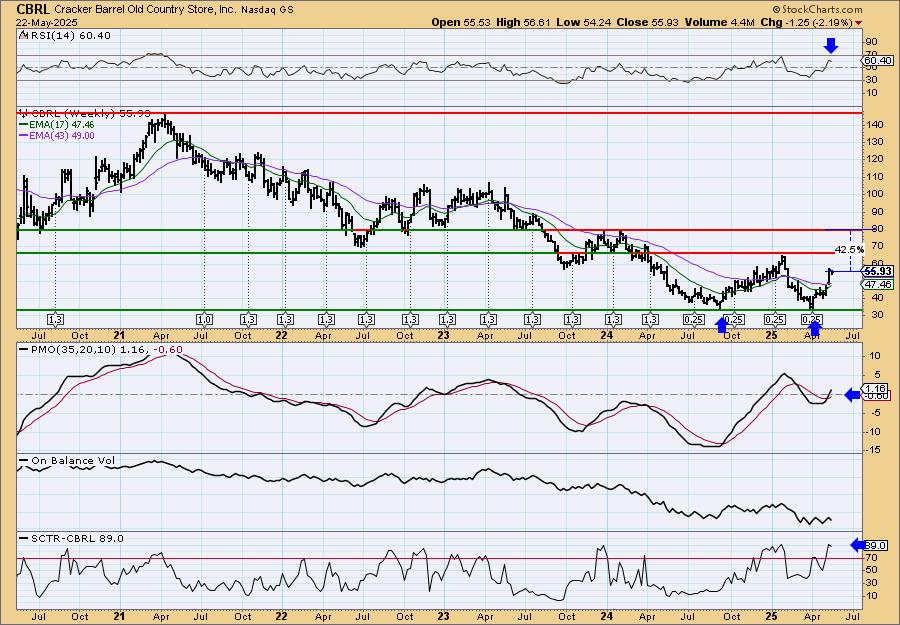
We do see a long-term declining trend on the weekly chart, but it is tempered by the new bullish double bottom. The weekly RSI is positive and not overbought. The weekly PMO is rising strongly on a new Crossover BUY Signal. The StockCharts Technical Rank (SCTR) is near the top of the hot zone*. Even if it only reaches the confirmation line of the double bottom, it would be about a 17% gain, but given this pattern I do see a likely breakout ahead.
*If a stock is in the "hot zone" above 70, it implies that it is stronger than 70% of its universe (large-, mid-, small-caps and ETFs) primarily in the intermediate to long terms.
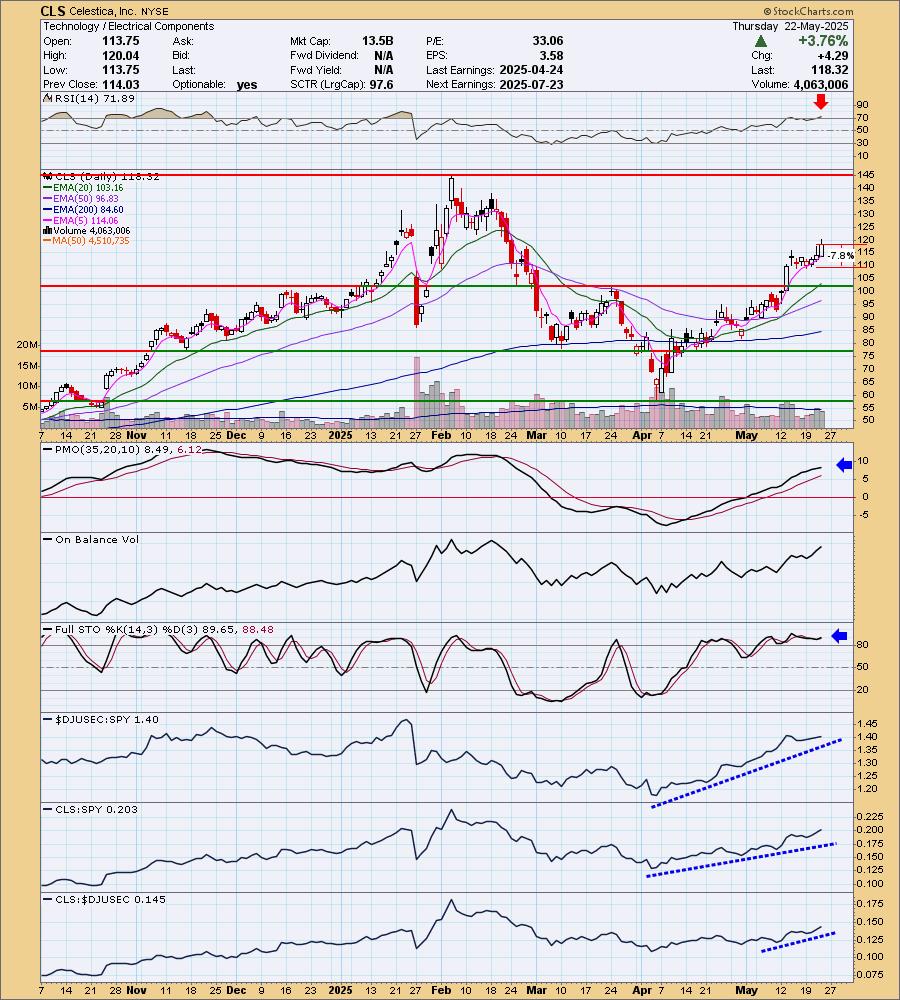
Celestica, Inc. (CLS)
EARNINGS: 2025-07-23 (AMC)
Celestica, Inc. engages in the provision of supply chain solutions globally to equipment manufacturers and service providers. It operates through the following segments: Advanced Technology Solutions (ATS), and Connectivity and Cloud Solutions (CCS). The Advanced Technology Solutions (ATS) segment includes aerospace and defense, industrial, smart energy, health tech, and capital equipment businesses. The Connectivity and Cloud Solutions (CCS) segment consists of enterprise communications, telecommunications, servers, and storage businesses. The company was founded in 1994 and is headquartered in Toronto, Canada.
Predefined Scans Triggered: Moved Above Upper Price Channel, P&F Ascending Triple Top Breakout and P&F Double Top Breakout.
CLS is up +0.15% in after-hours trading. I liked the new acceleration of price after its short period of consolidation after the breakout above the March high. The RSI is overbought, but this one has no problem with that condition based on history. The PMO is rising well above the zero line. The OBV is rising strongly, confirming the rally. Stochastics are holding above 80 and are rising. Relative strength is very strong for both the group and CLS. We have strongly rising relative strength lines. The stop is set near support below the consolidation at 7.8% or $109.09.
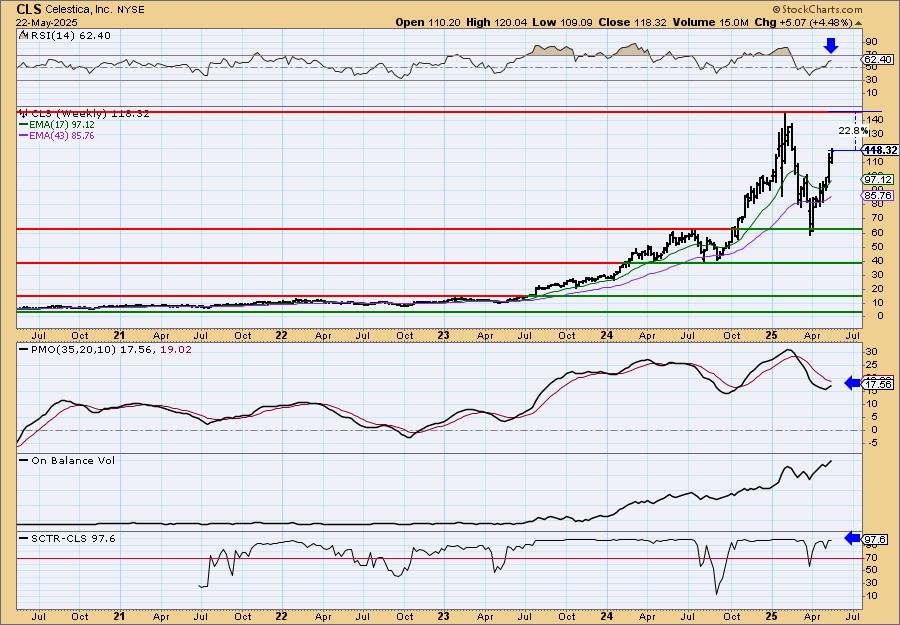
We had a strong parabolic advance that ended painfully with the bear market. Since then it has bounced off support at the 2024 high and has formed a bullish "V" Bottom. The weekly RSI is positive and not overbought. The weekly PMO is rising toward a Crossover BUY Signal. The SCTR is at the top of the hot zone so it looks good for the intermediate as well as the short term.
MercadoLibre Inc. (MELI)
EARNINGS: 2025-07-31 (AMC)
MercadoLibre, Inc. engages in the development of an online commerce platform with a focus on e-commerce and related services. It operates through the following geographical segments: Brazil, Argentina, Mexico, and Other Countries. The Other Countries segment refers to Chile, Colombia, Costa Rica, Dominican Republic, Ecuador, Panama, Peru, Bolivia, Honduras, Nicaragua, El Salvador, Guatemala, Paraguay, Uruguay, and the United States of America. Its products provide a mechanism for buying, selling, and paying as well as collecting, generating leads, and comparing lists through e-commerce transactions. The company was founded by Marcos Eduardo Galperin on October 15, 1999 and is headquartered in Montevideo, Uruguay.
Predefined Scans Triggered: New 52-week Highs, P&F Ascending Triple Top Breakout and P&F Double Top Breakout.
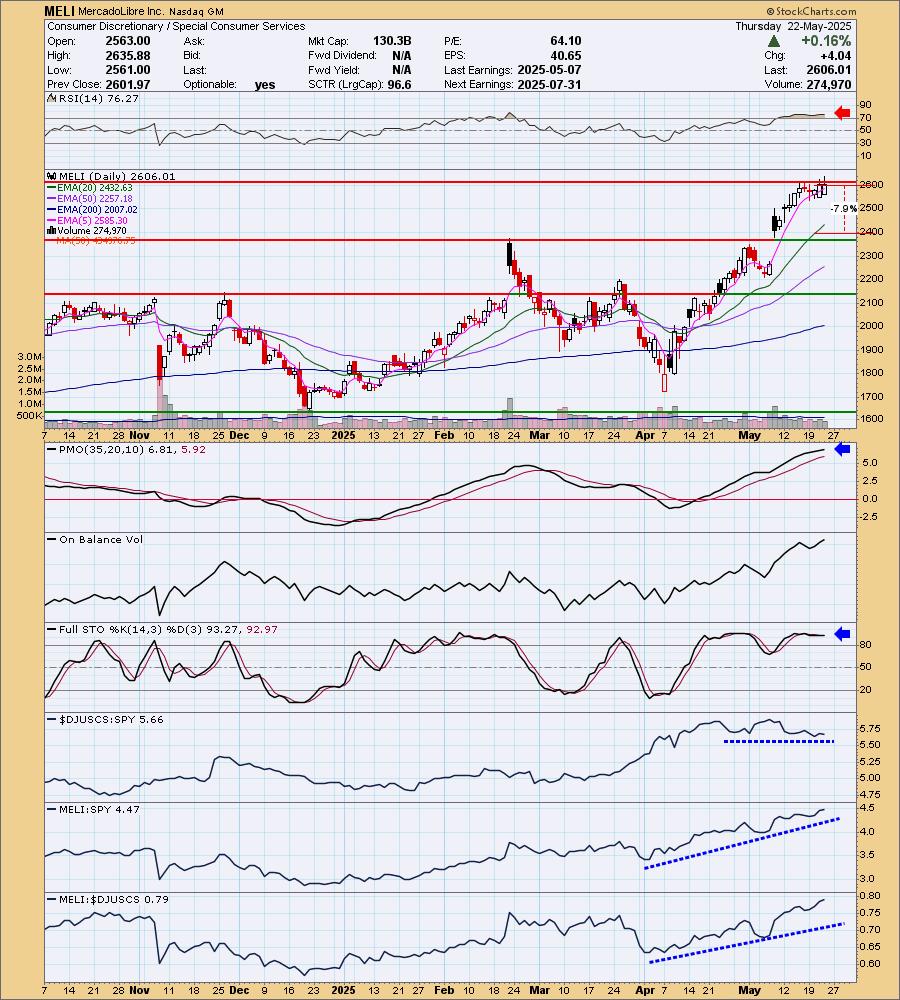
MELI is up +0.08% in after-hours trading. We had a breakout from a bull flag out of the April low. It appears to be trying to set up another flagpole higher. This one has been overbought for awhile based on the RSI so it may be time for consolidation before it heads much higher from here. I'd like it particularly on a pullback. The PMO is rising strongly well above the zero line so a pullback shouldn't hurt it too much. Stochastics are very strong above 80. The industry group isn't performing particularly well, but MELI is definitely outperforming against the group and the SPY. I wanted to set the stop beneath support, but that would be too deep so I put it as close to that level as I could without going over 8%. I chose 7.9% or $2400.13.
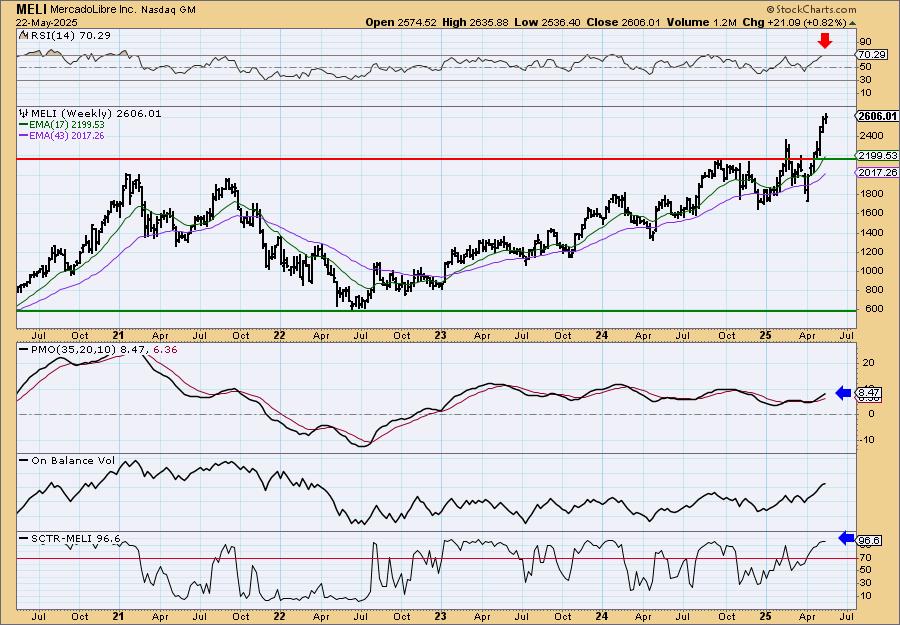
MELI broke from a long-term trading range. The RSI is overbought on the weekly chart so it is definitely due for some consolidation at the very least. This rising trend looks very good, but it is going parabolic with this vertical rally. The weekly PMO looks very good as it rises on a Crossover BUY Signal above the zero line. The SCTR is at the top of the hot zone. This one looks good for the intermediate term, but I do wonder if we won't get a pullback here soon. You could certainly enter now on an intermediate-term basis. Consider a 17% upside target to about $3049.03.
Don't forget, on Thursdays I look at reader-requested symbols, click HERE to send me an email. I read every email I receive and try to answer them all!
Current Market Outlook:
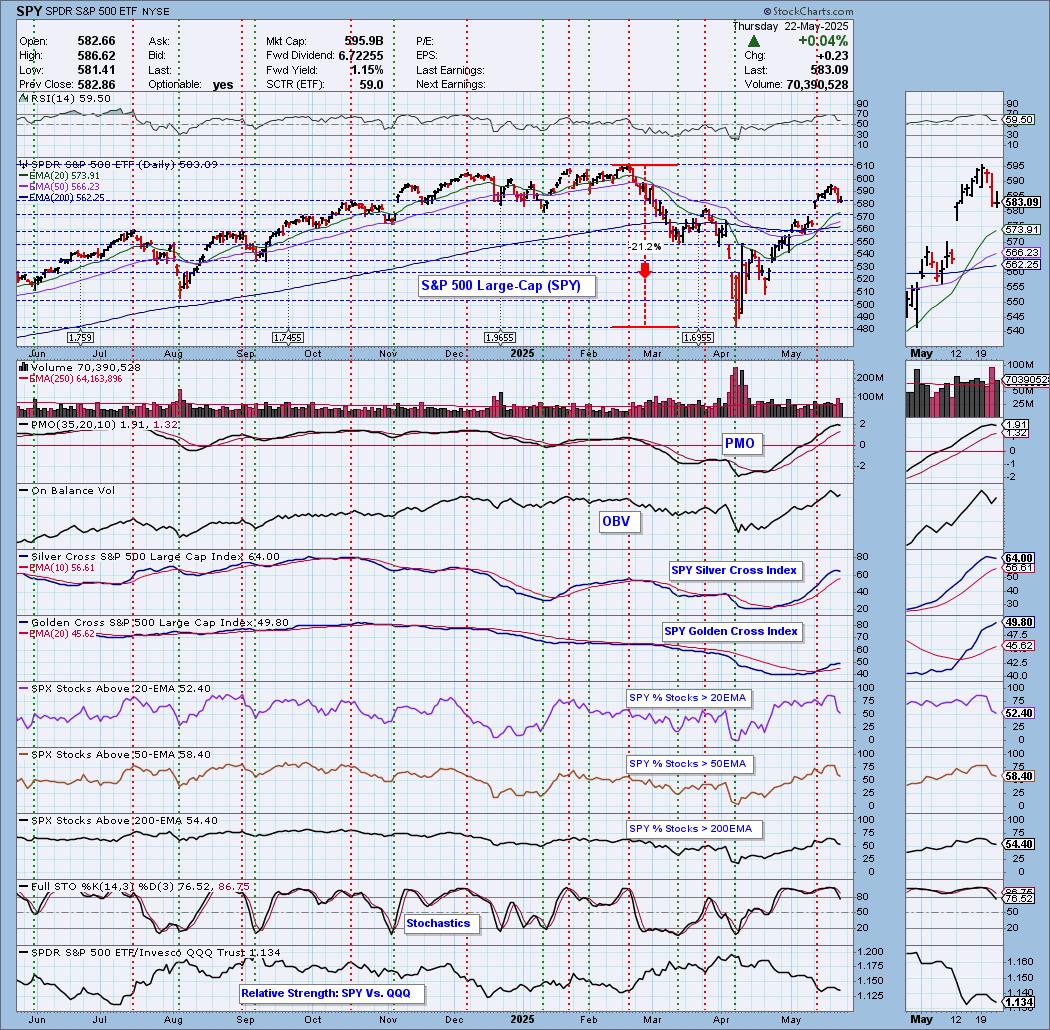
Market Environment: It is important to consider the odds for success by assessing the market tides. The following chart uses different methodologies for objectively showing the depth and trend of participation for intermediate- and long-term time frames.
- The Silver Cross Index (SCI) shows the percentage of SPX stocks on IT Trend Model BUY signals (20-EMA > 50-EMA)
- The Golden Cross Index (GCI) shows the percentage of SPX stocks on LT Trend Model BUY signals (50-EMA > 200-EMA)
Don't forget that as a "Diamonds" member, you have access to our "Under the Hood" curated ChartList on DecisionPoint.com. You'll find it under "Members Only" links on the left side on the Blogs and Links Page.
Here is the current chart:
Full Disclosure: I am 70% long, 0% short.
I'm required to disclose if I currently own a stock I mention and/or may buy/short it within the next 72 hours.
"Technical Analysis is a windsock, not a crystal ball." - Carl Swenlin
(c) Copyright 2025 DecisionPoint.com
Watch the latest episode of DecisionPoint Trading Room with Carl Swenlin & Erin Swenlin Mondays on the DecisionPoint YouTube channel here!
NOTE: The stocks reported herein are from mechanical trading model scans that are based upon moving average relationships, momentum and volume. DecisionPoint analysis is then applied to get five selections from the scans. The selections given should prompt readers to do a chart review using their own analysis process. This letter is not a call for a specific action to buy, sell or short any of the stocks provided. There are NO sure things or guaranteed returns on the daily selection of "Diamonds in the Rough."
Regarding BUY/SELL Signals: The signal status reported herein is based upon mechanical trading model signals and crossovers. They define the implied bias of the price index/stock based upon moving average relationships and momentum, but they do not necessarily call for a specific action. They are information flags that should prompt chart review. Further, they do not call for continuous buying or selling during the life of the signal. For example, a BUY signal will probably (but not necessarily) return the best results if action is taken soon after the signal is generated. Additional opportunities for buying may be found as price zigzags higher, but the trader must look for optimum entry points. Conversely, exit points to preserve gains (or minimize losses) may be evident before the model mechanically closes the signal.
Helpful DecisionPoint Links:
Price Momentum Oscillator (PMO)
Swenlin Trading Oscillators (STO-B and STO-V)
For more links, go to DecisionPoint.com