
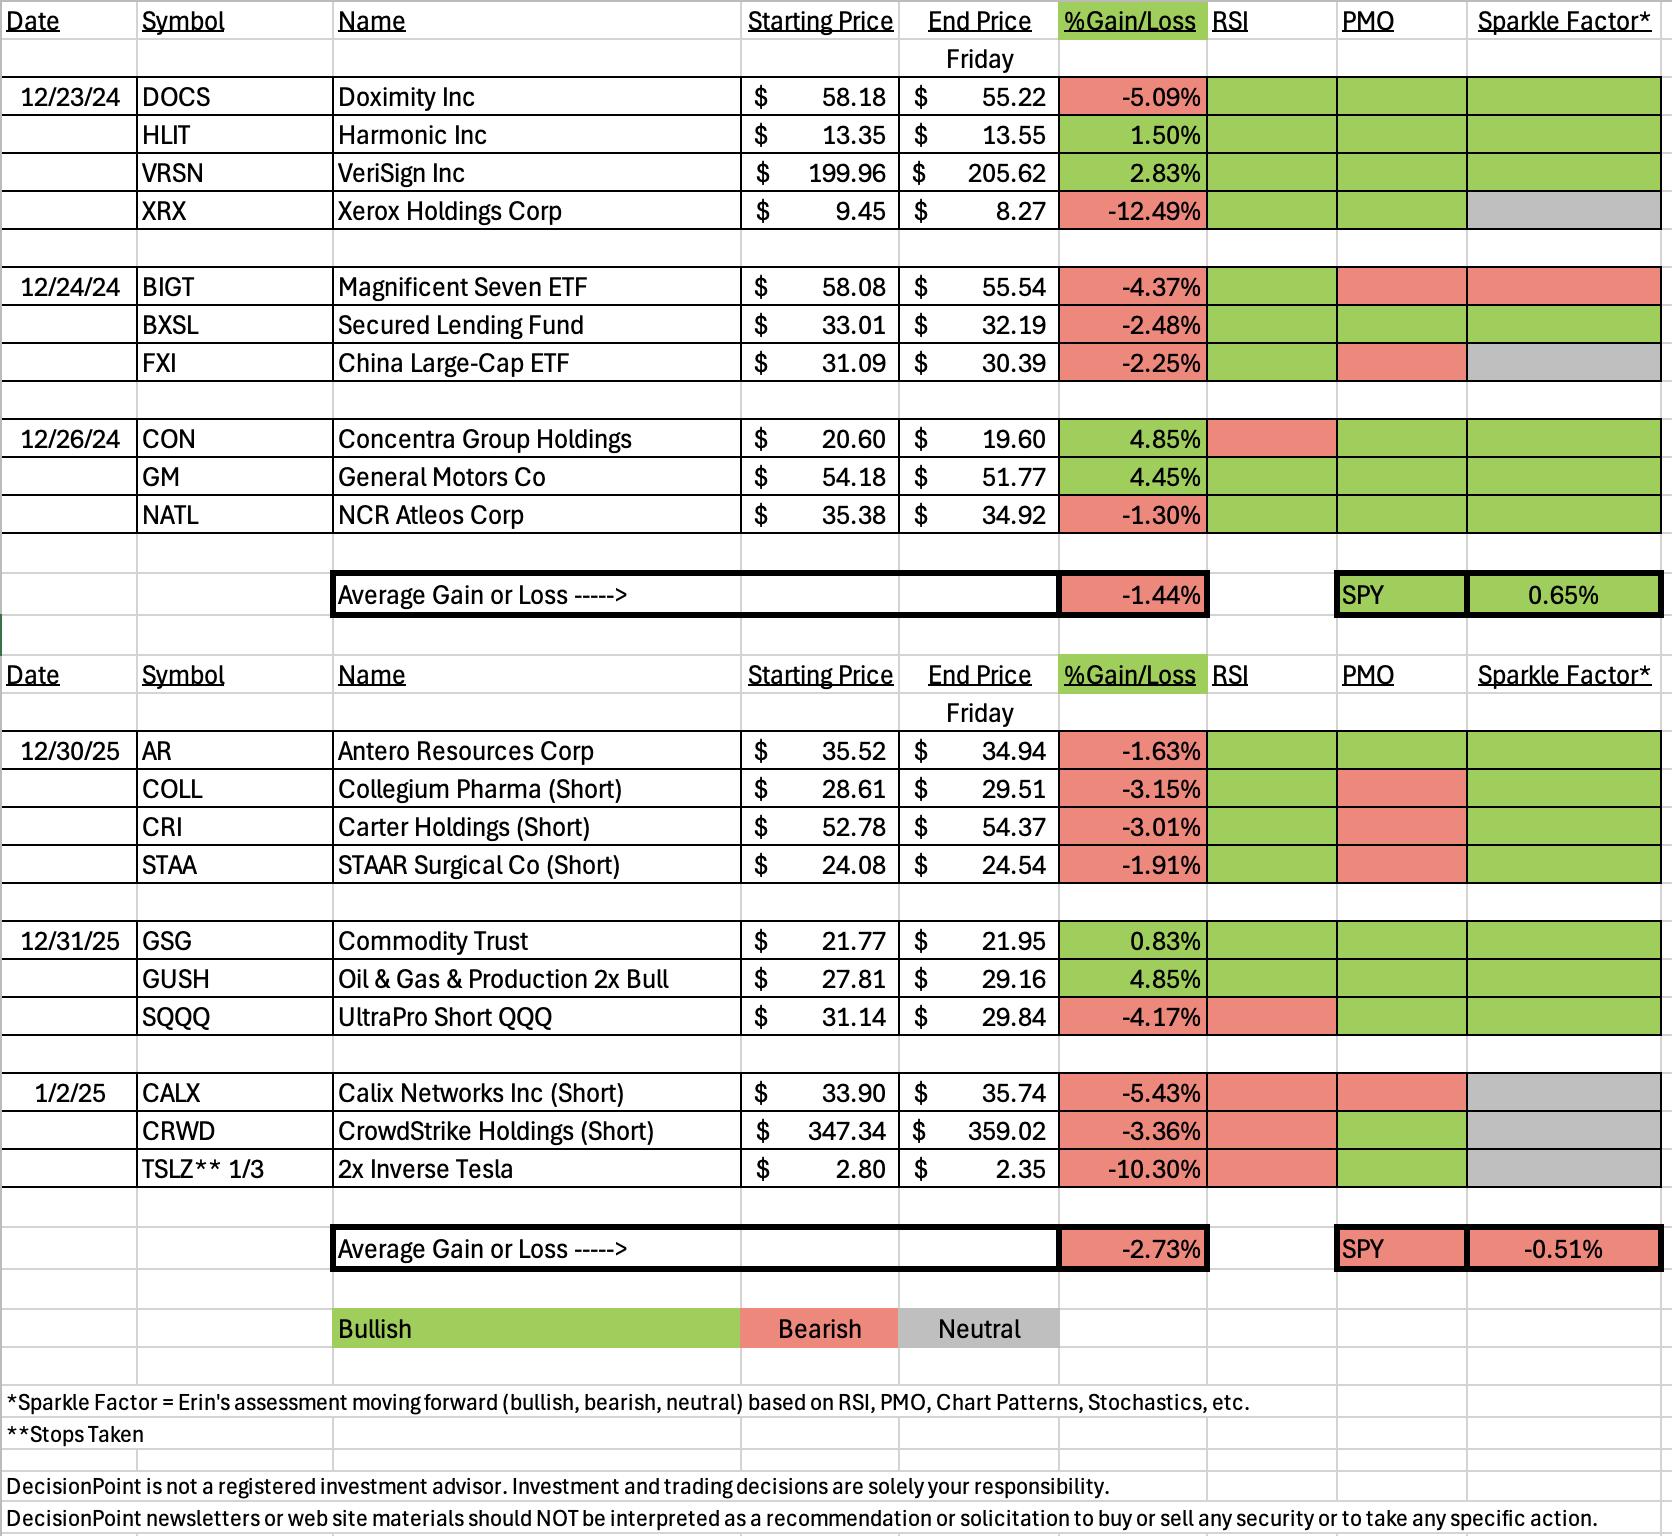
I went all in on my bearish outlook this week by picking numerous short positions. Today's rebound rally really hurt the spreadsheet, but I am still bearish on the market. I took an opportunity today to take profits on quite a few positions rather than wait and see on Monday. Certainly we could see some followthrough on today's rally, but ultimately based on internals, it should weaken not strengthen so for now I stand by my short positions.
Many of the shorts saw PMOs turn back up on today's rally. I still believe most of the charts look weak enough to continue to look for some downside. The three I picked yesterday do look a little suspect so I gave them "neutral" Sparkle Factors which gives you my perspective on the position moving forward.
This week's Darling was no surprise. GUSH the 2x bull ETF for Oil and Gas was up almost 5% since being picked. Crude and Energy still look bullish so I'm expecting this ETF to continue to outperform.
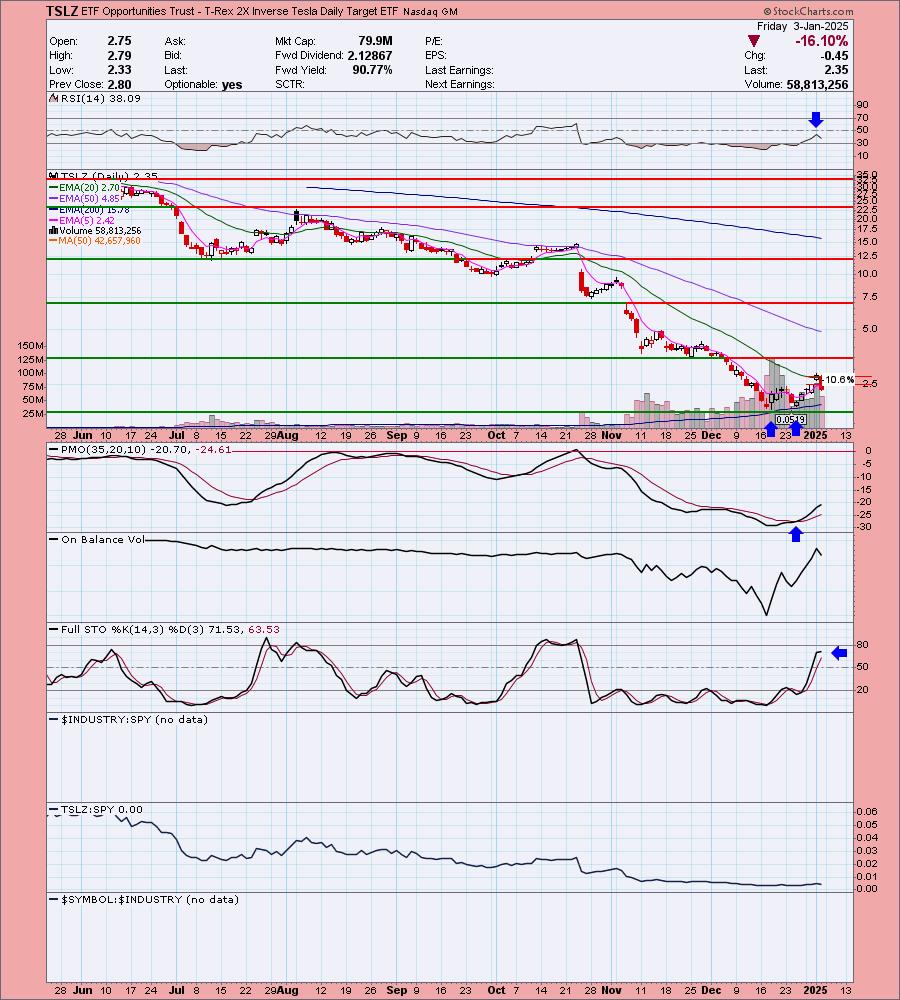
This week's Dud was the Tesla bear fund (TSLZ). Tesla bounced with a huge rally today that took out the position right away. I am still not bullish on Tesla as I think most of the Elon/Trump trade on the stock is likely over. It now has to stand on its own two legs. I've listed the position as neutral as I think it is up to you as to whether you take a continued risk in the ETF.
I narrowed it down to two Sectors to Watch, Utilities (XLU) and Energy (XLE). I opted to pick XLU as the rally in Energy has run for awhile and could be ready for some consolidation. XLU is on a new rising trend and had a very good day today.
I had two Industry Groups to Watch as I wasn't sure which sector I would choose. Conventional Electricity is ultimately my choice for next week. There were quite a few symbols of interest in this group: VST, ETR, CEPU, NRG, CEG and PCG. The other Industry Group was Pipelines in Energy. The symbols that looked promising were: KMI, DTM, EPO and HESM.
I ran a few scans to finish the trading room today. I wasn't thrilled with the results but I did find some more Energy positions as part of it: EQT, OKE, TPL and WHD.
See you in the free DP Trading Room on Monday at Noon ET!
Good Luck & Good Trading,
Erin

Diamond Mine Trading Room:
RECORDING & DOWNLOAD LINK (1/3/2025):
Topic: DecisionPoint Diamond Mine (1/3/2025) LIVE Trading Room
Recording & Download Link
Passcode: January#3
REGISTRATION for 1/10/2025:
When: January 10, 2025 09:00 AM Pacific Time (US and Canada)
Topic: DecisionPoint Diamond Mine LIVE Trading Room
Register in advance for this webinar HERE
After registering, you will receive a confirmation email containing information about joining the webinar.

Below is the latest free DecisionPoint Trading Room recording from 12/30. You'll find these recordings posted on Mondays to our DP YouTube Channel. Be sure and subscribe HERE.
A few items about the spreadsheet: I've put on the spreadsheet whether the RSI is positive (green) or negative (red). The PMO column tells you if it is rising (green) or falling (red). Finally I've added my own "Sparkle Factor" that gives you my assessment going forward, bullish (green), bearish (red) or neutral (gray). The Sparkle Factor is basically my thoughts on whether I expect it to rise or fall. A neutral means it could really go either way so it could be added to a watch list. If you're in a stock I consider "neutral" going forward, the ball is in your court.
Darling:
Direxion Daily S&P Oil & Gas Exp. & Prod. Bull 2x Shares (GUSH)
EARNINGS: N/A
GUSH provides 2x daily exposure to an equal-weighted index of the largest oil and gas exploration and production companies in the US. Click HERE for more information.
Predefined Scans Triggered: Elder Bar Turned Green and Bullish MACD Crossovers.
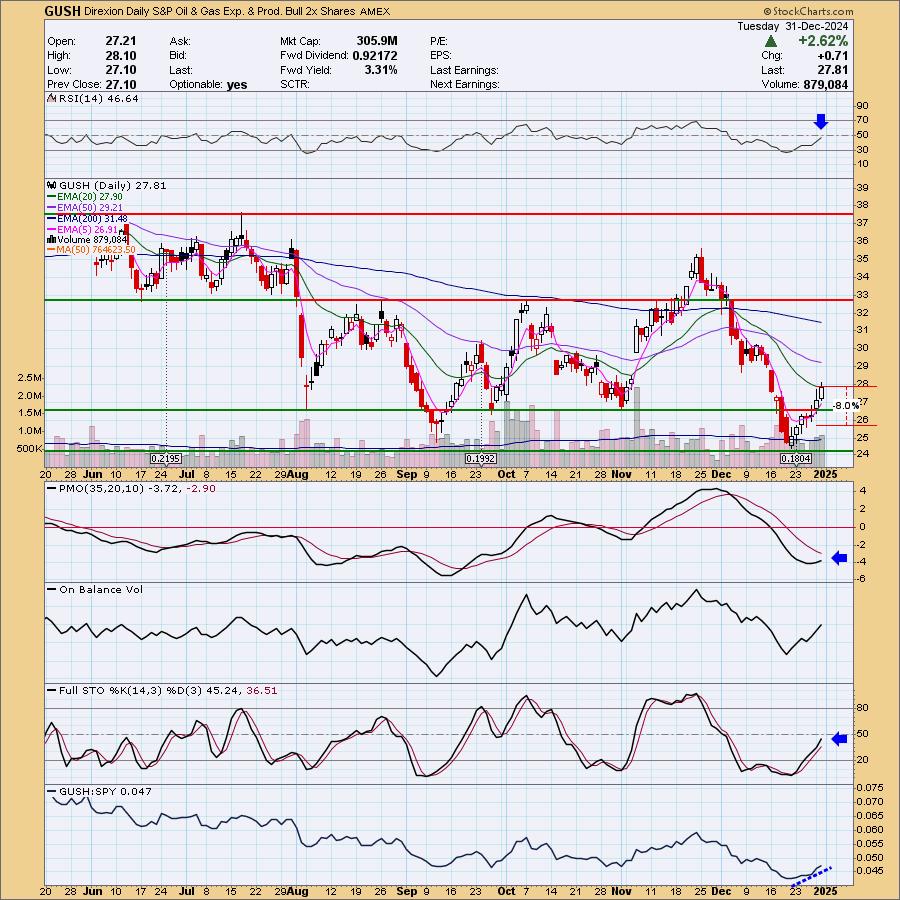
Below are the commentary and chart from Tuesday 12/31:
"GUSH is down -1.29% in after hours trading. Energy has been reversing and this chart looks very similar to the sector chart. The bounce is coming off strong support and has reentered the prior trading range. The RSI is not positive yet, but it is rising. The PMO is rising toward a Crossover BUY Signal. Stochastics aren't in positive territory but they are quickly headed upward toward 80. We can see that the ETF is outperforming the SPY currently. The stop is set deeply and could be set deeper given this is a leveraged ETF. I've set it at 8% or $25.58."
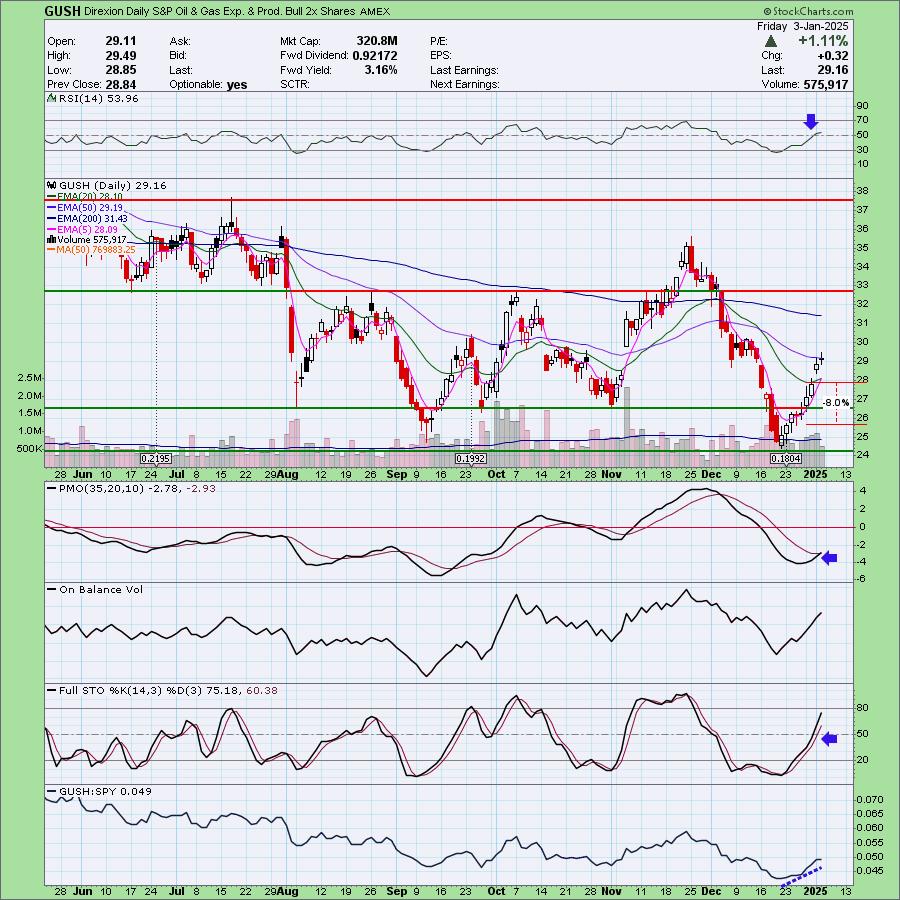
Here is today's chart:
With the current rally in Energy and particularly Crude Oil, this ETF was set up for success and success is what we got. The PMO has now triggered the Crossover BUY Signal. Stochastics just keep rising and the RSI is not at all overbought yet. This one still looks ripe, but we do need to prepare for a possible pause in Crude as it is getting close to overhead resistance.
Don't forget, on Thursdays I look at reader-requested symbols, so shoot me an email at erin@decisionpoint.com. I read every email I receive and try to answer them all!
Dud:
ETF Opportunities Trust - T-Rex 2X Inverse Tesla Daily Target ETF (TSLZ)
EARNINGS: N/A
TSLZ aims to provide (-2x) inverse exposure to the daily price movement of Tesla, Inc. stock, less fees, and expenses. Click HERE for more information.
Predefined Scans Triggered: Gap Ups and Runaway Gap Ups.
Below are the commentary and chart from Thursday 1/2:
"TSLZ is down -0.18% in after hours trading. Today investors were reminded that Tesla is actually an EV maker and not just about Elon's ties to President-Elect Trump. They had their first annual drop in deliveries and it took the stock down over 6% today. This seems a wake-up call and should lead to more downside on this highly inflated stock. This is the inverse fund for TSLA. We have a bullish double-bottom and a runaway or breakaway gap higher. The RSI is still negative, but is on its way up. The PMO is rising strongly on a Crossover BUY Signal. Stochastics are nearing 80 on their rise. It is leveraged so I had to list a deeper stop than usual at 10.6% or $2.50."
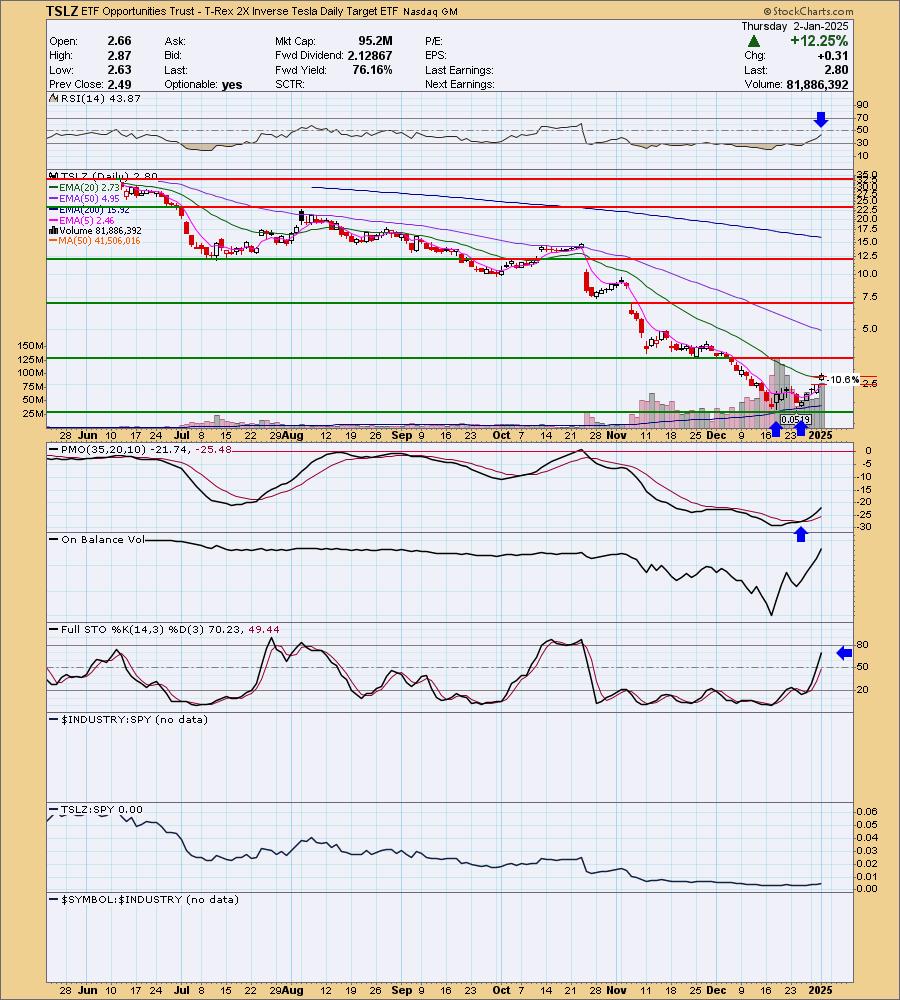
Here is today's chart:
The main problem is the "buy the dip" that occurred on today's market rally. TSLA was down quite a bit yesterday and it made this a very attractive ETF. I am still a fan of this one as I do think TSLA will pullback or correct the post-election rally, but really this is a decision you'll need to make as the 2x exposure makes this one particularly risky. We can see the damage that can be done on a leveraged ETF.
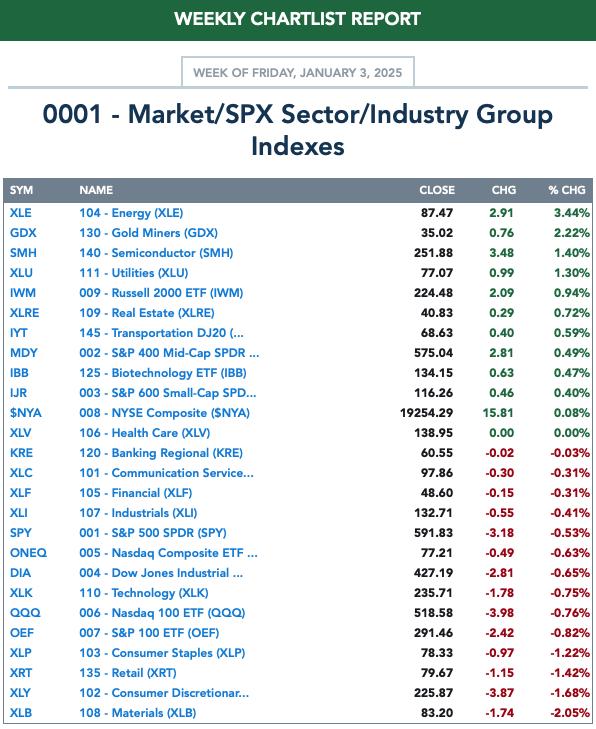
THIS WEEK's Performance:
DecisionPoint Market Scoreboard (Mechanical Trend Model Signals):
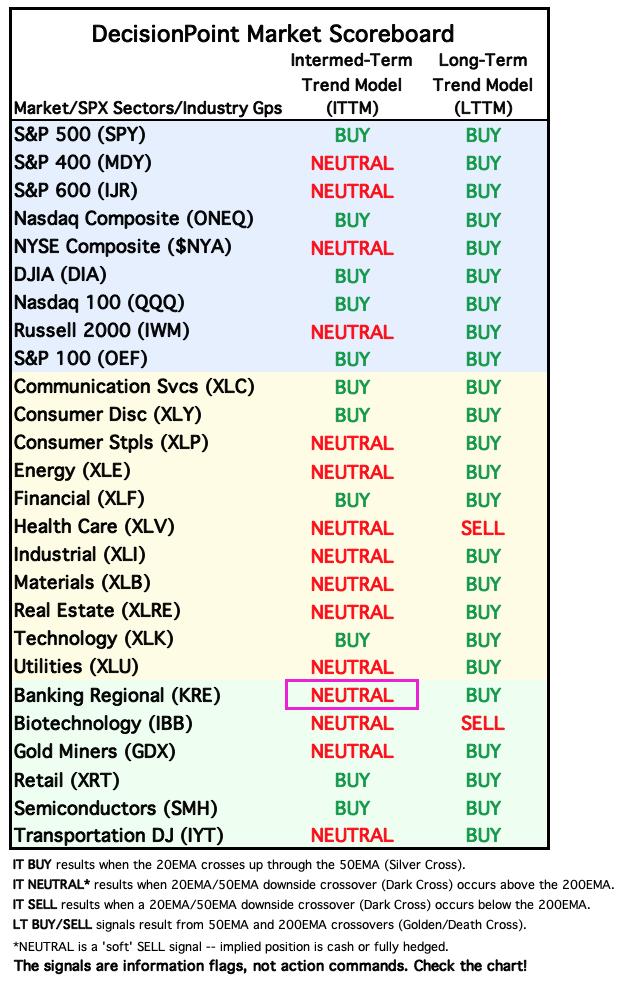
Friday signal changes are outlined in purple.
Click Here to view Carl's annotated "Under the Hood" ChartList!
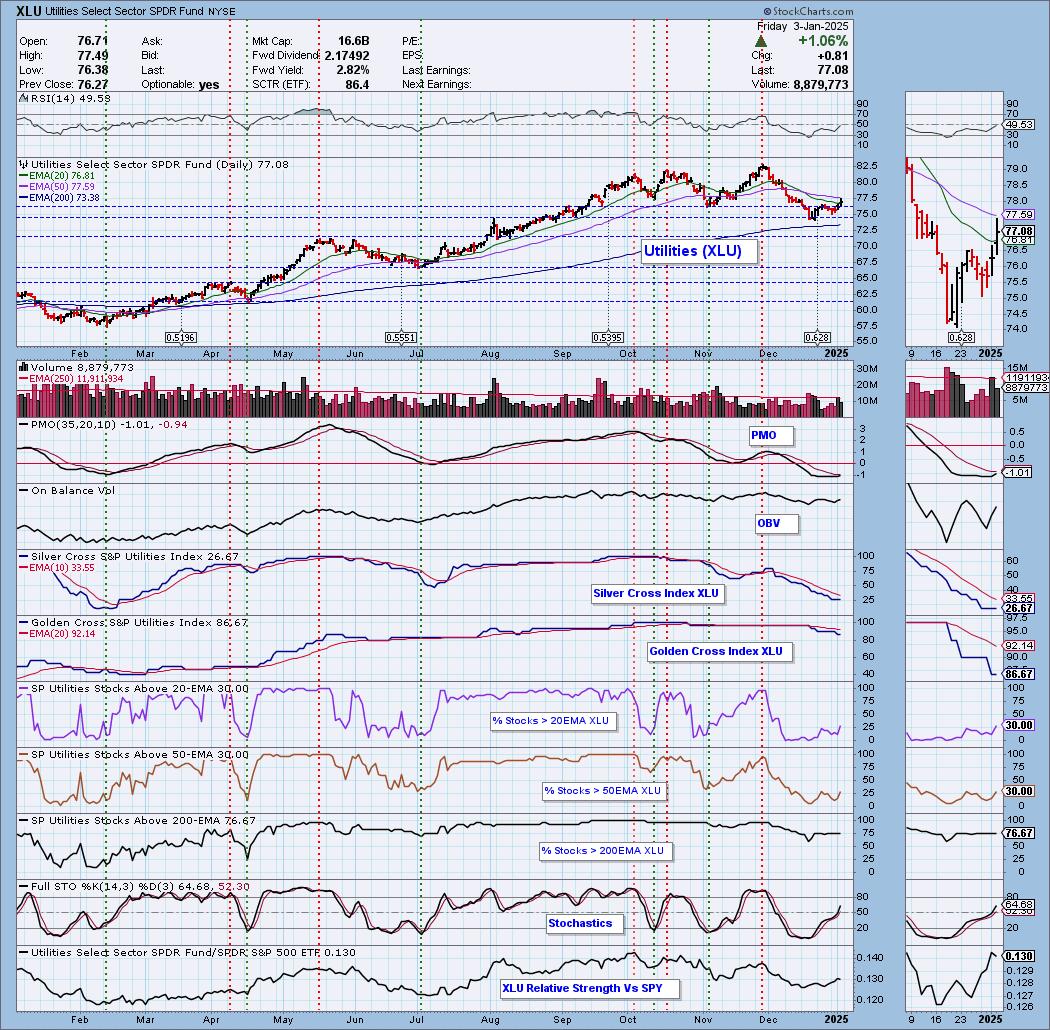
Sector to Watch: Utilities (XLU)
I was looking for new momentum which is primarily the reason I didn't pick Energy (XLE) today for the Sector to Watch. I like today's rally which brought price back on top of the support zone. I would've have preferred to have seen a move above the 50-day EMA, but it's early. The RSI is not positive, but should get there with another rally. The PMO turned up today. Admittedly the Silver Cross Index is very low but we are seeing nice improvement to stocks above key moving averages and that could get the Silver Cross Index to turn around. Stochastics are rising strongly and we do see that the sector is outperforming the SPY.
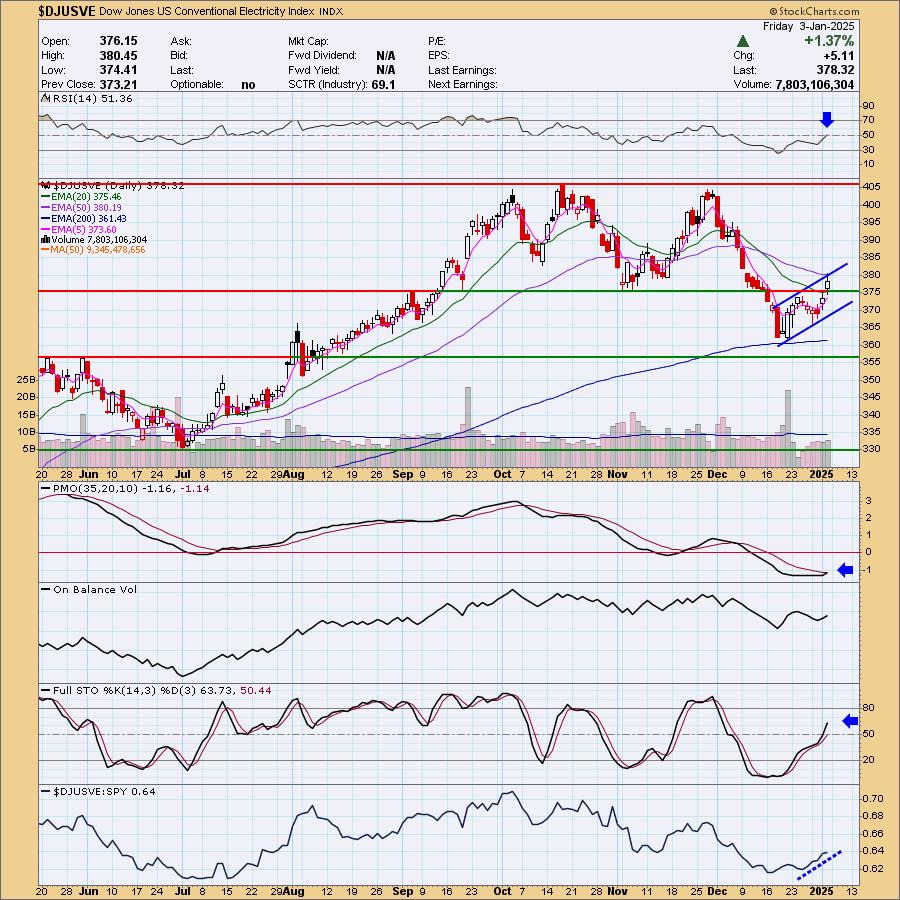
Industry Group to Watch: Conventional Electricity ($DJUSVE)
I liked today's breakout and the development of a new rising trend channel. I will say that this could be a flag on a reverse flag formation and that is bearish, but the indicators are getting better and we have this recent breakout. The RSI just moved into positive territory and the PMO is nearing a Crossover BUY Signal. Stochastics are rising nicely and the group is currently outperforming the SPY. Symbols of interest: VST, ETR, CEPU, NRG, CEG and PCG.
Go to our Under the Hood ChartList on DecisionPoint.com to get an in-depth view of all the sectors. On StockCharts.com you can find the Industry Summary.
Good Luck & Good Trading!
- Erin
erin@decisionpoint.com
Full Disclosure: I'm 15% long, 0% short.
Watch the latest episode of the DecisionPoint Trading Room with Carl & Erin Swenlin HERE!
Technical Analysis is a windsock, not a crystal ball. --Carl Swenlin
NOTE: The stocks reported herein are from mechanical trading model scans that are based upon moving average relationships, momentum and volume. DecisionPoint analysis is then applied to get selections from the scans. The selections given should prompt readers to do a chart review using their own analysis process. This letter is not a call for a specific action to buy, sell or short any of the stocks provided. There are NO sure things or guaranteed returns on the selection of "diamonds in the rough."
Helpful DecisionPoint Links:
DecisionPoint Shared ChartList and DecisionPoint Chart Gallery
Price Momentum Oscillator (PMO)
Swenlin Trading Oscillators (STO-B and STO-V)
(c) Copyright 2025 DecisionPoint.com