
I'm not the only one feeling bearish about the market moving forward. Readers are feeling bearish too as the two requests I received were on the short side, not long. I added a third symbol and I'm going short too.
I'm in the process of determining what to do with my current positions given my bearish expectation. More than likely all but one or two buy and holds will survive. I didn't pick up the SQQQ hedge from last time, but it is the one I'll likely go to by the end of the week.
Speaking of the end of the week, there will be a Diamond Mine trading room tomorrow morning. We'll see if the market can reverse its current direction and possibly churn upward. I don't have much faith in its ability to stave off a January pullback or correction.
Good Luck & Good Trading,
Erin
Today's "Diamonds in the Rough": CALX (Short), CRWD (Short) and TSLZ.

Diamond Mine Trading Room:
RECORDING & DOWNLOAD LINK (12/20/2024):
Topic: DecisionPoint Diamond Mine (12/20/2024) LIVE Trading Room
Recording & Download Link
Passcode: December#20
REGISTRATION for 1/3/2025:
When: January 3, 2025 09:00 AM Pacific Time (US and Canada)
Topic: DecisionPoint Diamond Mine LIVE Trading Room
Register in advance for this webinar HERE
After registering, you will receive a confirmation email containing information about joining the webinar.

Below is the latest free DecisionPoint Trading Room recording from 12/30. You'll find these recordings posted on Mondays to our DP YouTube Channel. Be sure and subscribe HERE.
Welcome to DecisionPoint Diamonds, wherein I highlight ten "Diamonds in the Rough" per week. These are selected from the results of my DecisionPoint Scans which search for stocks that could benefit from the trend and condition of the market. Remember, these are not recommendations to buy or sell, but are the most interesting of the stocks that surfaced in my scans. My objective is to save you the work of the initial, tedious culling process, but you need to apply your own analysis to see if these stocks pique your interest as well. There are no guaranteed winners here!
"Predefined Scans Triggered" are taken from StockCharts.com using the "Symbol Summary" option instead of a "SharpChart" on the workbench.
Stop levels are all rounded down.
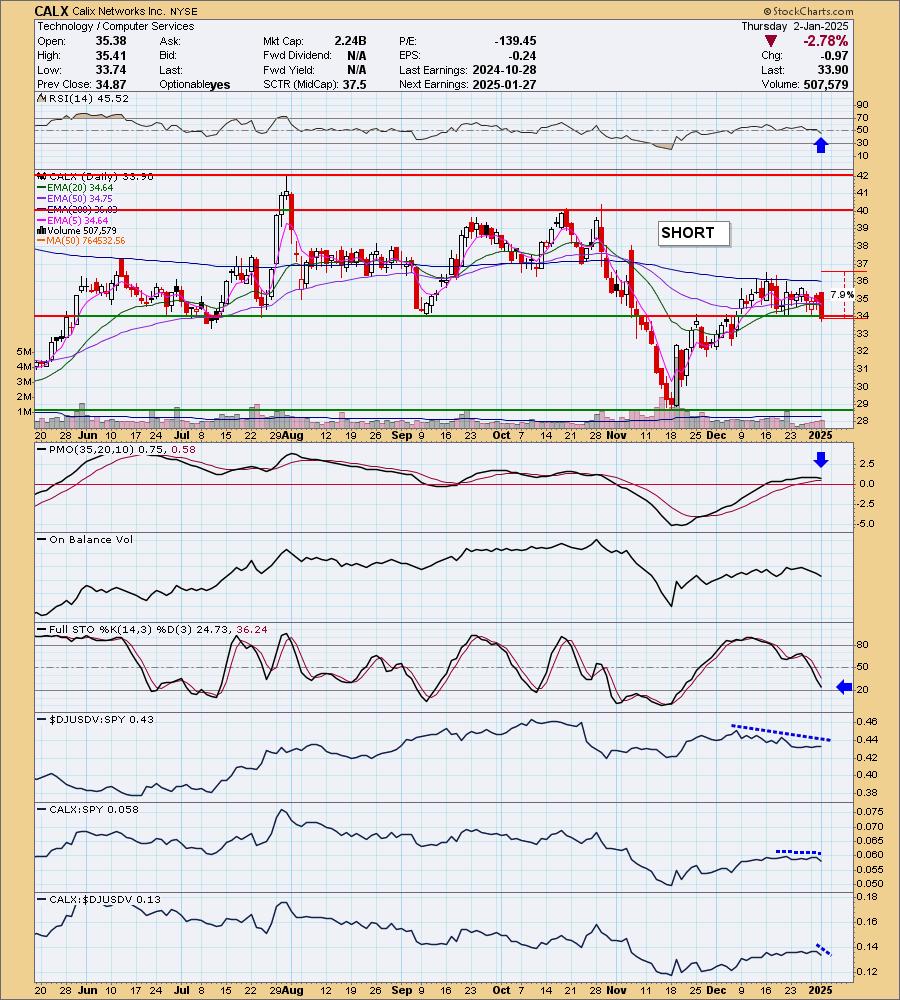
Calix Networks Inc. (CALX)
EARNINGS: 2025-01-27 (AMC)
Calix, Inc. provides cloud and software platforms, systems and services required to realize the unified access network. The firm offers broadband communications access systems and software for fiber and copper-based network architectures that enable communications service providers to transform their networks and connect to their residential and business subscribers. It enables communication service providers to provide a wide range of revenue-generating services from basic voice and data to advanced broadband services over legacy and next-generation access networks. The firm focuses on communications service providers access networks with the portion of the network, which governs available bandwidth and determines the range and quality of services that can be offered to subscribers. It also develops and sells carrier-class hardware and software products. The company was founded by Michael L. Hatfield and Carl E. Russo in August 1999 and is headquartered in San Jose, CA.
Predefined Scans Triggered: Bearish MACD Crossovers, P&F Low Pole and Entered Ichimoku Cloud.
CALX is unchanged in after hours trading. This reader request was very interesting as we can see price is in a new declining trend. Price is also rounding off and today lost support after forming a bearish engulfing candlestick. The RSI has just moved into negative territory and the PMO is headed lower. Stochastics are also a problem for it right now. Relative strength for the group is failing and CALX is starting to see a little underperformance. I've set the upside stop above the 200-day EMA as close to overhead resistance as possible at 7.9% or $36.57.
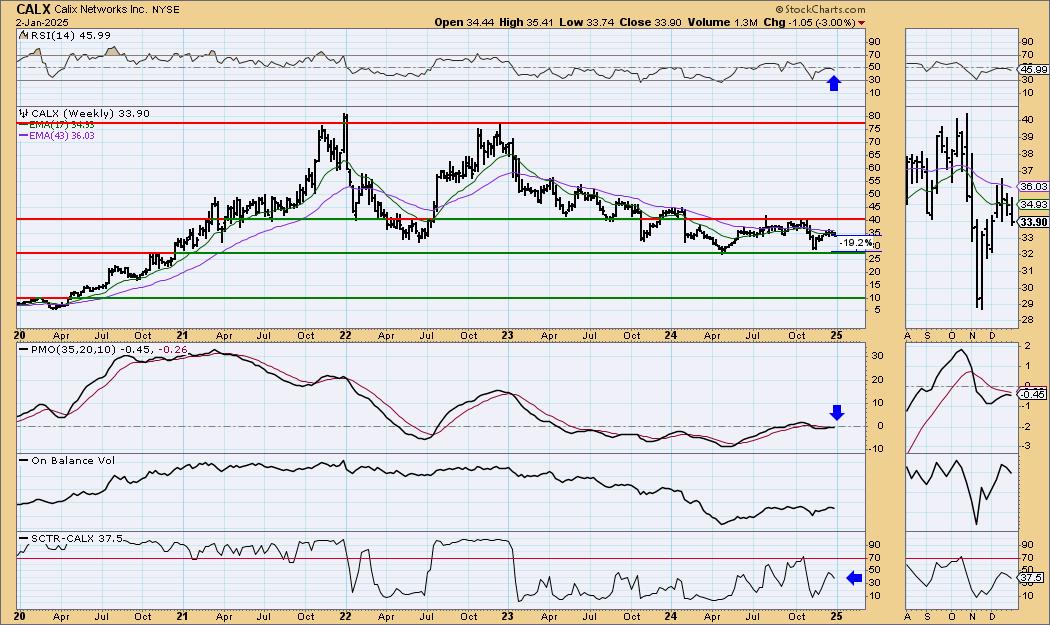
Price has been stuck in a sideways trading range. It was unable to test the top of it before heading lower which is definitely bearish. It is now headed to the bottom of the range and offers pretty good profit to the downside. The weekly RSI is negative as we want. The weekly PMO is topping beneath the signal line which is especially bearish. The StockCharts Technical Rank (SCTR) is outside of the hot zone* as we would want on a short.
*If a stock is in the "hot zone" above 70, it implies that it is stronger than 70% of its universe (large-, mid-, small-caps and ETFs) primarily in the intermediate to long terms.
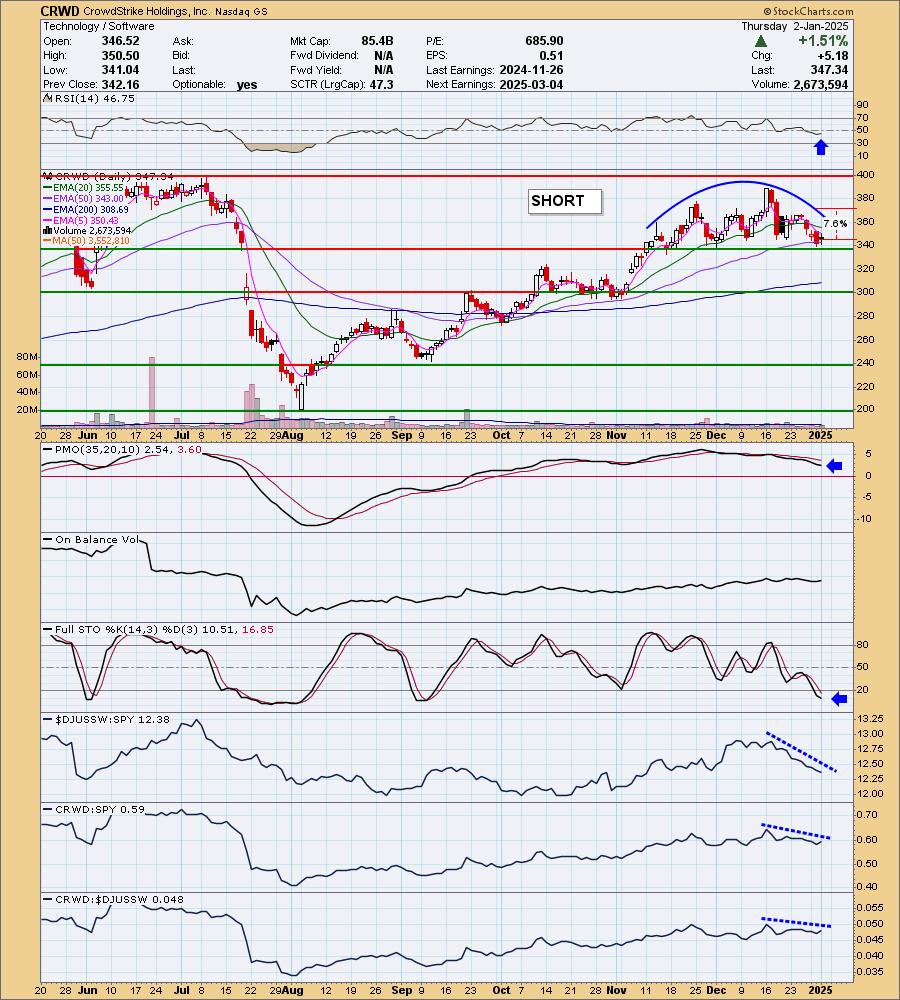
CrowdStrike Holdings, Inc. (CRWD)
EARNINGS: 2025-03-04 (AMC)
CrowdStrike Holdings, Inc. provides cybersecurity products and services to stop breaches. It offers cloud-delivered protection across endpoints, cloud workloads, identity and data, and threat intelligence, managed security services, IT operations management, threat hunting, Zero Trust identity protection, and log management. CrowdStrike serves customers worldwide. The company was founded by George P. Kurtz, Gregg Marston, and Dmitri Alperovitch on November 7, 2011, and is headquartered in Austin, TX.
Predefined Scans Triggered: P&F Double Bottom Breakdown, P&F Quadruple Bottom Breakdown and P&F Triple Bottom Breakdown.
CRWD is down -0.01% in after hours trading. Support is currently holding but we do see a bearish rounded top that implies we will get a breakdown. The RSI is in negative territory. The PMO is headed lower on a Crossover SELL Signal. Stochastics are below 20 and falling further. The industry group is definitely seeing problems given its declining relative strength line. We're also seeing some failure by CRWD to outperform. I've set the upside stop at the last price top at 7.6% or $373.73.
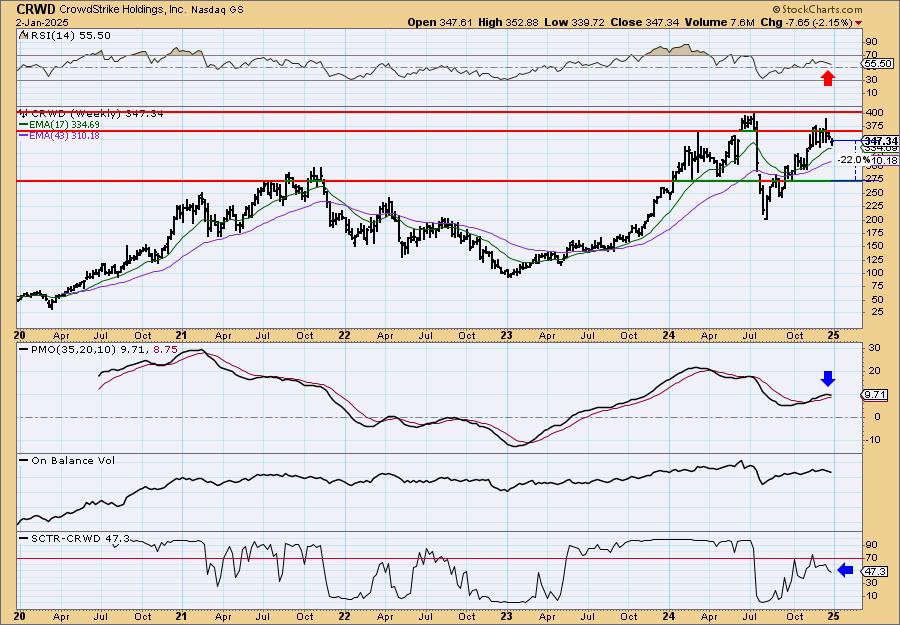
Price looks alright on the weekly chart as the rising trend is in place. Price is trying to break that rising trend currently. The weekly RSI is still positive but is headed lower. The weekly PMO has topped and the SCTR has left the hot zone above 70. Downside potential looks good.
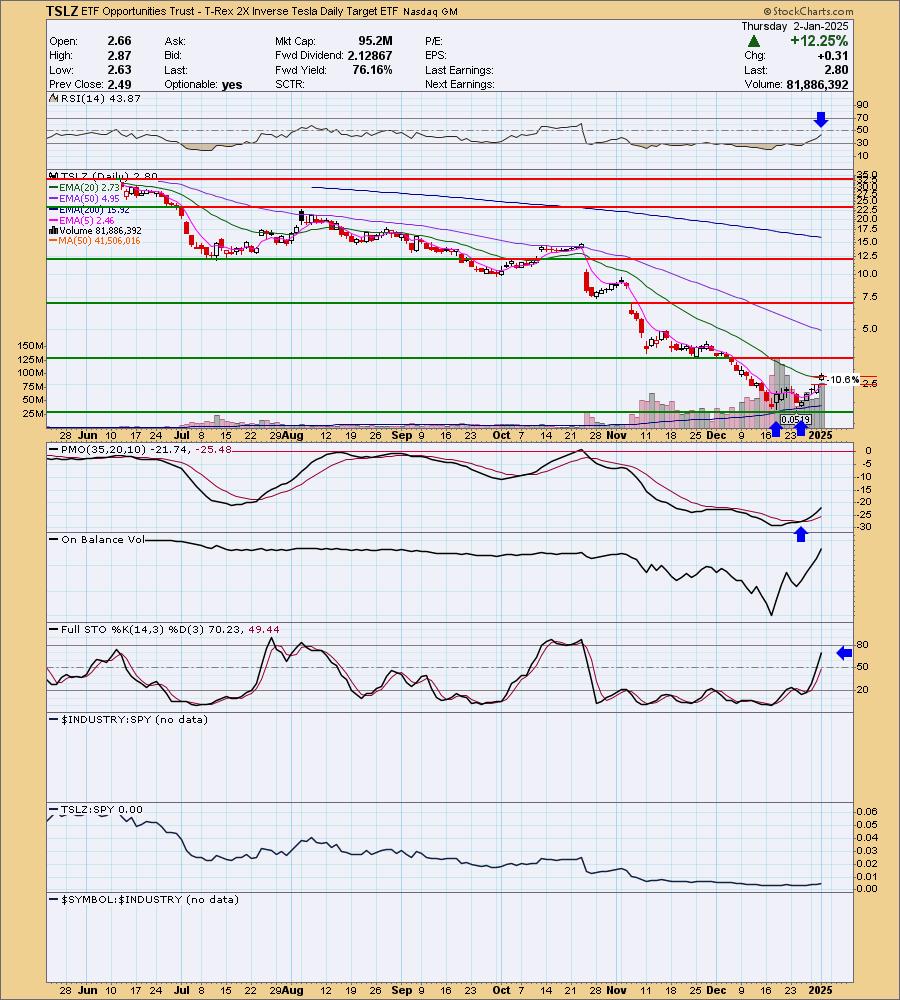
ETF Opportunities Trust - T-Rex 2X Inverse Tesla Daily Target ETF (TSLZ)
EARNINGS: N/A
TSLZ aims to provide (-2x) inverse exposure to the daily price movement of Tesla, Inc. stock, less fees, and expenses. Click HERE for more information.
Predefined Scans Triggered: Gap Ups and Runaway Gap Ups.
TSLZ is down -0.18% in after hours trading. Today investors were reminded that Tesla is actually an EV maker and not just about Elon's ties to President-Elect Trump. They had their first annual drop in deliveries and it took the stock down over 6% today. This seems a wake-up call and should lead to more downside on this highly inflated stock. This is the inverse fund for TSLA. We have a bullish double-bottom and a runaway or breakaway gap higher. The RSI is still negative, but is on its way up. The PMO is rising strongly on a Crossover BUY Signal. Stochastics are nearing 80 on their rise. It is leveraged so I had to list a deeper stop than usual at 10.6% or $2.50.
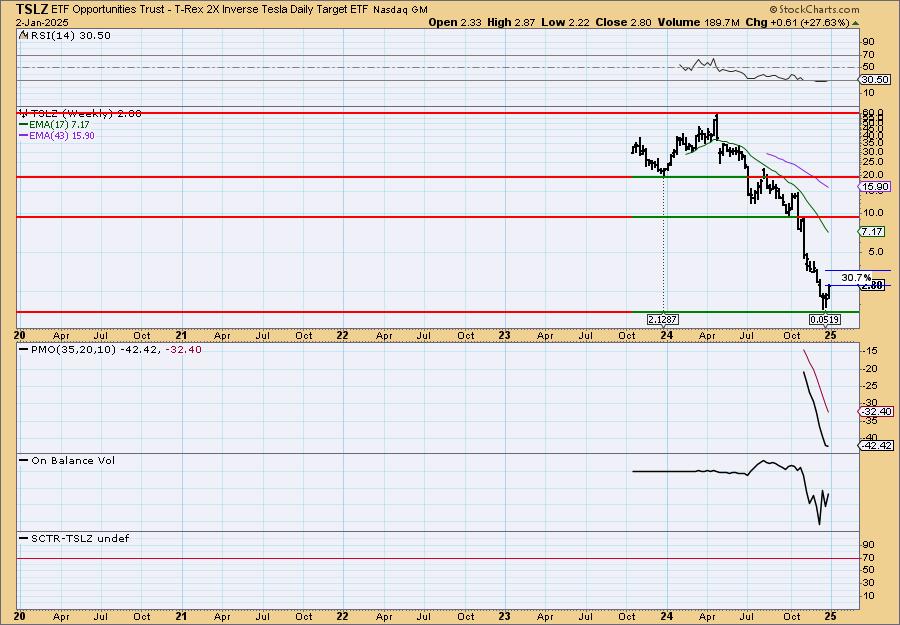
The weekly chart looks pretty bad given the deep parabolic decline, but we are seeing some positive movement finally. The weekly RSI is negative but rising again. The weekly PMO is in decline but is decelerating.
Don't forget, on Thursdays I look at reader-requested symbols, click HERE to send me an email. I read every email I receive and try to answer them all!
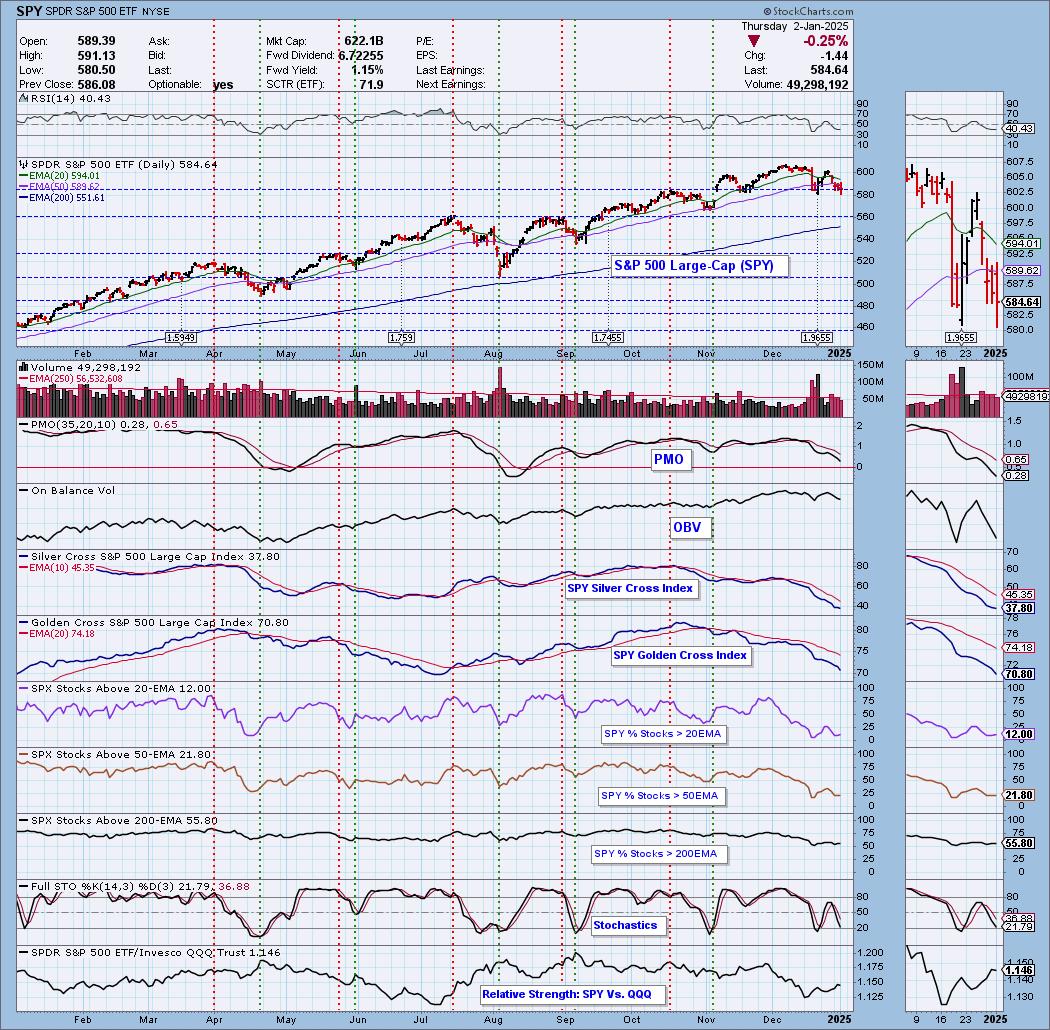
Current Market Outlook:
Market Environment: It is important to consider the odds for success by assessing the market tides. The following chart uses different methodologies for objectively showing the depth and trend of participation for intermediate- and long-term time frames.
- The Silver Cross Index (SCI) shows the percentage of SPX stocks on IT Trend Model BUY signals (20-EMA > 50-EMA)
- The Golden Cross Index (GCI) shows the percentage of SPX stocks on LT Trend Model BUY signals (50-EMA > 200-EMA)
Don't forget that as a "Diamonds" member, you have access to our "Under the Hood" curated ChartList on DecisionPoint.com. You'll find it under "Members Only" links on the left side on the Blogs and Links Page.
Here is the current chart:
Full Disclosure: I am 35% long, 0% short.
I'm required to disclose if I currently own a stock I mention and/or may buy/short it within the next 72 hours.
"Technical Analysis is a windsock, not a crystal ball." - Carl Swenlin
(c) Copyright 2025 DecisionPoint.com
Watch the latest episode of DecisionPoint Trading Room with Carl & Erin Swenlin Mondays on the DecisionPoint YouTube channel here!
NOTE: The stocks reported herein are from mechanical trading model scans that are based upon moving average relationships, momentum and volume. DecisionPoint analysis is then applied to get five selections from the scans. The selections given should prompt readers to do a chart review using their own analysis process. This letter is not a call for a specific action to buy, sell or short any of the stocks provided. There are NO sure things or guaranteed returns on the daily selection of "Diamonds in the Rough."
Regarding BUY/SELL Signals: The signal status reported herein is based upon mechanical trading model signals and crossovers. They define the implied bias of the price index/stock based upon moving average relationships and momentum, but they do not necessarily call for a specific action. They are information flags that should prompt chart review. Further, they do not call for continuous buying or selling during the life of the signal. For example, a BUY signal will probably (but not necessarily) return the best results if action is taken soon after the signal is generated. Additional opportunities for buying may be found as price zigzags higher, but the trader must look for optimum entry points. Conversely, exit points to preserve gains (or minimize losses) may be evident before the model mechanically closes the signal.
Helpful DecisionPoint Links:
Price Momentum Oscillator (PMO)
Swenlin Trading Oscillators (STO-B and STO-V)
For more links, go to DecisionPoint.com