
The scans are really struggling to produce "Diamonds in the Rough", but I did manage to find some good looking candidates for your review. In general I would say the market will likely inch higher or sideways through the end of the month. January will not be good so buckle up. I hope I'm wrong, but I suspect once the holidays wrap up the internal weakness that we still see will finally bring the market down. For now be sure you have your stops set. Limiting exposure isn't a bad idea going into January.
For those of you with the Scan Alert System, you'll note that one of today's selections was not on your list. I open up my scans sometimes to include the whole universe of stocks not just the universe I give to you which is the SP1500, NDX and Dow 65.
RIOT is listed as a runner-up and I almost included it, but it is very volatile as it is blockchain related. Being related to Bitcoin on some level, I think it has a lot of upside potential. I just don't like to include volatile stocks if I can help it. Definitely take a look at that chart.
I'm still determining how I want to handle the upcoming holiday weeks. I believe I will do the trading room on Friday after Christmas and after New Year's Day, but I may cancel one of them. Still deciding. If you have preference as to which one I do should I cancel one, let me know.
Good Luck & Good Trading,
Erin
Today's "Diamonds in the Rough": AGYS, CENTA, VRNA and WSR.
Runner-ups: TTMI, RIOT and REG.

Diamond Mine Trading Room:
RECORDING & DOWNLOAD LINK (12/13/2024):
Topic: DecisionPoint Diamond Mine (12/13/2024) LIVE Trading Room
Download & Recording Link
Passcode: December#13
REGISTRATION for 12/20/2024:
When: December 20, 2024 09:00 AM Pacific Time (US and Canada)
Topic: DecisionPoint Diamond Mine LIVE Trading Room
Register in advance for this webinar HERE
After registering, you will receive a confirmation email containing information about joining the webinar.

Below is the latest free DecisionPoint Trading Room recording from 12/16. You'll find these recordings posted on Mondays to our DP YouTube Channel. Be sure and subscribe HERE.
Welcome to DecisionPoint Diamonds, wherein I highlight ten "Diamonds in the Rough" per week. These are selected from the results of my DecisionPoint Scans which search for stocks that could benefit from the trend and condition of the market. Remember, these are not recommendations to buy or sell, but are the most interesting of the stocks that surfaced in my scans. My objective is to save you the work of the initial, tedious culling process, but you need to apply your own analysis to see if these stocks pique your interest as well. There are no guaranteed winners here!
"Predefined Scans Triggered" are taken from StockCharts.com using the "Symbol Summary" option instead of a "SharpChart" on the workbench.
Stop levels are all rounded down.
Agilysys Inc. (AGYS)
EARNINGS: 2025-01-30 (AMC)
Agilysys, Inc. operates as a technology company. It offers innovative software for point-of-sale, payment gateway, reservation and table management, guest offers management, property management, inventory and procurement, analytics, document management, and mobile and wireless solutions and services to the hospitality industry. The firm also serves the gaming industry for both corporate and tribal, hotels resort and cruise, foodservice management, and the restaurant, university, and healthcare sectors. The company was founded in 1963 and is headquartered in Alpharetta, GA.
Predefined Scans Triggered: Stocks in a New Uptrend (Aroon), Moved Above Upper Price Channel, P&F Ascending Triple Top Breakout, New CCI Buy Signals, P&F Double Top Breakout and New 52-week Highs.
AGYS is up +2.36% in after hours trading. The breakout from a flag-like chart pattern is what impressed me on this chart. It helps that the RSI is not overbought. The PMO reversed well above the zero line and is on a new Crossover BUY Signal. Stochastics look very bullish as they near 80. The industry group is doing very well likely due to Apple (AAPL). AGYS is showing leadership against the group and it is outperforming the SPY easily. The stop is set near the 20-day EMA at 7.3% or $131.39.

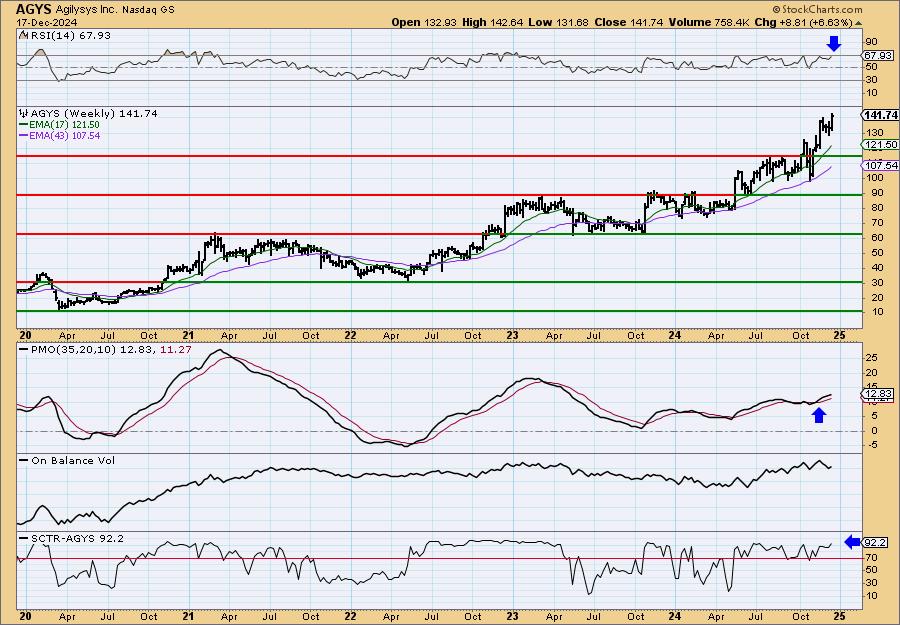
I do admit that the rising trend is starting to get parabolic, but it hasn't really gone vertical at this point. The weekly RSI is positive and not yet overbought. There is a strong rising trend that developed on the last breakout. The weekly PMO is on a Crossover BUY Signal and is rising. The StockCharts Technical Rank (SCTR) is at the top of the hot zone* above 70. Consider a 17% upside target to about $165.84.
*If a stock is in the "hot zone" above 70, it implies that it is stronger than 70% of its universe (large-, mid-, small-caps and ETFs) primarily in the intermediate to long terms.
Central Garden & Pet Co. (CENTA)
EARNINGS: 2025-02-06 (AMC)
Central Garden & Pet Co. engages in the production and distribution of branded and private label products for the lawn, garden, and pet supplies markets. It operates through the Pet and Garden segments. The Pet segment focuses on dog and cat supplies such as dog treats and chews, toys, pet beds and containment, grooming products, waste management and training pads, supplies for aquatics, small animals, reptiles and pet birds including toys, cages and habitats, bedding, food and supplements, products for equine and livestock, animal and household health and insect control products, live fish and small animals as well as outdoor cushions. The Garden segment includes lawn and garden consumables such as grass, vegetable, flower and herb seed, wild bird feed, bird houses and other birding accessories, weed, grass, and other herbicides, insecticide and pesticide products, fertilizers, and live plants. The company was founded by William E. Brown in 1980 and is headquartered in Walnut Creek, CA.
Predefined Scans Triggered: Elder Bar Turned Green, New CCI Buy Signals, Moved Above Upper Keltner Channel, Moved Above Upper Bollinger Band, Moved Above Upper Price Channel, Parabolic SAR Buy Signals, P&F Double Top Breakout and P&F Triple Top Breakout.
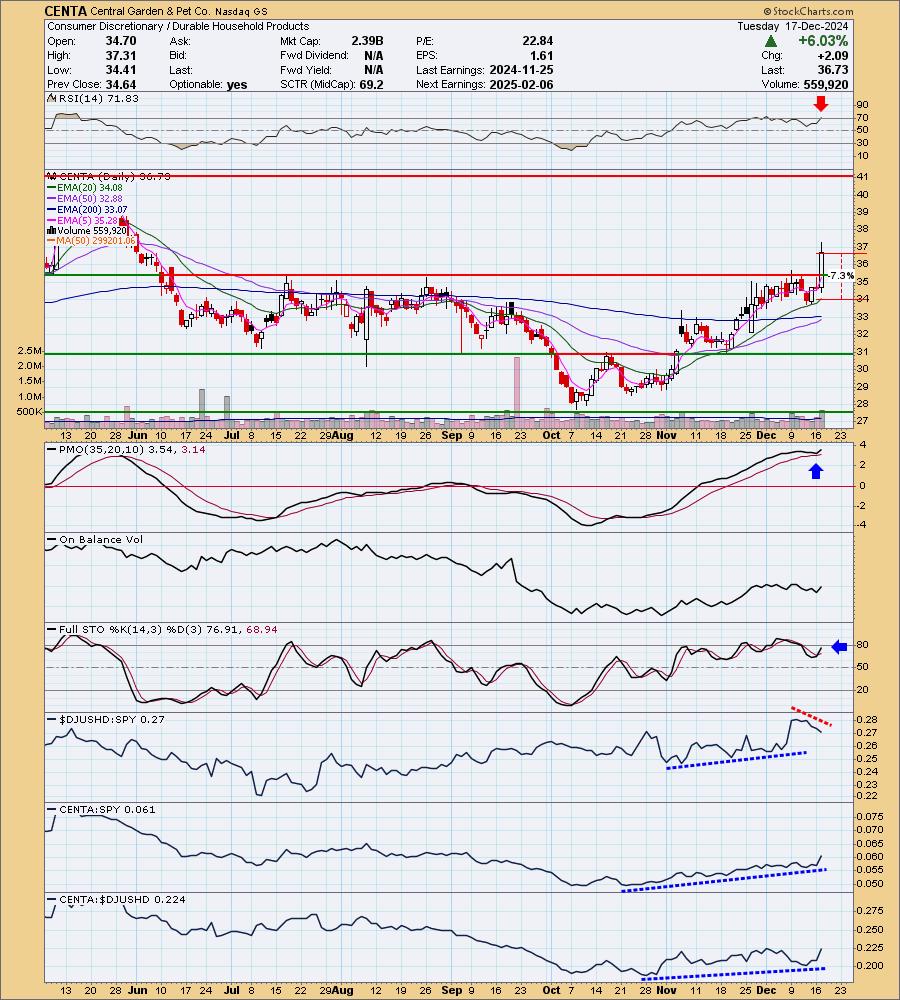
CENTA is unchanged in after hours trading. This breakout was impressive as it took price above very strong overhead resistance. It has already been enjoying a nice rising trend. The RSI is overbought though so it could probably use a small break, maybe a pullback back toward the breakout point. The PMO has surged above the signal line and is reading well above zero. Stochastics are rising in positive territory. The group over time has been seeing rising relative strength, but I do note that it is beginning to fail right now. Good thing for CENTA it is outperforming the group and the SPY. The stop is set near the 20-day EMA at 7.3% or $34.04.
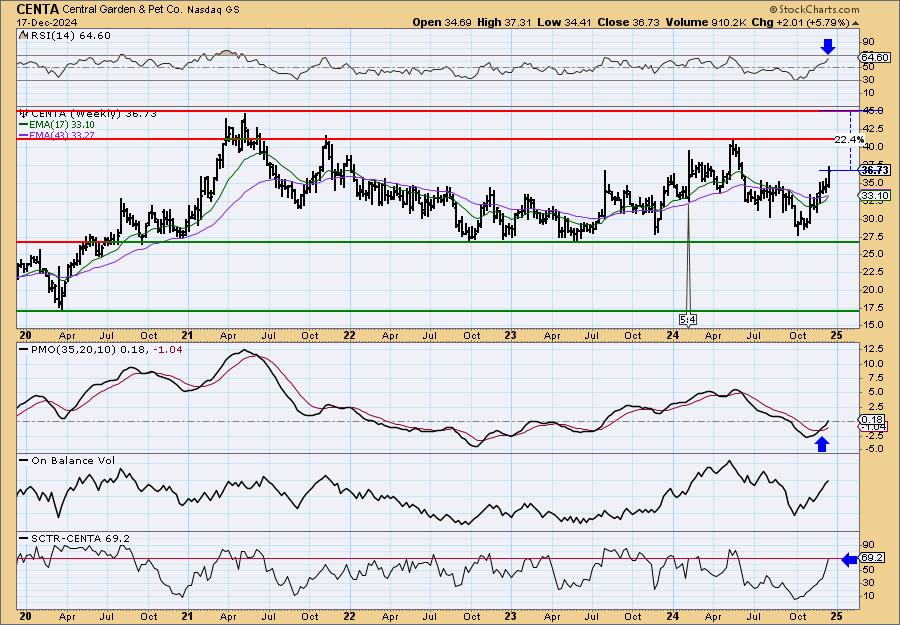
It isn't the best weekly chart as we can see that CENTA is rangebound. It is headed back to the top of the range, but it could get hung up at the 2024 high. That would still be an over 14% gain should it stall there. The weekly RSI is positive and not overbought and the weekly PMO is rising on a Crossover BUY Signal. The weekly PMO just hit positive territory indicating new strength. The SCTR is very close to the hot zone.
Verona Pharma PLC (VRNA)
EARNINGS: 2025-02-27 (BMO)
Verona Pharma Plc engages in the development and commercialization of therapeutics for the treatment of respiratory diseases. It focuses on developing inhaled ensifentrine for the maintenance treatment of chronic obstructive pulmonary disease. The company was founded by Michael J. A. Walker and Clive P. Page on February 24, 2005 and is headquartered in London, the United Kingdom.
Predefined Scans Triggered: P&F Ascending Triple Top Breakout and P&F Double Top Breakout.
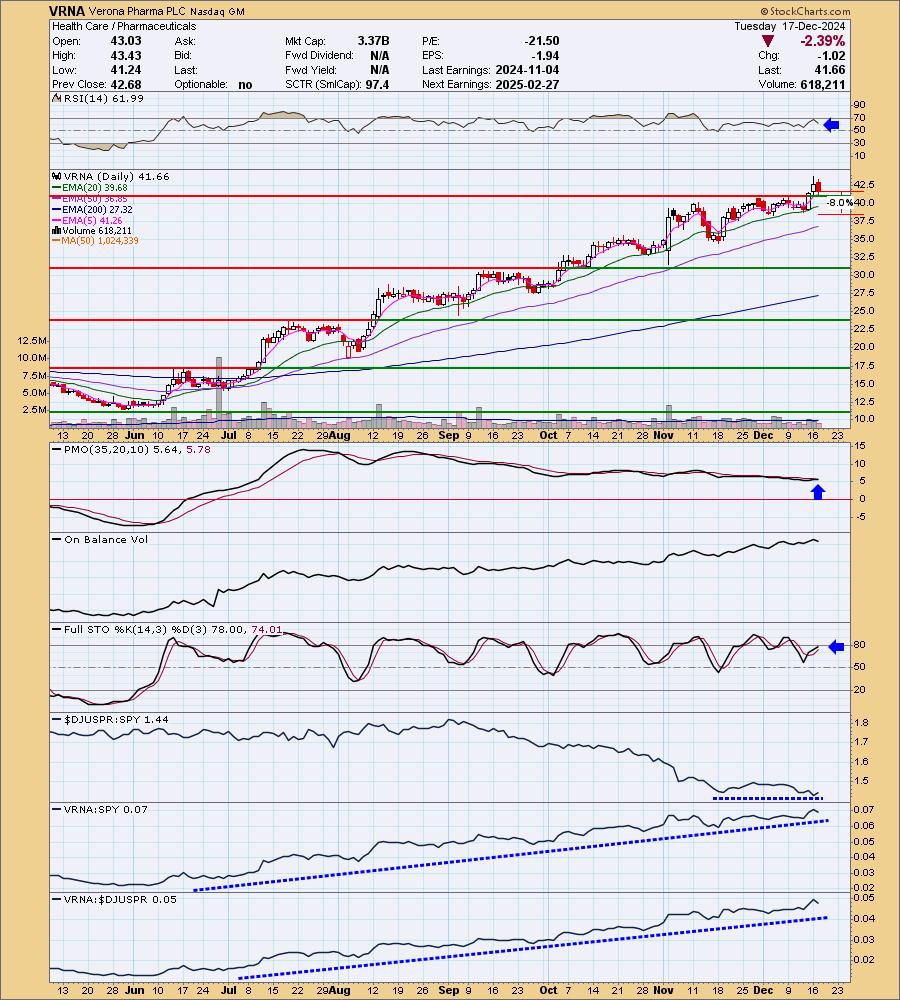
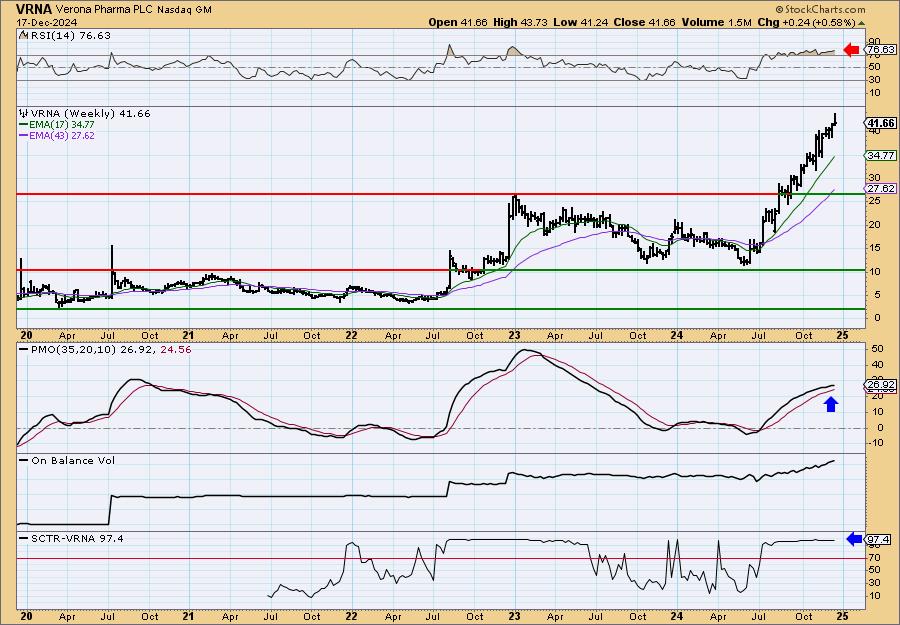
VRNA is unchanged in after hours trading. It had a bad day but I like that it pulled back after the breakout. It held new support as well. The RSI is not overbought. The PMO is flat above the zero line telling us there is pure strength in momentum. Stochastics are almost above 80 and have been oscillating in positive territory. The group isn't underperforming, but neither is it outperforming. VRNA however is outperforming both the group and sector. It has shown relative strength for quite some time. The stop is set between the 20/50-day EMAs at 8% or $38.32.
This is an excellent and steady rally. It isn't parabolic and looks like a winner that will keep on winning. It is overbought on the weekly RSI, but it has been for months. The weekly PMO is curling over slightly but that is due to the consistently rising trend which no longer is showing acceleration. The SCTR is at the top of the hot zone. Consider a 17% upside target to $48.74.
Whitestone REIT (WSR)
EARNINGS: 2025-03-05 (AMC)
Whitestone REIT is a community-centered real estate investment trust that acquires, owns, operates, and develops open-air, retail centers located in culturally diverse markets of major metropolitan areas. The company was founded on August 20, 1998 and is headquartered in Houston, TX.
Predefined Scans Triggered: New 52-week Highs, P&F Ascending Triple Top Breakout and P&F Double Top Breakout.
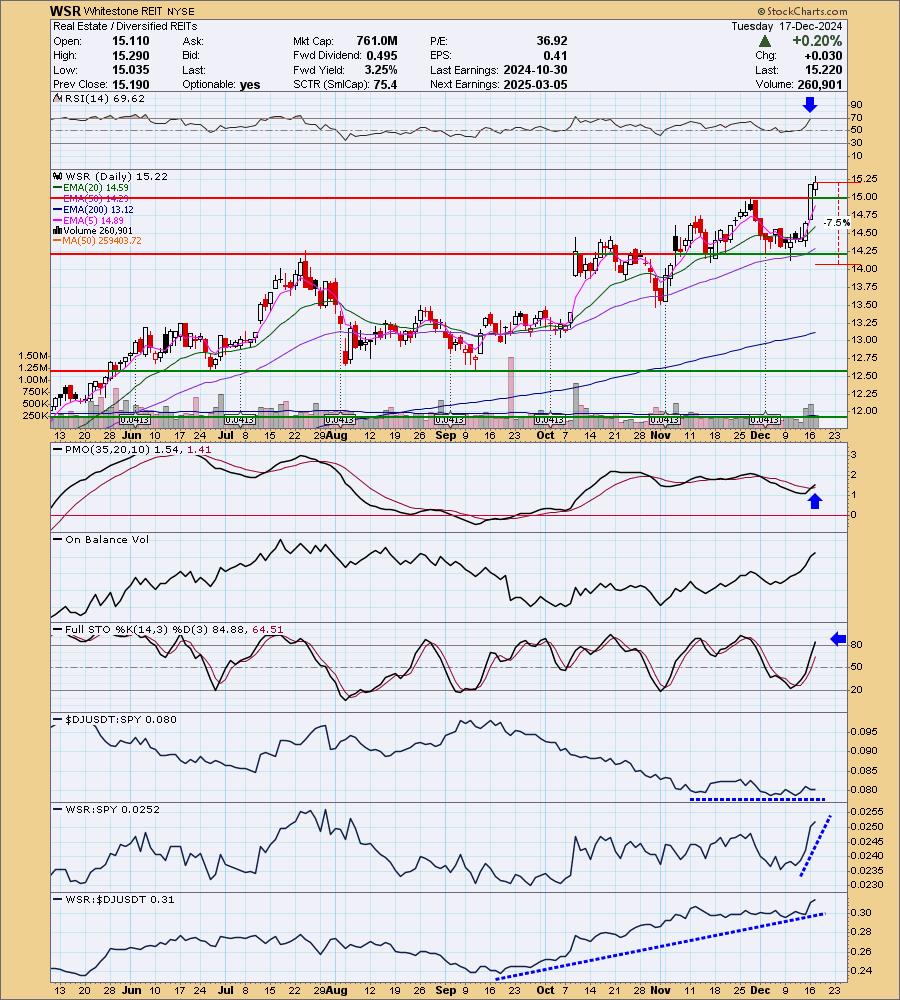
WSR is down -2.1% in after hours trading. Not sure why the big decline, but if it sticks it would offer a better entry. We have a breakout and another trading day that held above support. It has been a forceful rally so it may be due for a cooling off period. The RSI is not yet overbought. The PMO is on a new Crossover BUY Signal. Stochastics are above 80. The group could perform better, but given the outperformance of WSR against the SPY, I'll forgive it. WSR is showing leadership within the group and has for some time. The stop is set beneath support at 7.5% or $14.07.
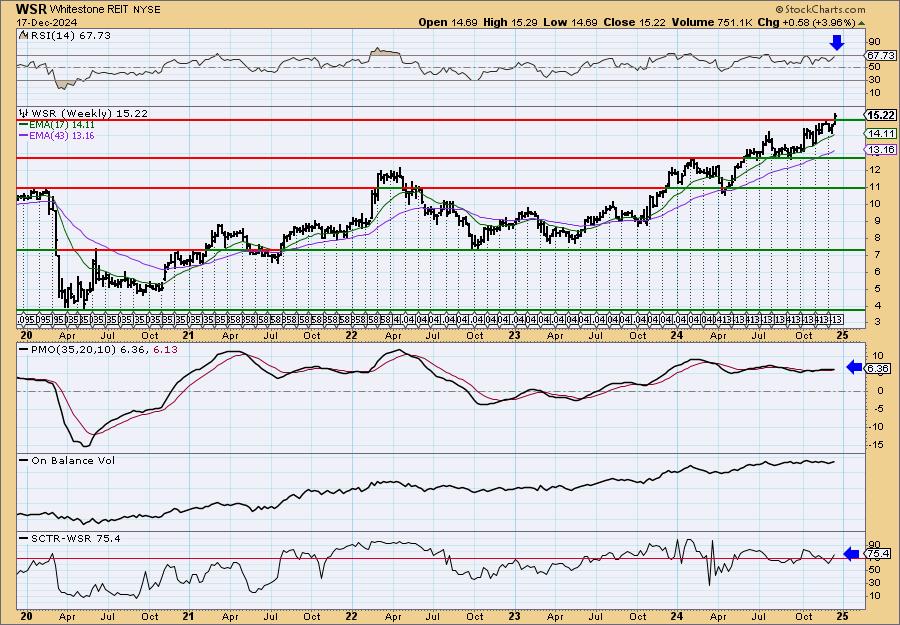
We have a breakout to new 52-week Highs and a steady rising trend. The weekly RSI is positive and not overbought. The weekly PMO is flat above the zero line indicating pure strength. It is also on a Crossover BUY Signal. The SCTR is in the hot zone. Consider a 17% upside target to about $17.81.
Don't forget, on Thursdays I look at reader-requested symbols, click HERE to send me an email. I read every email I receive and try to answer them all!
Current Market Outlook:
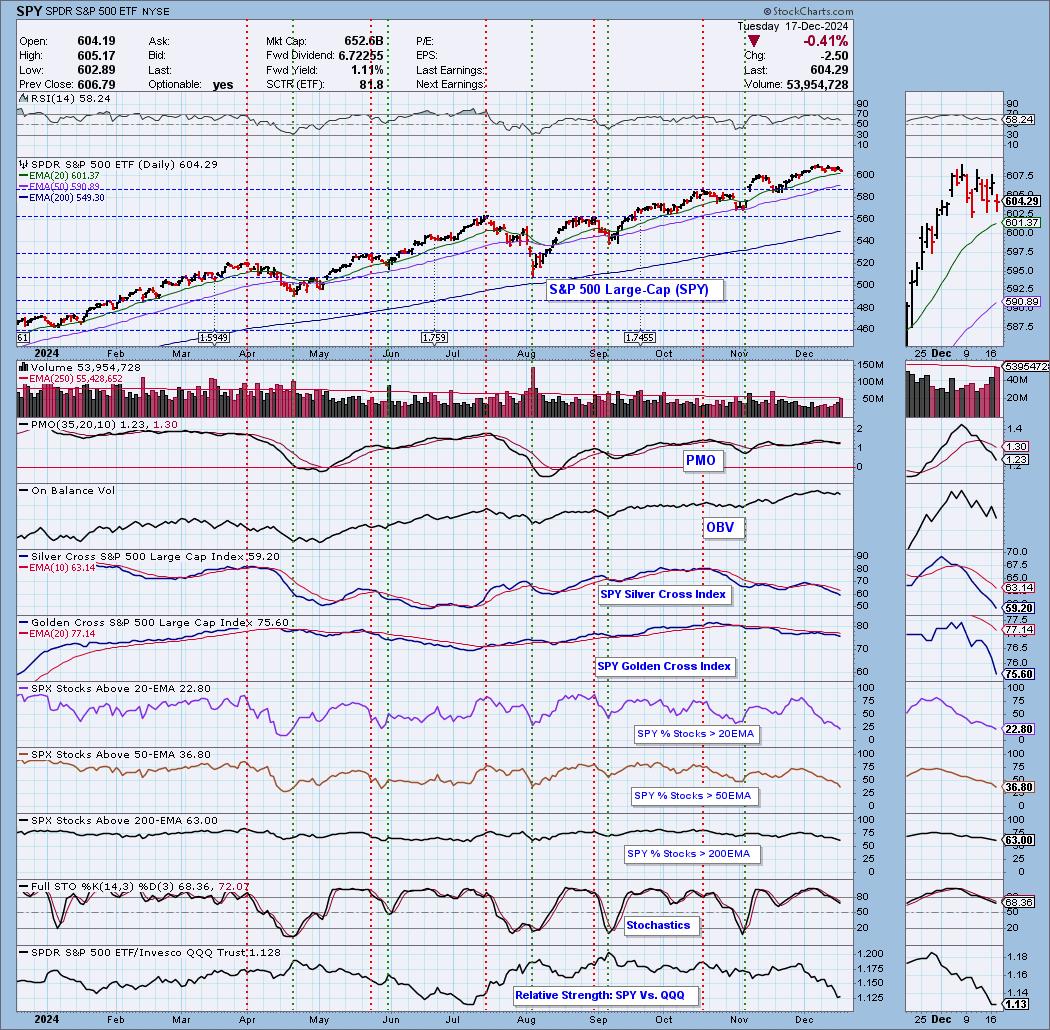
Market Environment: It is important to consider the odds for success by assessing the market tides. The following chart uses different methodologies for objectively showing the depth and trend of participation for intermediate- and long-term time frames.
- The Silver Cross Index (SCI) shows the percentage of SPX stocks on IT Trend Model BUY signals (20-EMA > 50-EMA)
- The Golden Cross Index (GCI) shows the percentage of SPX stocks on LT Trend Model BUY signals (50-EMA > 200-EMA)
Don't forget that as a "Diamonds" member, you have access to our "Under the Hood" curated ChartList on DecisionPoint.com. You'll find it under "Members Only" links on the left side on the Blogs and Links Page.
Here is the current chart:
Full Disclosure: I am 40% long, 0% short.
I'm required to disclose if I currently own a stock I mention and/or may buy/short it within the next 72 hours.
"Technical Analysis is a windsock, not a crystal ball." - Carl Swenlin
(c) Copyright 2024 DecisionPoint.com
Watch the latest episode of DecisionPoint Trading Room with Carl & Erin Swenlin Mondays on the DecisionPoint YouTube channel here!
NOTE: The stocks reported herein are from mechanical trading model scans that are based upon moving average relationships, momentum and volume. DecisionPoint analysis is then applied to get five selections from the scans. The selections given should prompt readers to do a chart review using their own analysis process. This letter is not a call for a specific action to buy, sell or short any of the stocks provided. There are NO sure things or guaranteed returns on the daily selection of "Diamonds in the Rough."
Regarding BUY/SELL Signals: The signal status reported herein is based upon mechanical trading model signals and crossovers. They define the implied bias of the price index/stock based upon moving average relationships and momentum, but they do not necessarily call for a specific action. They are information flags that should prompt chart review. Further, they do not call for continuous buying or selling during the life of the signal. For example, a BUY signal will probably (but not necessarily) return the best results if action is taken soon after the signal is generated. Additional opportunities for buying may be found as price zigzags higher, but the trader must look for optimum entry points. Conversely, exit points to preserve gains (or minimize losses) may be evident before the model mechanically closes the signal.
Helpful DecisionPoint Links:
Price Momentum Oscillator (PMO)
Swenlin Trading Oscillators (STO-B and STO-V)
For more links, go to DecisionPoint.com