
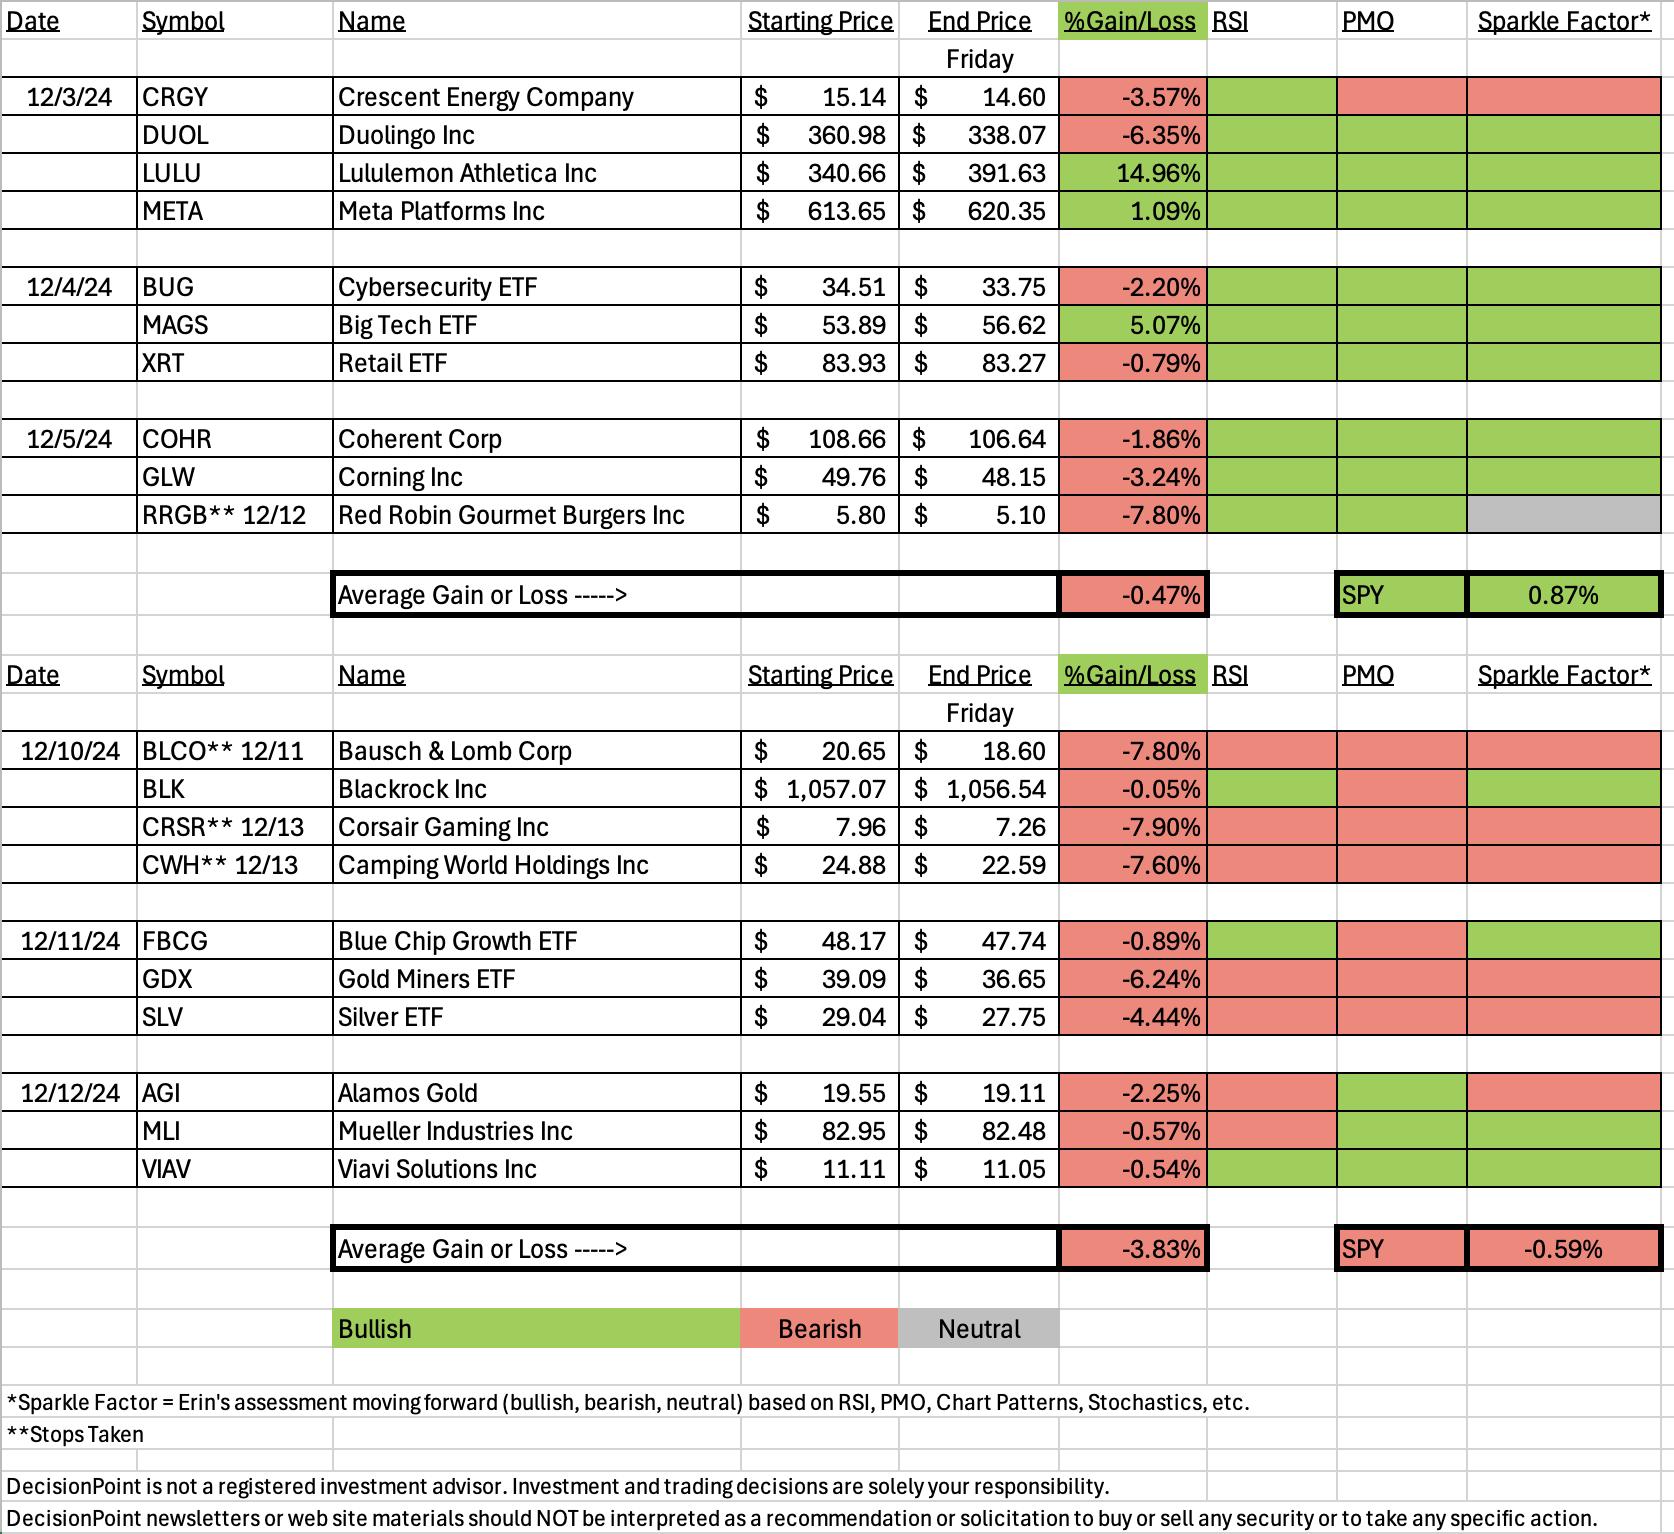
Well it was pretty obvious on the spreadsheet that the market was down four out of the last five trading days. The spreadsheet definitely suffered. We had three stops hit this week and one for the week before. This is why trading with the trend and condition of the market is important. We've also seen that mega-caps have been outperforming and even though scans did not return those, I will have to go out on my own occasionally to fit with the market trend and condition.
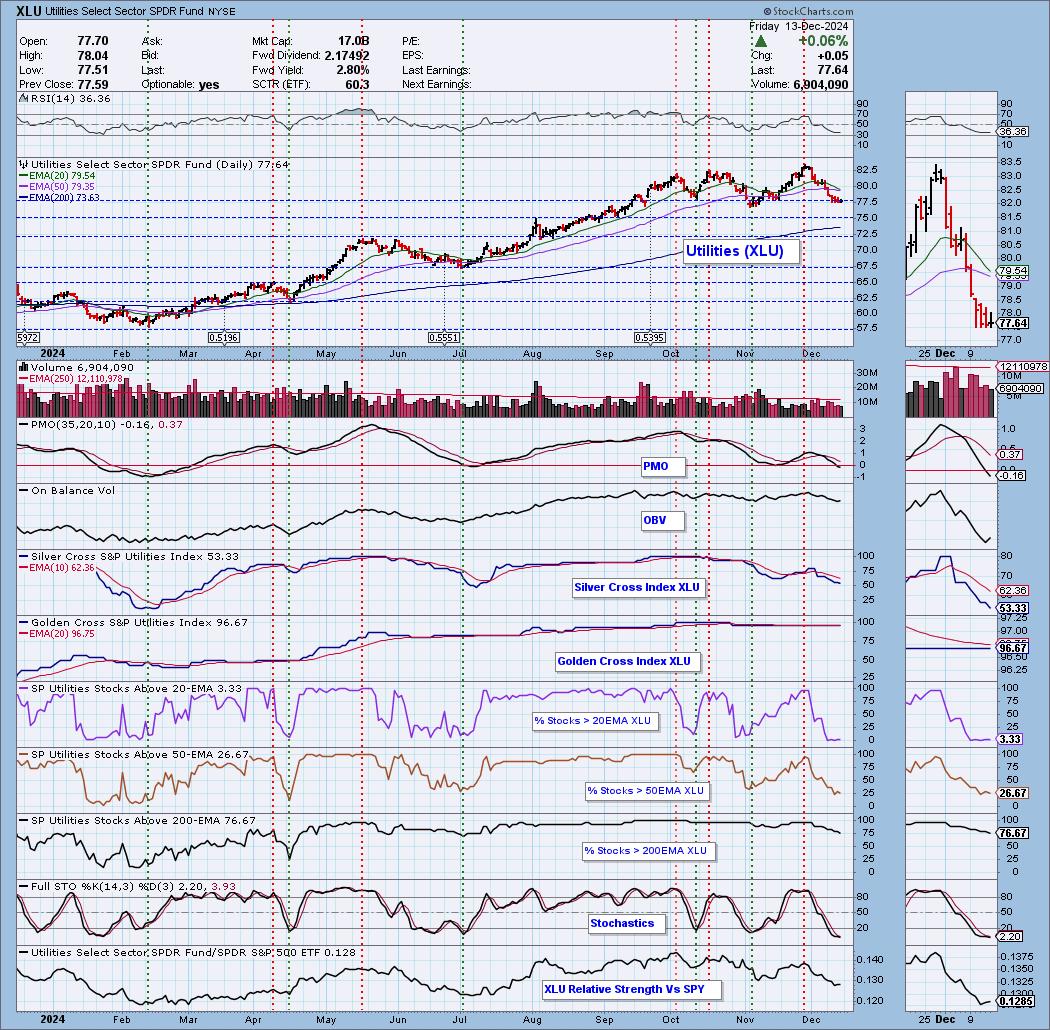
This week we did the Sector to Watch a little differently. Since there was no new momentum in any of the sectors and the majority had declining PMOs, we decided that this week we would pick a sector that is near support and could see an upside reversal. It is not necessarily a sector or industry group that you'll want to immediately dip into. It is a true "watch" to see if an opportunity presents itself. With that in mind we picked the Utilities (XLU) sector and the MultiUtilities Industry Group. There were a few symbols of interest in this group: RNW, SRE, PEG and CNP.
There were plenty of Duds to choose from this week, but ultimately the worst was Corsair Gaming (CRSR). The Darling this week would be Blackrock (BLK) which was only down -0.05% this week. The chart still looks constructive. We'll discuss later.
I did find a few symbols of interest at the end of the trading room today after running some scans. My confidence level is low, but they are worthy of a watch list if nothing else: CNC, ERIE, SLM and ROK.
I do feel the need to apologize for the picks this week, but I'm not surprised as I wasn't thrilled with my choices because the scans were so bare. As noted above, I think I'll try and go out on my own and drill down to find other choices if the scans don't impress. I will say that this is the first time ever that every pick was down for the week.
Have a great weekend and be sure to set those stops! I'm not expecting a deep decline as we still have favorable seasonality, but you never really know.
Good Luck & Good Trading,
Erin

Diamond Mine Trading Room:
RECORDING & DOWNLOAD LINK (12/13/2024):
Topic: DecisionPoint Diamond Mine (12/13/2024) LIVE Trading Room
Download & Recording Link
Passcode: December#13
REGISTRATION for 12/20/2024:
When: December 20, 2024 09:00 AM Pacific Time (US and Canada)
Topic: DecisionPoint Diamond Mine LIVE Trading Room
Register in advance for this webinar HERE
After registering, you will receive a confirmation email containing information about joining the webinar.

Below is the latest free DecisionPoint Trading Room recording from 12/9. You'll find these recordings posted on Mondays to our DP YouTube Channel. Be sure and subscribe HERE.
A few items about the spreadsheet: I've put on the spreadsheet whether the RSI is positive (green) or negative (red). The PMO column tells you if it is rising (green) or falling (red). Finally I've added my own "Sparkle Factor" that gives you my assessment going forward, bullish (green), bearish (red) or neutral (gray). The Sparkle Factor is basically my thoughts on whether I expect it to rise or fall. A neutral means it could really go either way so it could be added to a watch list. If you're in a stock I consider "neutral" going forward, the ball is in your court.
Darling:
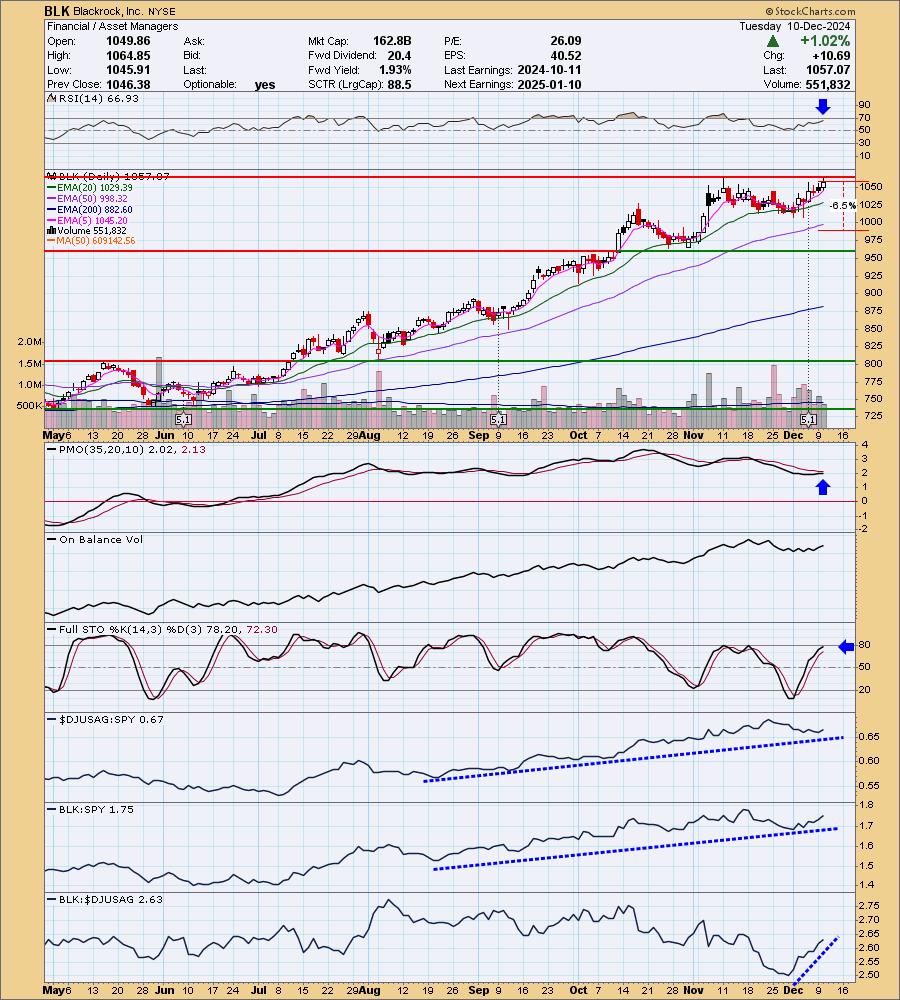
Blackrock, Inc. (BLK)
EARNINGS: 2025-01-10 (BMO)
Blackrock, Inc. engages in the provision of investment, advisory and risk management solutions. Its products include single-asset and multi-asset portfolios. The company was founded by Laurence Douglas Fink in 1988 and is headquartered in New York, NY.
Predefined Scans Triggered: Moved Above Upper Bollinger Band, Stocks in a New Uptrend (Aroon), P&F double Top Breakout and New 52-week Highs.
Below are the commentary and chart from Tuesday, 12/10:
"BLK is up +0.75% in after hours trading. I like the new rally out of the declining trend. The personality of this stock seems to be leg up, pullback/consolidate, leg up, pullback/consolidate. We're on the next leg up. I'm looking for a breakout. The RSI is positive and not overbought. The PMO is closing in on a Crossover BUY Signal. Stochastics are almost to 80. The group has essentially been outperforming for months. BLK has seen the same outperformance against the SPY. It is really starting to outperform its group of late. I've set the stop beneath the 50-day EMA at 6.5% or $988.36."
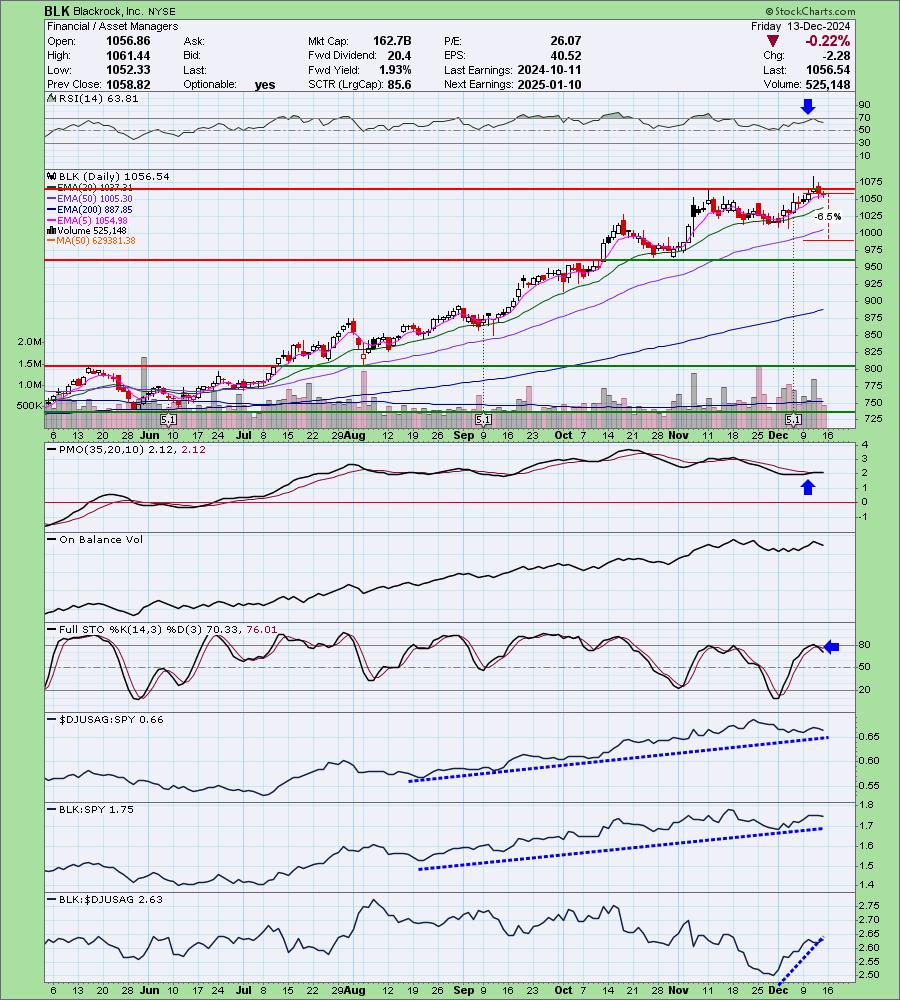
Here is today's chart:
It isn't the greatest chart, but we do still have a rising trend. Price did dip below prior resistance and the PMO has turned down. I think this one still has some merit. We could see a move off the 20-day EMA. I still this one as a possible buy minus the declining PMO. The chart hasn't completely broken down. However, there are likely better choices out there than this one.
Don't forget, on Thursdays I look at reader-requested symbols, so shoot me an email at erin@decisionpoint.com. I read every email I receive and try to answer them all!
Dud:
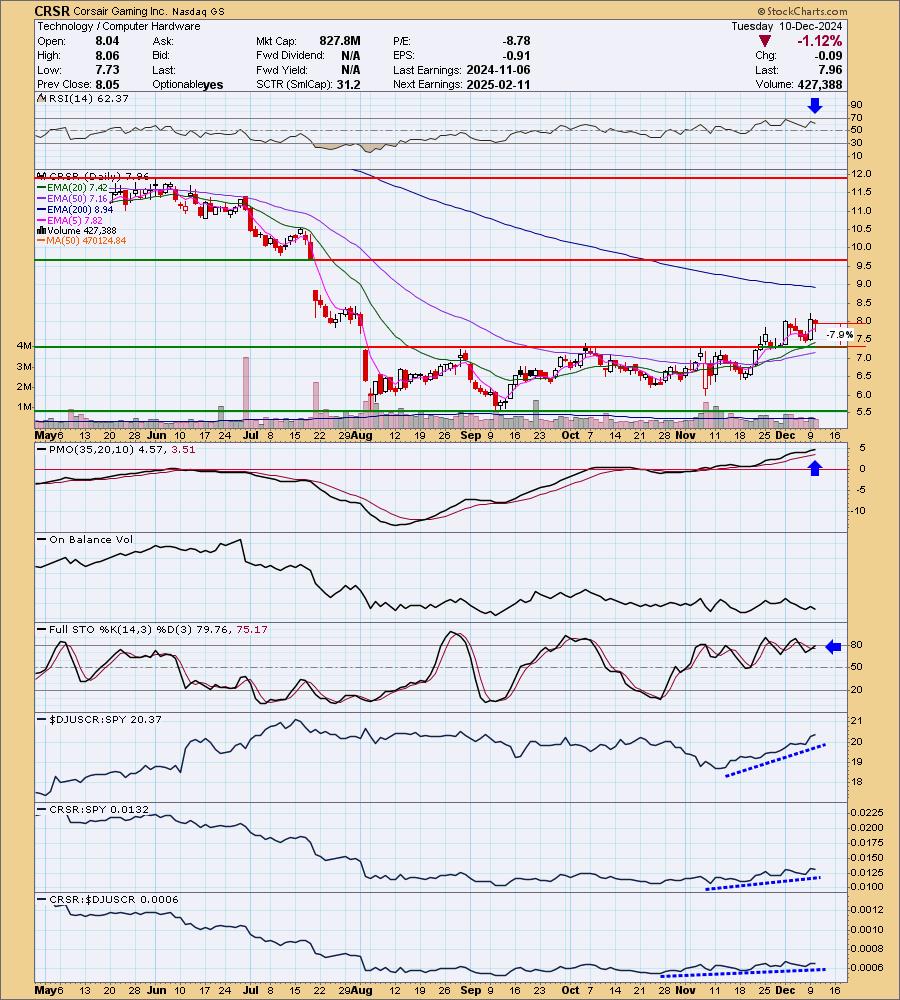
Corsair Gaming Inc. (CRSR)
EARNINGS: 2025-02-11 (AMC)
Corsair Gaming, Inc. designs and supplies hardware components for personal computers. It operates through the Gamer and Creator Peripherals, and Gaming Components and Systems segments. The Gamer and Creator Peripherals segment offers gaming keyboards, mice, headsets, controllers, and gaming gear including capture cards, Stream Decks, USB microphones, studio accessories, and EpocCam software, as well as coaching and training services. The Gaming Components and Systems segment focuses on creating power supply units, or PSUs, cooling solutions, computer cases, DRAM modules, prebuilt, and custom-built gaming PCs. The company was founded by Andrew J. Paul in 1994 and is headquartered in Milpitas, CA.
Predefined Scans Triggered: Elder Bar Turned Blue.
Below are the commentary and chart from Tuesday, 12/10:
"CRSR is down -0.48% in after hours trading. This is a "boom or bust" reversal candidate. That carries extra risk as it could do very well or it could fall apart. I like the breakout from the prior trading range. The RSI is not overbought and the PMO is rising on a Crossover BUY Signal. The PMO is well above the zero line as well. Stochastics are oscillating around 80. The industry group is performing very well against the SPY. CRSR is outperforming its industry group slightly, but most importantly it is outperforming the SPY.The stop is set on the trading range at 7.9% or $7.33."
Here is today's chart:
This was a possible reversal candidate and unfortunately it reversed in the wrong direction. Price was well below the 200-day EMA and that could have been part of the problem, but price was above the 20/50-day EMAs when picked. This one just lost important support. The PMO has topped and is headed for a Crossover SELL Signal. Stochastics are diving lower. This might be a possible short candidate.

THIS WEEK's Performance:
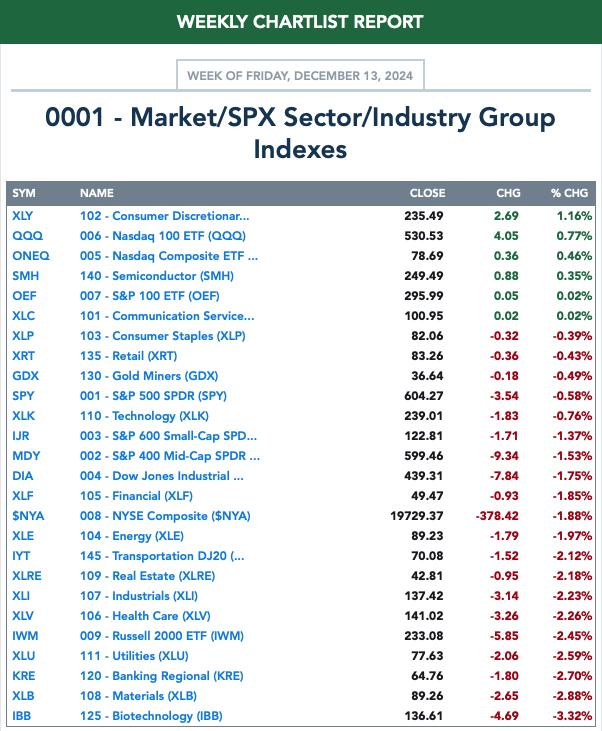
DecisionPoint Market Scoreboard (Mechanical Trend Model Signals):
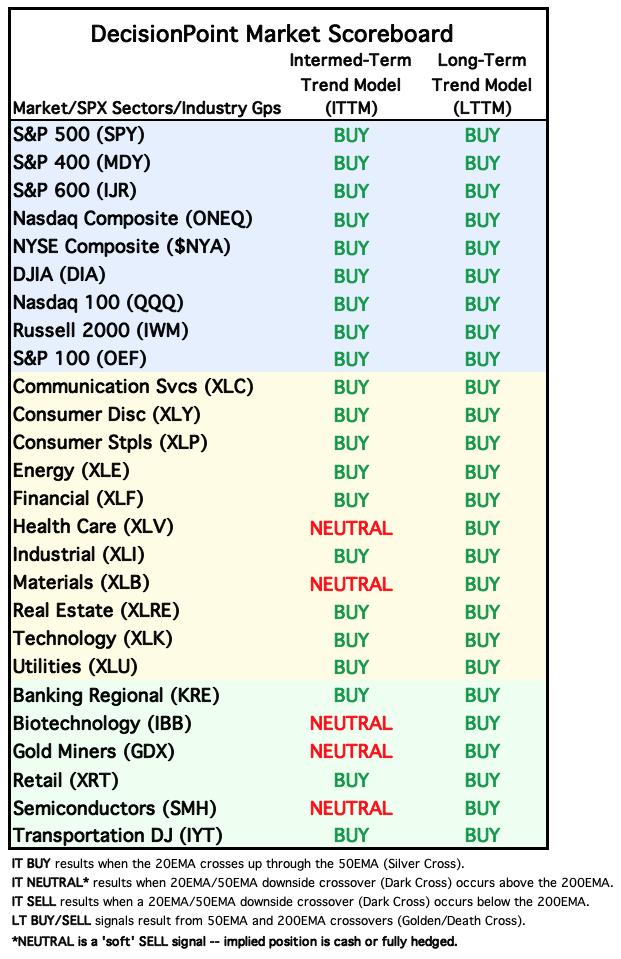
Friday signal changes are outlined in purple.
Click Here to view Carl's annotated "Under the Hood" ChartList!
Sector to Watch: Utilities (XLU)
This one really will be interesting to watch. It is seated on strong support right now at the bottom of a newly formed trading range. The chart is far from ripe. Participation is paltry and both the Silver and Golden Cross Indexes are below their signal lines. We really do need to see some participation come in or it will be very difficult for XLU to reverse here.
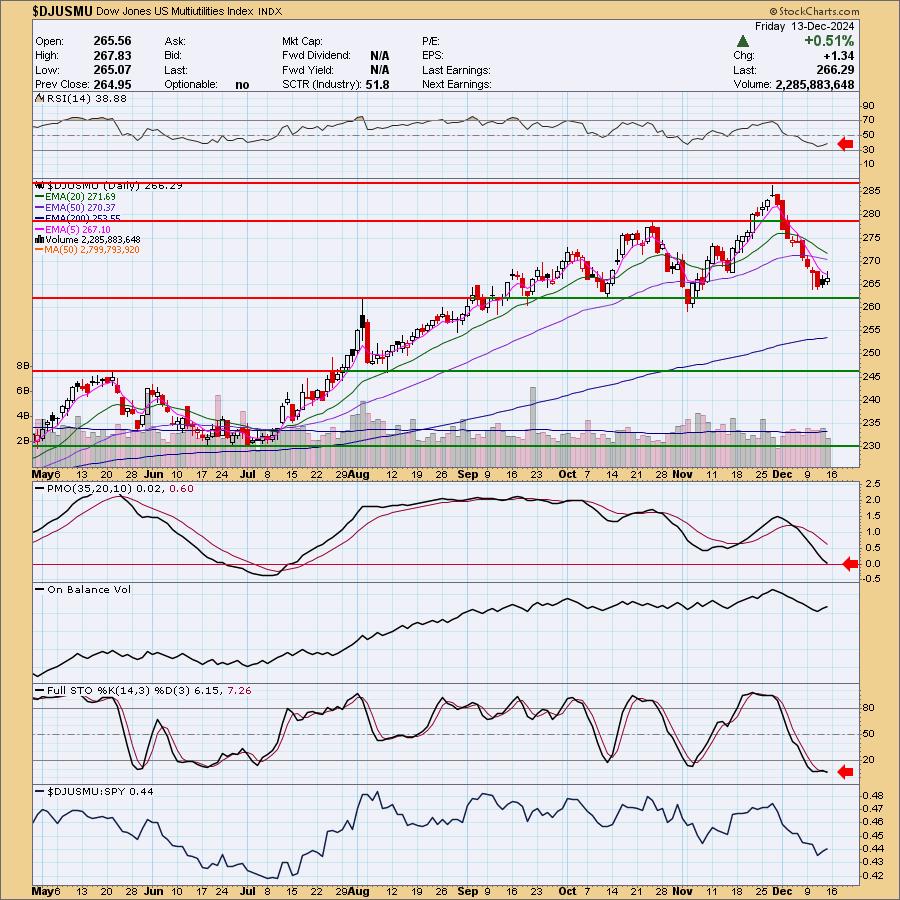
Industry Group to Watch: Multiutilities ($DJUSMU)
This a group that is certainly not healthy right now based on the indicators, but it is starting to reverse above support and that is bullish. We will want to explore a few stocks in this group which do have bullish characteristics: RNW, SRE, PEG and CNP.
Go to our Under the Hood ChartList on DecisionPoint.com to get an in-depth view of all the sectors. On StockCharts.com you can find the Industry Summary.
Good Luck & Good Trading!
- Erin
erin@decisionpoint.com
Full Disclosure: I'm 45% long, 0% short.
Watch the latest episode of the DecisionPoint Trading Room with Carl & Erin Swenlin HERE!
Technical Analysis is a windsock, not a crystal ball. --Carl Swenlin
NOTE: The stocks reported herein are from mechanical trading model scans that are based upon moving average relationships, momentum and volume. DecisionPoint analysis is then applied to get selections from the scans. The selections given should prompt readers to do a chart review using their own analysis process. This letter is not a call for a specific action to buy, sell or short any of the stocks provided. There are NO sure things or guaranteed returns on the selection of "diamonds in the rough."
Helpful DecisionPoint Links:
DecisionPoint Shared ChartList and DecisionPoint Chart Gallery
Price Momentum Oscillator (PMO)
Swenlin Trading Oscillators (STO-B and STO-V)
(c) Copyright 2024 DecisionPoint.com