
The Diamond Scans came in rather light today, but I was able to find four selections within. We have two flag formations that look interesting and I have a few familiar names today.
META is the most well-known of the symbols today. The other two I've presented somewhat recently I believe. The charts are looking good once again and are worth a look (DUOL and LULU). The fourth selection is from Energy which I hesitated to present, but the sector has pulled back and could be ready to resume its run higher. This stock does look very good (CRGY).
Scan Alert System subscribers, you may see some symbols as runner-ups today that didn't come in today's email. I ran a more open scan that I turn to when my primary scans don't produce as I'd like. There were quite a few results but as usual they weren't that interesting. Yet, I did find a few runner-ups there that are worth a look.
Good Luck & Good Trading,
Erin
Today's "Diamonds in the Rough": CRGY, DUOL, LULU and META.
Runner-ups: NRG, SPNT, AXSM, BURL and AMZN.

Diamond Mine Trading Room:
RECORDING & DOWNLOAD LINK (11/22/2024- No Recording on 11/29):
Topic: DecisionPoint Diamond Mine (11/22/2024) LIVE Trading Room
Recording & Download Link
Passcode: November#22
REGISTRATION for 12/6/2024:
When: December 6, 2024 09:00 AM Pacific Time (US and Canada)
Topic: DecisionPoint Diamond Mine LIVE Trading Room
Register in advance for this webinar HERE
After registering, you will receive a confirmation email containing information about joining the webinar.

Below is the latest free DecisionPoint Trading Room recording from 12/2. You'll find these recordings posted on Mondays to our DP YouTube Channel. Be sure and subscribe HERE.
Welcome to DecisionPoint Diamonds, wherein I highlight ten "Diamonds in the Rough" per week. These are selected from the results of my DecisionPoint Scans which search for stocks that could benefit from the trend and condition of the market. Remember, these are not recommendations to buy or sell, but are the most interesting of the stocks that surfaced in my scans. My objective is to save you the work of the initial, tedious culling process, but you need to apply your own analysis to see if these stocks pique your interest as well. There are no guaranteed winners here!
"Predefined Scans Triggered" are taken from StockCharts.com using the "Symbol Summary" option instead of a "SharpChart" on the workbench.
Stop levels are all rounded down.
Crescent Energy Company (CRGY)
EARNINGS: 2025-03-03 (AMC)
Crescent is a differentiated U.S. energy company committed to delivering value through a disciplined, returns-driven growth through acquisition strategy and consistent return of capital. The company's long-life, balanced portfolio combines stable cash flows from low decline production with a deep, high-quality development inventory. Its activities are focused in Texas and the Rocky Mountain region. Crescent Energy is headquartered in Houston, TX.
Predefined Scans Triggered: P&F Double Top Breakout.
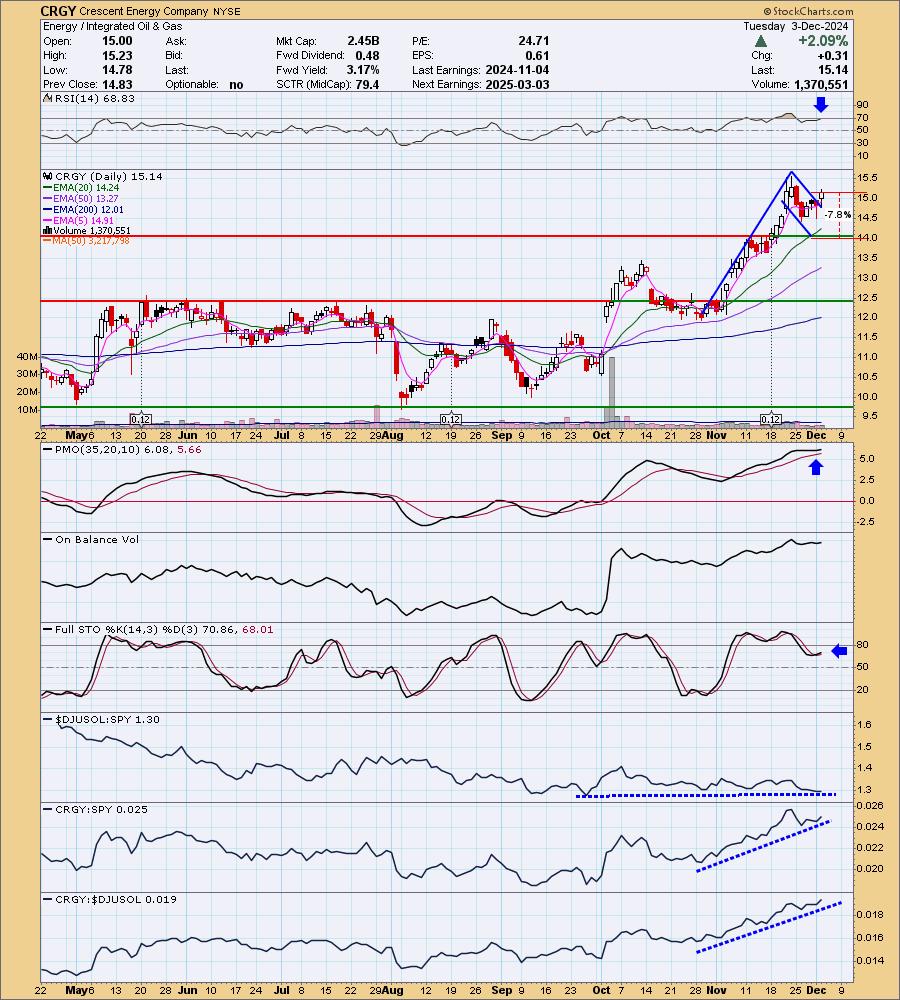
CRGY is down -3.63% in after hours trading. We'll see if that decline holds up tomorrow. I liked this chart primarily due to the bull flag that was confirmed on today's breakout. The PMO is at a very high reading well above the zero line. It had a surge or a bottom above the signal line. The RSI is not yet overbought. Stochastics have turned up in positive territory. The group isn't outperforming right now, but it is in line with the SPY and that is acceptable. CRGY has shown leadership within the group and is outperforming the SPY. I've set the stop beneath support at 7.8% or $13.95.
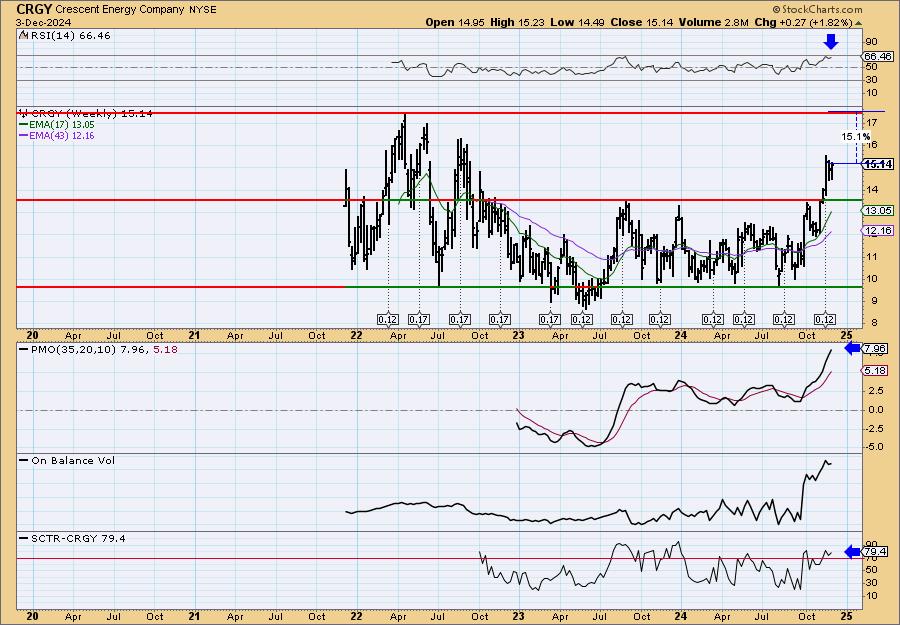
I very much like the breakout from the long-term trading range. Price is headed higher and the indicators are very positive. The weekly RSI is not overbought and the weekly PMO is rising strongly. We also see that the StockCharts Technical Rank (SCTR) is in the hot zone* above 70. This could be an intermediate-term investment.
*If a stock is in the "hot zone" above 70, it implies that it is stronger than 70% of its universe (large-, mid-, small-caps and ETFs) primarily in the intermediate to long terms.
Duolingo Inc. (DUOL)
EARNINGS: 2025-02-26 (AMC)
Duolingo, Inc. is a language-learning website and mobile application, which engages in the development of a free language learning website and crowd sourced text translation platform. It offers Duolingo for Schools, a free, web-based tool that aims to make it easier for teachers to use the Duolingo platform in a structured learning environment, and English Test, an online, on-demand assessment of English proficiency. The company was founded by Luis von Ahn and Severin Hacker in 2011 and is headquartered in Pittsburgh, PA.
Predefined Scans Triggered: Elder Bar Turned Green and Moved Above Upper Keltner Channel.
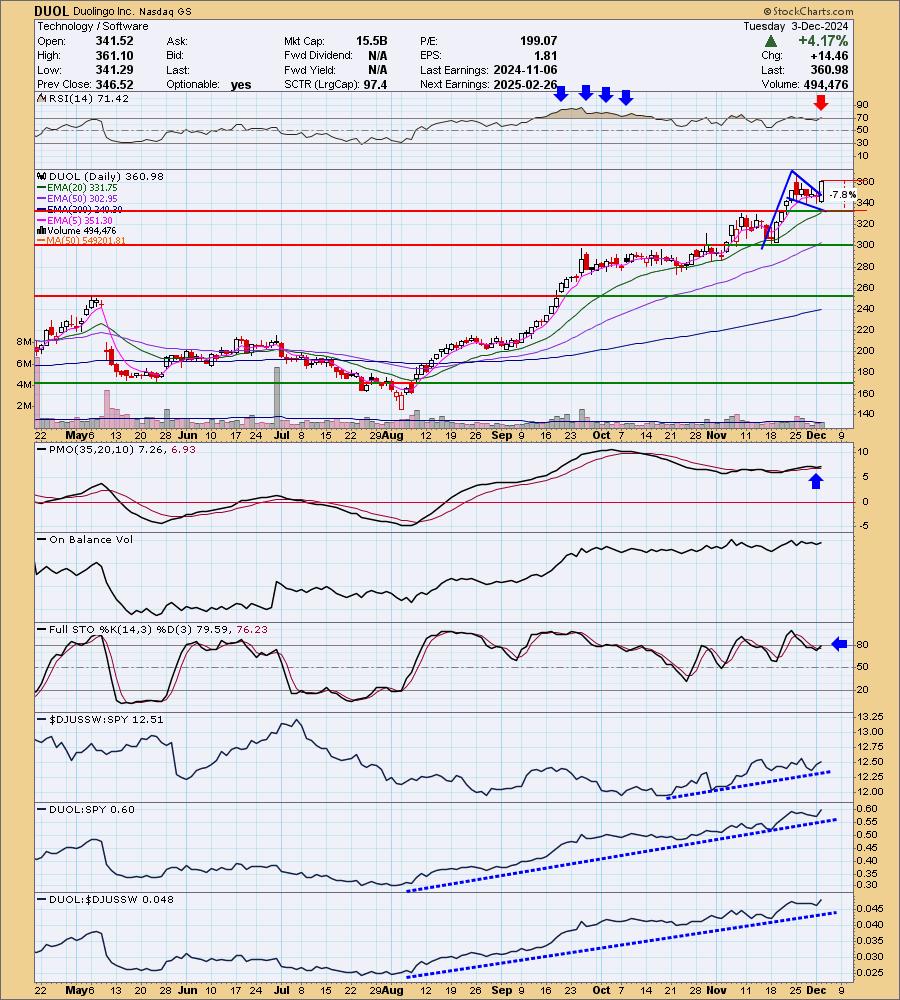
DUOL is up +0.27% in after hours trading. Here we have another bull flag that has been confirmed on a breakout. We also have a bullish engulfing candlestick. The RSI is overbought now, but I've highlighted how this stock can hold overbought conditions for weeks at a time. The PMO has surged above the signal line and Stochastics have turned up. Relative strength is excellent across the board as every relative strength line has been rising. DUOL has been outperforming since the August low. The stop is set as close to support as possible at 7.8% or $332.82.
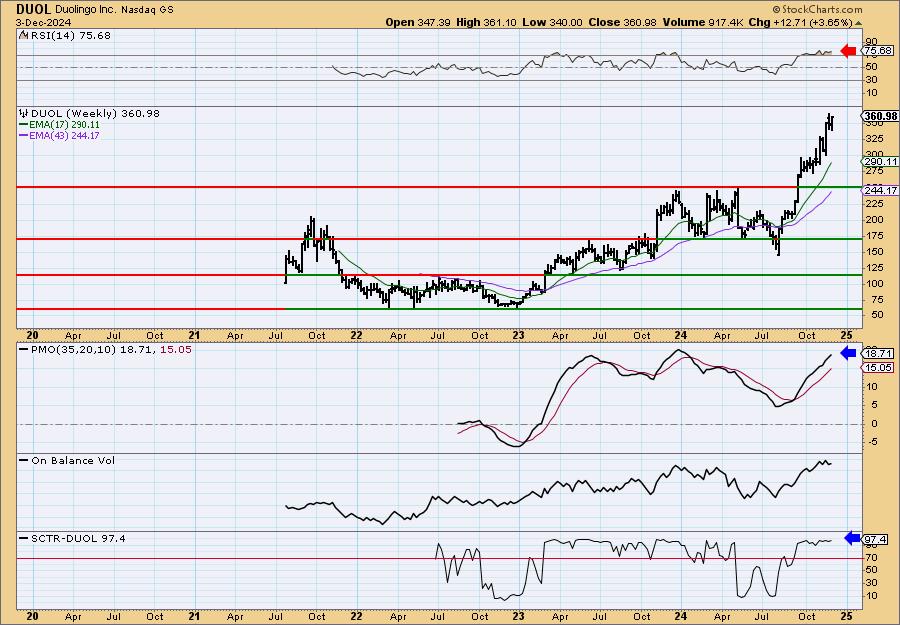
The weekly chart is very bullish as price just continues to soar higher. The rising trend is a bit vertical so we could see some kind of pullback to consolidate the move and soften the acute rising trend. The weekly RSI is overbought so we should be alert. The weekly PMO is rising strongly and the SCTR is in the hot zone. Consider a 17% upside target to about $422.35.
Lululemon Athletica Inc. (LULU)
EARNINGS: 2024-12-05 (AMC)
Lululemon athletica, Inc. engages in the business of designing, distributing, and retailing technical athletic apparel, footwear, and accessories. It operates through the following segments: Company-Operated Stores, Direct to Consumer, and Other. The company was founded by Dennis James Wilson in 1998 and is headquartered in Vancouver, Canada.
Predefined Scans Triggered: Moved Above Upper Price Channel, P&F Ascending Triple Top Breakout, P&F Double Top Breakout and Moved Above Upper Keltner Channel.
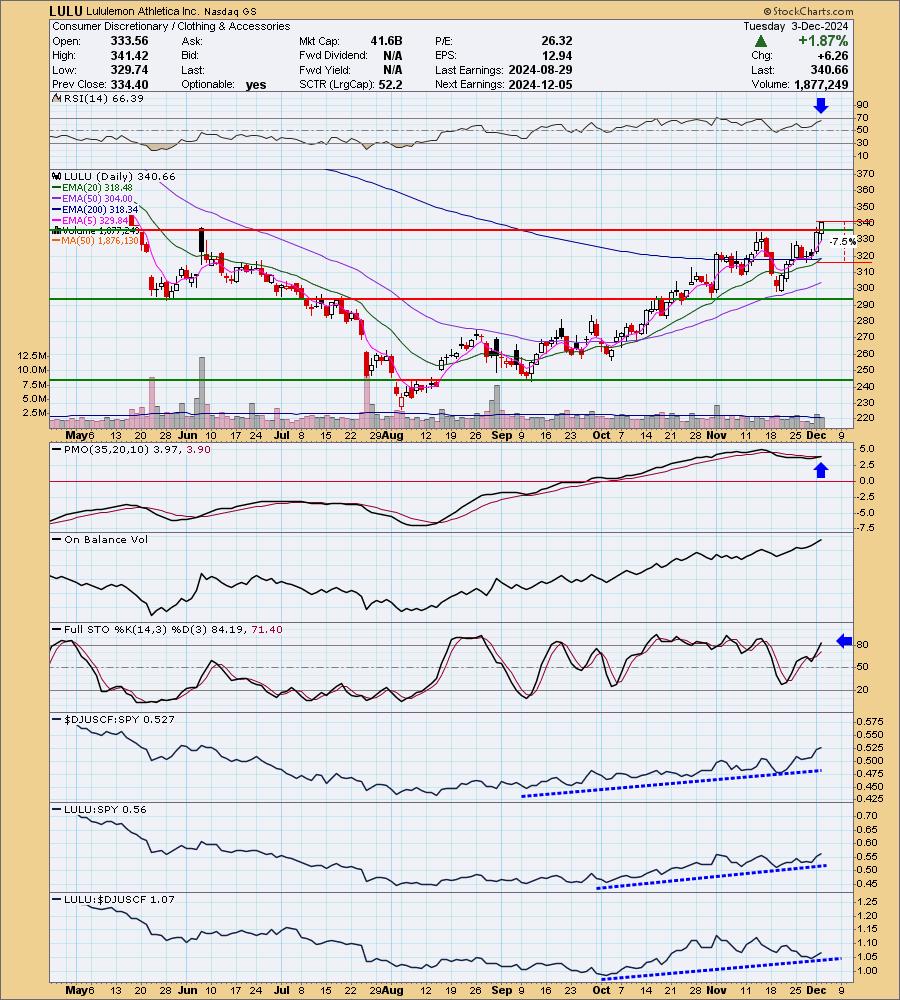
LULU is down -0.03% in after hours trading. Today's breakout was the primary reason I picked this one. It is rising out of a bullish rounded bottom basing pattern. The RSI is positive and not overbought. The PMO has just triggered a Crossover BUY Signal. Stochastics are rising above 80. The group is performing very well and I'm a fan of Retail right now. LULU has been quietly outperforming the SPY since September. It of late has been seeing some underperformance against the group but in the longer-term timeframe it is still seeing a rising trend. The stop is set below the 200-day EMA at 7.5% or $315.11.
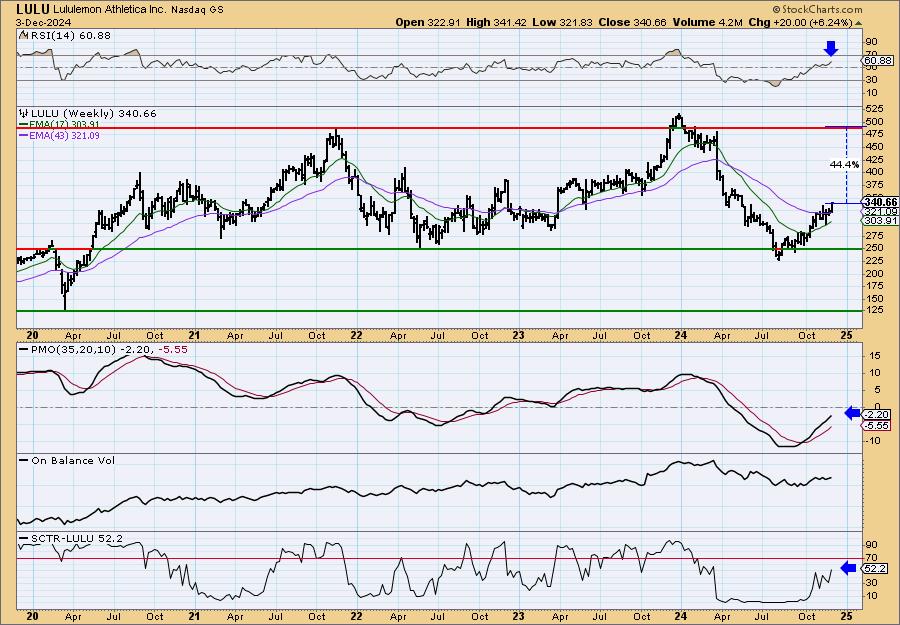
There is plenty of upside potential here if it can get back to the top of its long-term trading range. The weekly RSI is positive and the weekly PMO is rising toward the zero line. The SCTR is not in the hot zone presently but it is headed in that direction.
Meta Platforms, Inc. (META)
EARNINGS: 2025-02-06 (AMC)
Meta Platforms, Inc. engages in the development of social media applications. It builds technology that helps people connect and share, find communities, and grow businesses. It operates through the Family of Apps (FoA) and Reality Labs (RL) segments. The FoA segment consists of Facebook, Instagram, Messenger, WhatsApp, and other services. The RL segment includes augmented, mixed and virtual reality related consumer hardware, software, and content. The company was founded by Mark Elliot Zuckerberg, Dustin Moskovitz, Chris R. Hughes, Andrew McCollum, and Eduardo P. Saverin on February 4, 2004, and is headquartered in Menlo Park, CA.
Predefined Scans Triggered: Improving Chaikin Money Flow, Moved Above Upper Keltner Channel, New 52-week Highs, P&F Spread Triple Top Breakout, Moved Above Upper Bollinger Band, Moved Above Upper Price Channel and P&F Double Top Breakout.
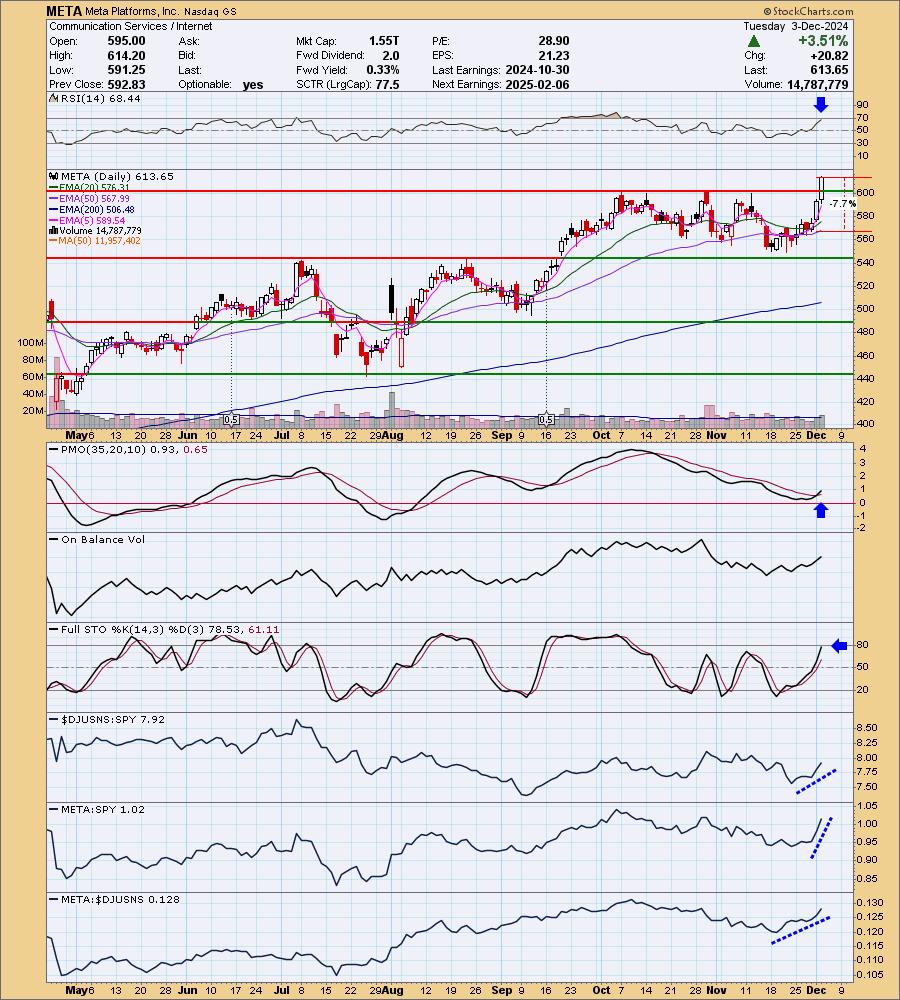
META is up +0.52% in after hours trading. Today saw a very nice breakout from a trading range that basically consolidated the September rally. The RSI is positive and not yet overbought. Even if it gets overbought, we can see that it can hold those conditions for quite awhile based on September. The PMO is on a new Crossover BUY Signal. Stochastics are rising strongly and are nearly above 80. Relative strength is improving for the group and we can see that META is beginning to outperform the group and consequently the SPY. The Communication Services (XLC) sector looks very bullish as well. The stop is set beneath the 50-day EMA at 7.7% or $566.39.
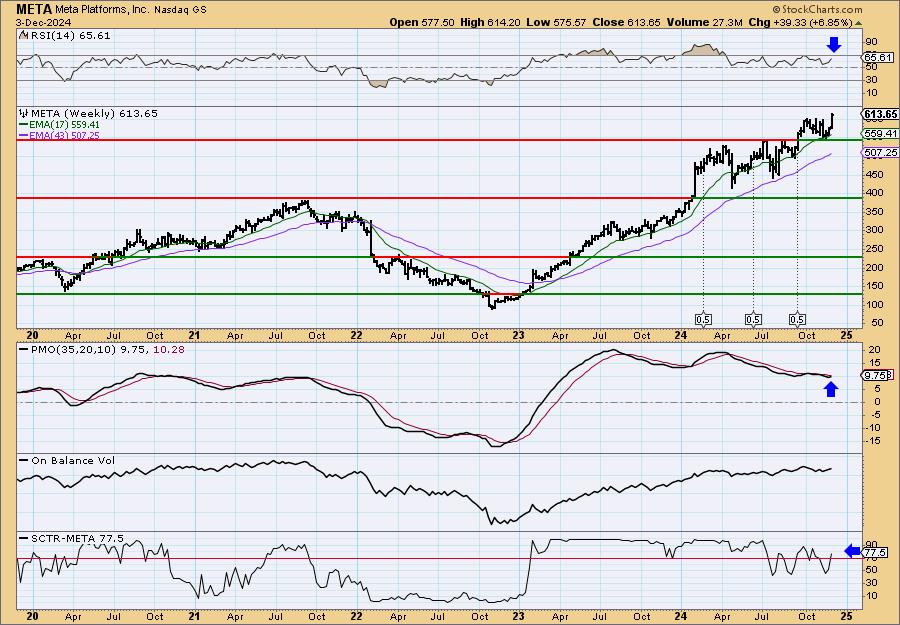
The weekly chart shows a steady rising trend not a parabolic move so this trend can be sustained longer. The weekly RSI is positive and not overbought. The weekly PMO has turned up and the SCTR is in the hot zone. Consider a 17% upside target to about $717.97.
Don't forget, on Thursdays I look at reader-requested symbols, click HERE to send me an email. I read every email I receive and try to answer them all!
Current Market Outlook:
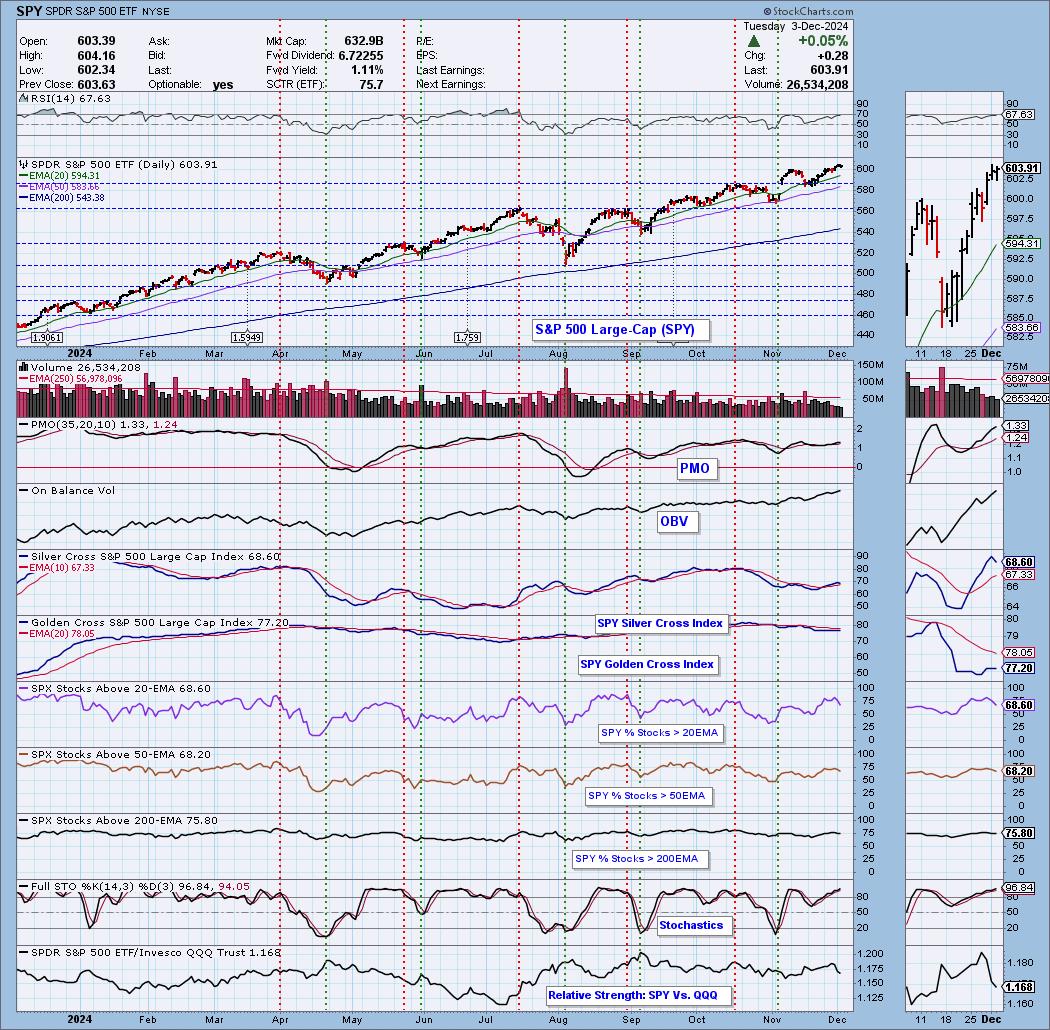
Market Environment: It is important to consider the odds for success by assessing the market tides. The following chart uses different methodologies for objectively showing the depth and trend of participation for intermediate- and long-term time frames.
- The Silver Cross Index (SCI) shows the percentage of SPX stocks on IT Trend Model BUY signals (20-EMA > 50-EMA)
- The Golden Cross Index (GCI) shows the percentage of SPX stocks on LT Trend Model BUY signals (50-EMA > 200-EMA)
Don't forget that as a "Diamonds" member, you have access to our "Under the Hood" curated ChartList on DecisionPoint.com. You'll find it under "Members Only" links on the left side on the Blogs and Links Page.
Here is the current chart:
Full Disclosure: I am 60% long, 0% short.
I'm required to disclose if I currently own a stock I mention and/or may buy/short it within the next 72 hours.
"Technical Analysis is a windsock, not a crystal ball." - Carl Swenlin
(c) Copyright 2024 DecisionPoint.com
Watch the latest episode of DecisionPoint Trading Room with Carl & Erin Swenlin Mondays on the DecisionPoint YouTube channel here!
NOTE: The stocks reported herein are from mechanical trading model scans that are based upon moving average relationships, momentum and volume. DecisionPoint analysis is then applied to get five selections from the scans. The selections given should prompt readers to do a chart review using their own analysis process. This letter is not a call for a specific action to buy, sell or short any of the stocks provided. There are NO sure things or guaranteed returns on the daily selection of "Diamonds in the Rough."
Regarding BUY/SELL Signals: The signal status reported herein is based upon mechanical trading model signals and crossovers. They define the implied bias of the price index/stock based upon moving average relationships and momentum, but they do not necessarily call for a specific action. They are information flags that should prompt chart review. Further, they do not call for continuous buying or selling during the life of the signal. For example, a BUY signal will probably (but not necessarily) return the best results if action is taken soon after the signal is generated. Additional opportunities for buying may be found as price zigzags higher, but the trader must look for optimum entry points. Conversely, exit points to preserve gains (or minimize losses) may be evident before the model mechanically closes the signal.
Helpful DecisionPoint Links:
Price Momentum Oscillator (PMO)
Swenlin Trading Oscillators (STO-B and STO-V)
For more links, go to DecisionPoint.com