
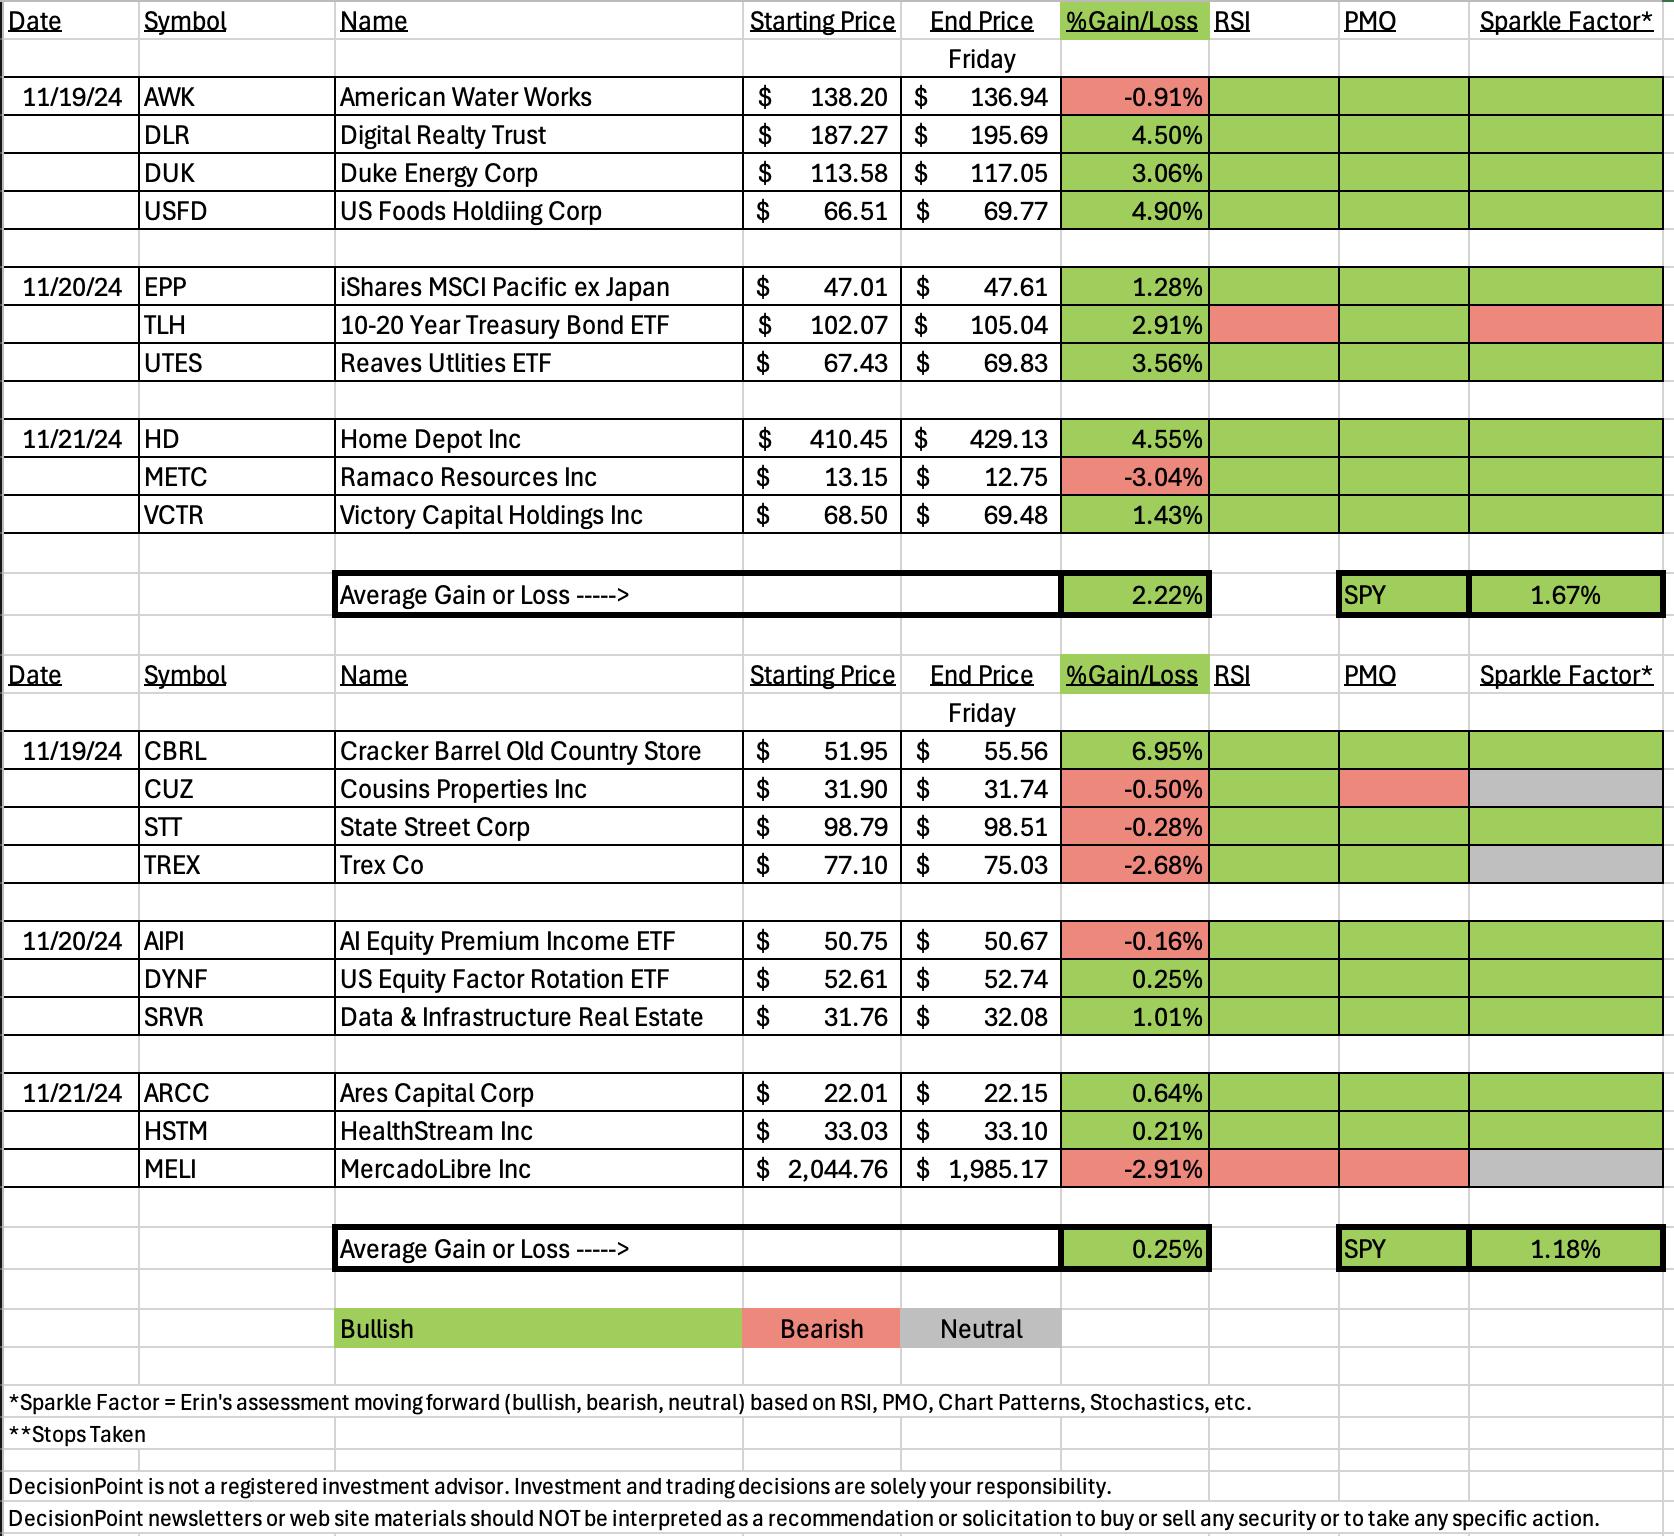
Ultimately "Diamonds in the Rough" were higher on this shortened week. The SPY finished higher by +1.18% while "Diamonds in the Rough" only averaged +0.25% higher. I'll be brief so we can all get back to our holiday weekend!
The Darling this week was Cracker Barrel (CBRL) which was up almost 7% for the week! I really liked that chart and wish I'd taken advantage, but I already had a Restaurant and Bars stock and felt that I should stay diversified.
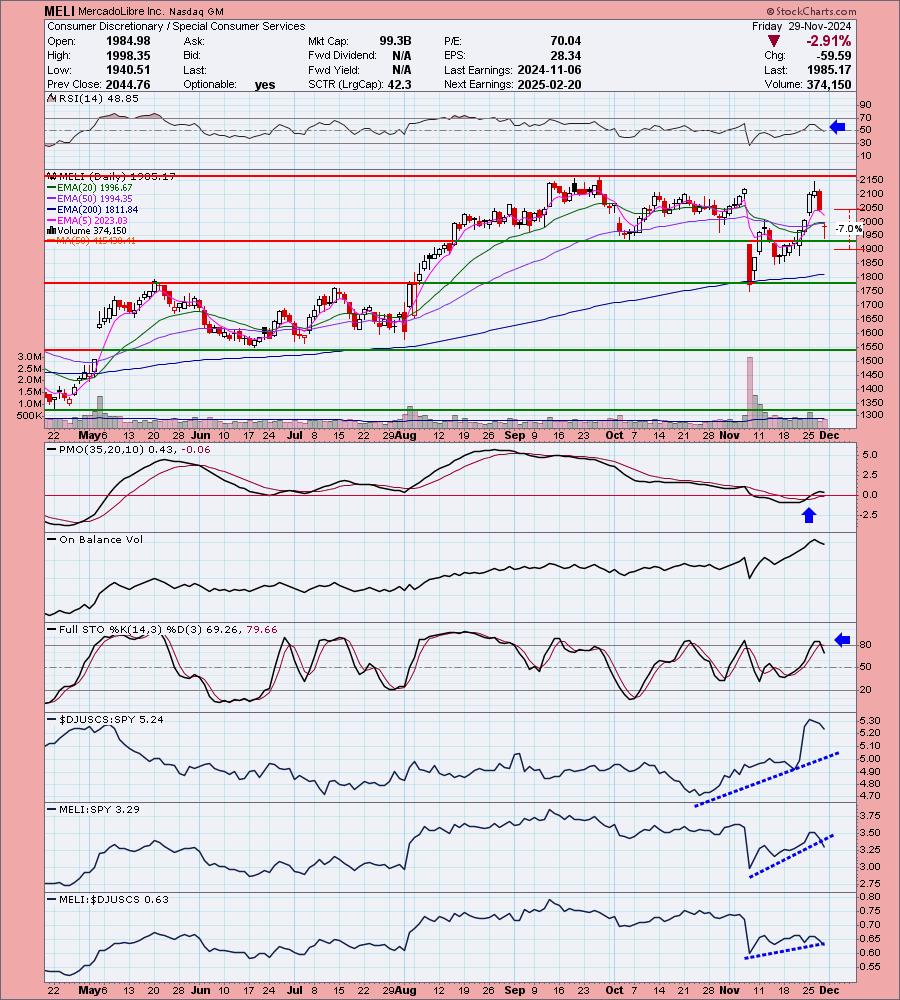
The Dud was a Reader Request from Wednesday that was down -2.91%. The chart isn't going off the rails at this point so I did give it a "Neutral" Sparkle Factor. (Remember the Sparkle Factor on the spreadsheet lets you know if I think the position is still bullish or is bearish or is probably a neutral/hold.)
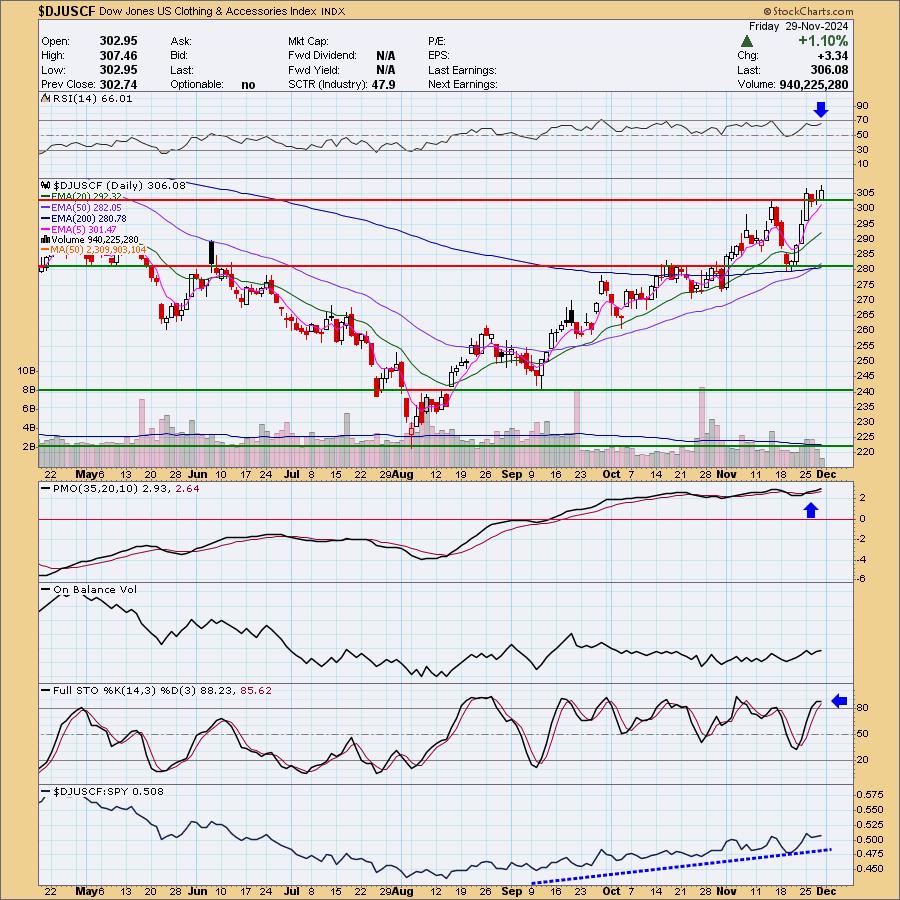
Since we didn't do the Diamond Mine trading room this week, I got to pick the Sector to Watch without input as well as the Industry Group to Watch. It was a toss up for me today so I decided to go with a shopping theme based on upcoming holidays. The Sector to Watch will be Consumer Discretionary (XLY) and the Industry Group to Watch will be Clothing & Accessories ($DJUSCF). I found some interesting symbols there: HBI, LAKE, FNKO and COLM.
I didn't run additional scans today as a small break for me. We'll find plenty of symbols on Monday. I'll plan on running a scan then. Hope you had a happy Thanksgiving. I'm thankful for all of you!
Have a great weekend! I'll see you in the trading room Monday!
Good Luck & Good Trading,
Erin

Diamond Mine Trading Room:
RECORDING & DOWNLOAD LINK (11/22/2024):
Topic: DecisionPoint Diamond Mine (11/22/2024) LIVE Trading Room
Recording & Download Link
Passcode: November#22
REGISTRATION for 12/6/2024:
When: December 6, 2024 09:00 AM Pacific Time (US and Canada)
Topic: DecisionPoint Diamond Mine LIVE Trading Room
Register in advance for this webinar HERE
After registering, you will receive a confirmation email containing information about joining the webinar.

Below is the latest free DecisionPoint Trading Room recording from 11/25. You'll find these recordings posted on Mondays to our DP YouTube Channel. Be sure and subscribe HERE.
A few items about the spreadsheet: I've put on the spreadsheet whether the RSI is positive (green) or negative (red). The PMO column tells you if it is rising (green) or falling (red). Finally I've added my own "Sparkle Factor" that gives you my assessment going forward, bullish (green), bearish (red) or neutral (gray). The Sparkle Factor is basically my thoughts on whether I expect it to rise or fall. A neutral means it could really go either way so it could be added to a watch list. If you're in a stock I consider "neutral" going forward, the ball is in your court.
Darling:
Cracker Barrel Old Country Store, Inc. (CBRL)
EARNINGS: 2025-02-18 (BMO)
Cracker Barrel Old Country Store, Inc. engages in the operation and development of restaurant and retail outlets. The format of its stores consists of a trademarked rustic old country-store design that offers restaurant menu featuring home-style country food. The company was founded by Dan W. Evins on September 19, 1969 and is headquartered in Lebanon, TN.
Predefined Scans Triggered: New CCI Buy Signals, P&F Bullish Catapult, Stocks in a New Uptrend (ADX), Moved Above Upper Bollinger Band, Parabolic SAR Buy Signals, P&F Ascending Triple Top Breakout and P&F Double Top Breakout.
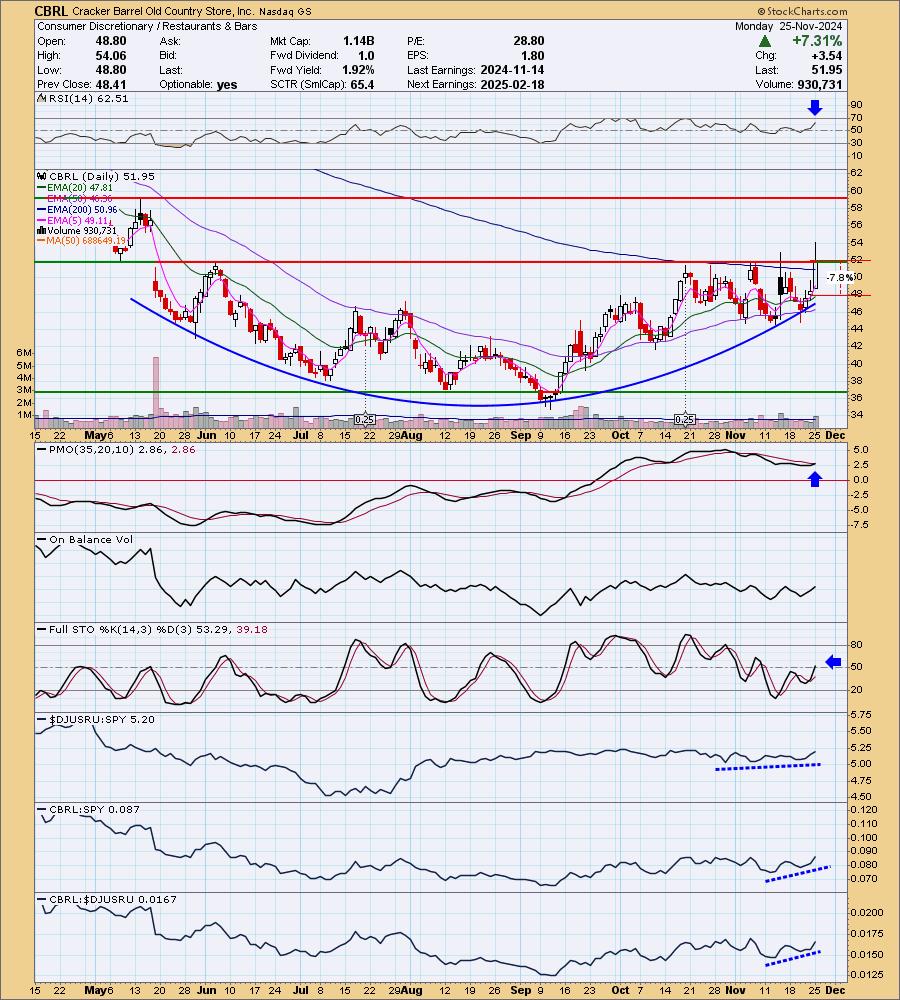
Below are the commentary and chart from Monday, 11/25:
"CBRL is up +0.65% in after hours trading. It had a heck of a rally today and I am looking for followthrough. The chart caught my eye due to the large rounded bottom base. It managed to close just above overhead resistance and above the 200-day EMA. The RSI is not overbought yet despite today's strong rally. The PMO is nearing a Crossover BUY Signal above the zero line. Stochastics just entered positive territory. Relative strength is improving slightly for the group, CBRL has been performing well against the group so it is outperforming the SPY right now. I've set the stop around the 20-day EMA at 7.8% or $47.89."
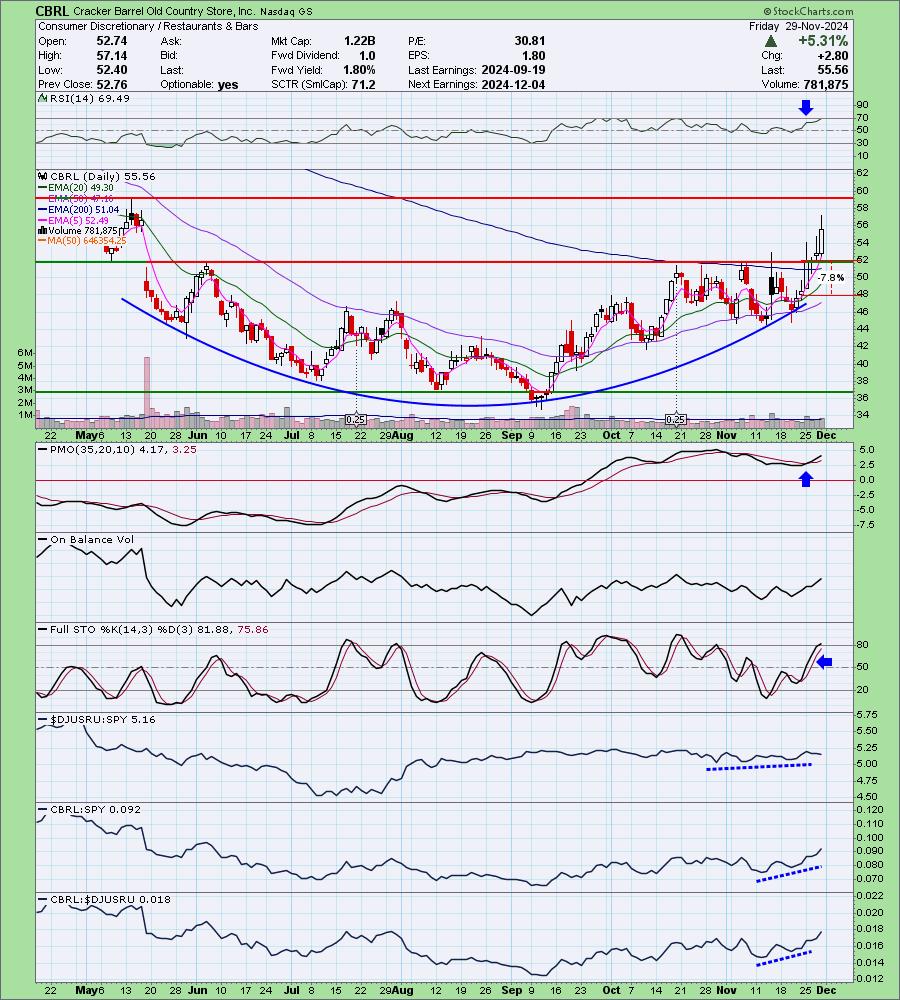
Here is today's chart:
I love these big basing patterns as they very often resolve as expected to the upside. I see more upside ahead for CBRL which had a strong breakout from the basing pattern. The RSI isn't overbought yet, but it is close so a pullback entry would be ideal right now. The PMO is still rising higher and relative strength just continues to improve. I lay the success of this chart on the chart pattern.
Don't forget, on Thursdays I look at reader-requested symbols, so shoot me an email at erin@decisionpoint.com. I read every email I receive and try to answer them all!
Dud:
MercadoLibre Inc. (MELI)
EARNINGS: 2025-02-20 (AMC)
MercadoLibre, Inc. engages in the development of an online commerce platform with a focus on e-commerce and related services. It operates through the following geographical segments: Brazil, Argentina, Mexico, and Other Countries. The Other Countries segment refers to Chile, Colombia, Costa Rica, Dominican Republic, Ecuador, Panama, Peru, Bolivia, Honduras, Nicaragua, El Salvador, Guatemala, Paraguay, Uruguay, and the United States of America. Its products provide a mechanism for buying, selling, and paying as well as collecting, generating leads, and comparing lists through e-commerce transactions. The company was founded by Marcos Eduardo Galperin on October 15, 1999 and is headquartered in Montevideo, Uruguay.
Predefined Scans Triggered: Elder Bar Turned Blue and Entered Ichimoku Cloud.
Below are the commentary and chart from Wednesday, 11/27:
"MELI is down -0.04% in after hours trading. We did see a pullback at resistance which is a bit bothersome, but this pullback could be offering a good entry. The indicators are positive and do suggest we could see a breakout. Today's big decline was bad, but it didn't change the PMO or Stochastics to negative. The RSI is positive and not overbought. The PMO is rising on a Crossover BUY Signal. Stochastics are above 80 still. Relative strength studies are very positive. This could have a little more pullback in its future, but I do think we will get that breakout eventually. It's not my favorite chart, but it is still a good one. The stop is set at 7% or $1901.62."
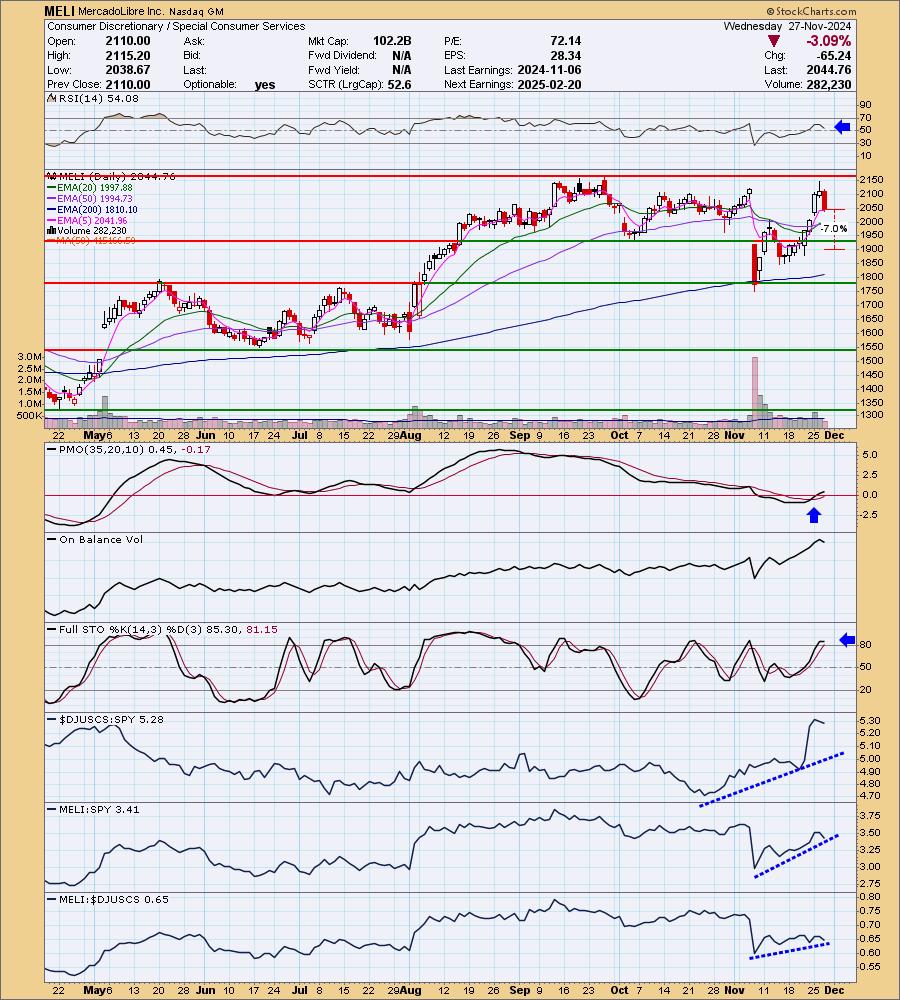
Here is today's chart:
Wednesday's pullback continued today pulling price down to support. Because it is sitting on support, I'm not ready to fully write this one off. This could be a good rebound spot. There is a long tail on the candlestick and that often times marks a low. The PMO has turned over and the RSI is negative right now so it isn't really an entry, more like a hold.
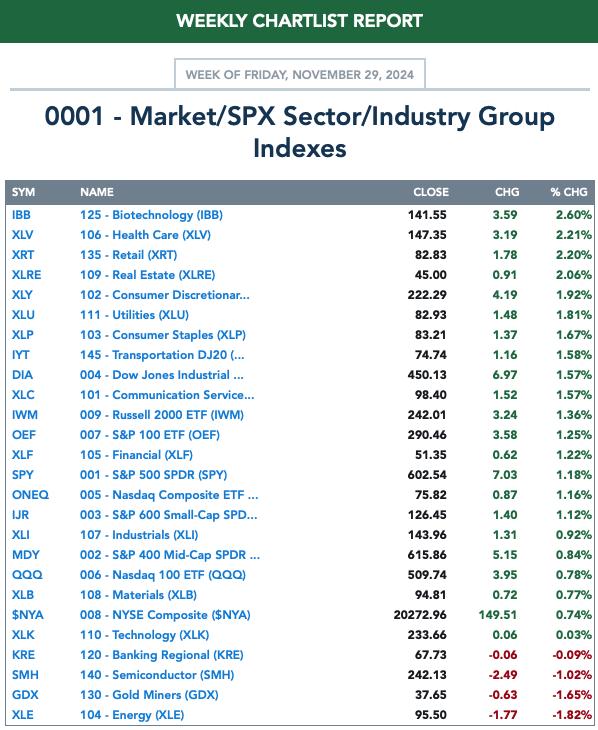
THIS WEEK's Performance:
DecisionPoint Market Scoreboard (Mechanical Trend Model Signals):
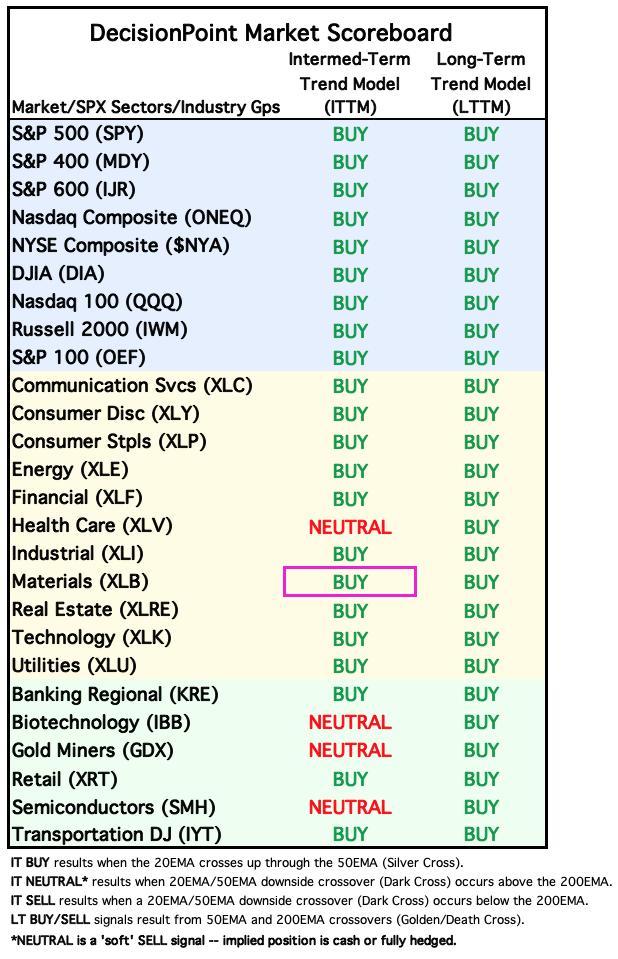
Friday signal changes are outlined in purple.
Click Here to view Carl's annotated "Under the Hood" ChartList!
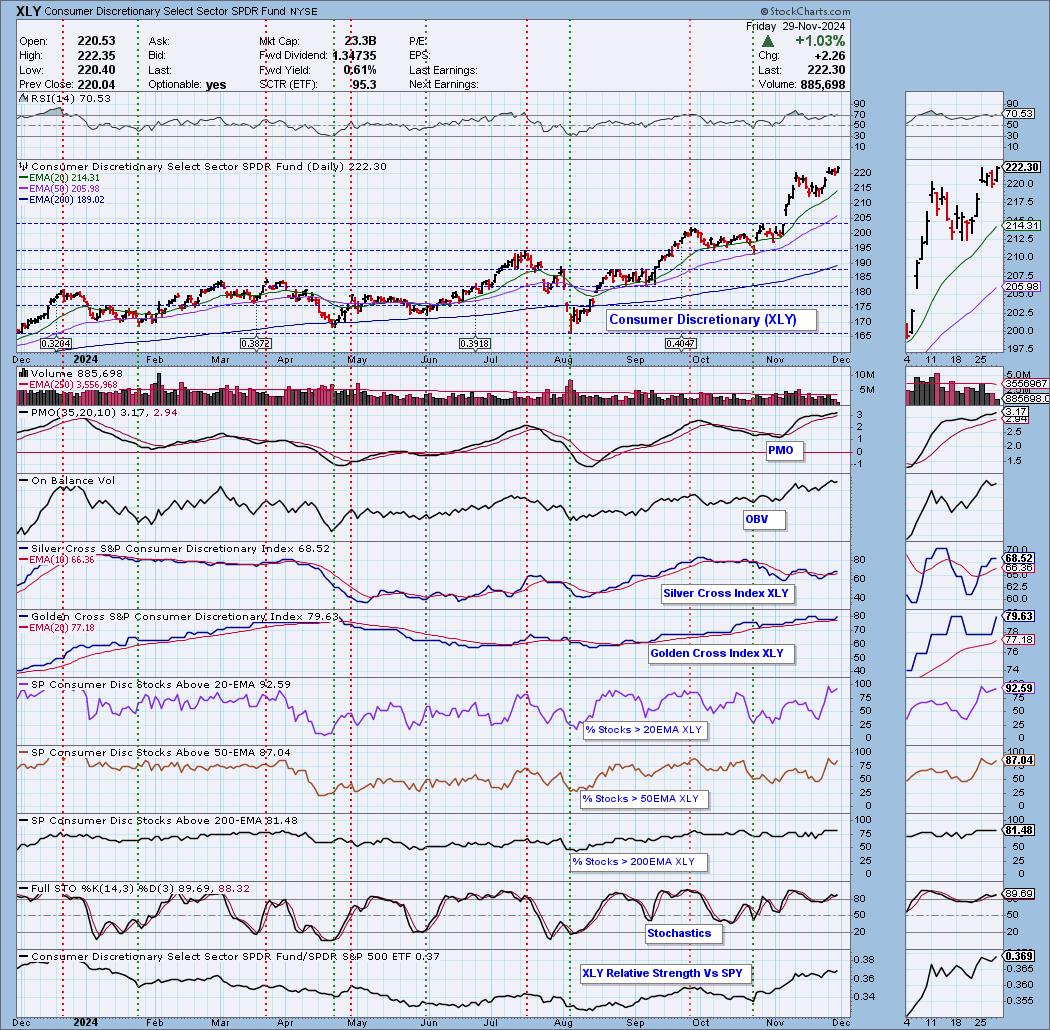
Sector to Watch: Consumer Discretionary (XLY)
XLY took a breather to digest the big rally. First it formed a flag formation and then gapped up into an island. Now I could be wrong on this and we could get a reverse island, meaning a gap down ahead but the internals are just too strong for us to look for that now. The PMO is surging above the signal line. The RSI is overbought slightly, but not too much to expect a decline next week. I think it will hold that condition given today's breakout. The Silver Cross Index and Golden Cross Index are on the rise and are at healthy not overbought levels. Participation is somewhat overbought, but it is robust enough to keep the rally going. It could actually expand a bit more from here. Stochastics turned up above 80 and relative strength is rising. I'm counting on a strong retail season.
Industry Group to Watch: Clothing & Accessories ($DJUSCF)
We have a recent breakout. The chart looks very much like XLY which is why I like it. The RSI in this case is not overbought though. The PMO is rising on a Crossover BUY Signal that occurred well above the zero line. Stochastics are above 80 and we see rising relative strength. A few symbols for your review here: HBI, LAKE, FNKO and COLB.
Go to our Under the Hood ChartList on DecisionPoint.com to get an in-depth view of all the sectors. On StockCharts.com you can find the Industry Summary.
Good Luck & Good Trading!
- Erin
erin@decisionpoint.com
Full Disclosure: I'm 60% long, 0% short.
Watch the latest episode of the DecisionPoint Trading Room with Carl & Erin Swenlin HERE!
Technical Analysis is a windsock, not a crystal ball. --Carl Swenlin
NOTE: The stocks reported herein are from mechanical trading model scans that are based upon moving average relationships, momentum and volume. DecisionPoint analysis is then applied to get selections from the scans. The selections given should prompt readers to do a chart review using their own analysis process. This letter is not a call for a specific action to buy, sell or short any of the stocks provided. There are NO sure things or guaranteed returns on the selection of "diamonds in the rough."
Helpful DecisionPoint Links:
DecisionPoint Shared ChartList and DecisionPoint Chart Gallery
Price Momentum Oscillator (PMO)
Swenlin Trading Oscillators (STO-B and STO-V)
(c) Copyright 2024 DecisionPoint.com