
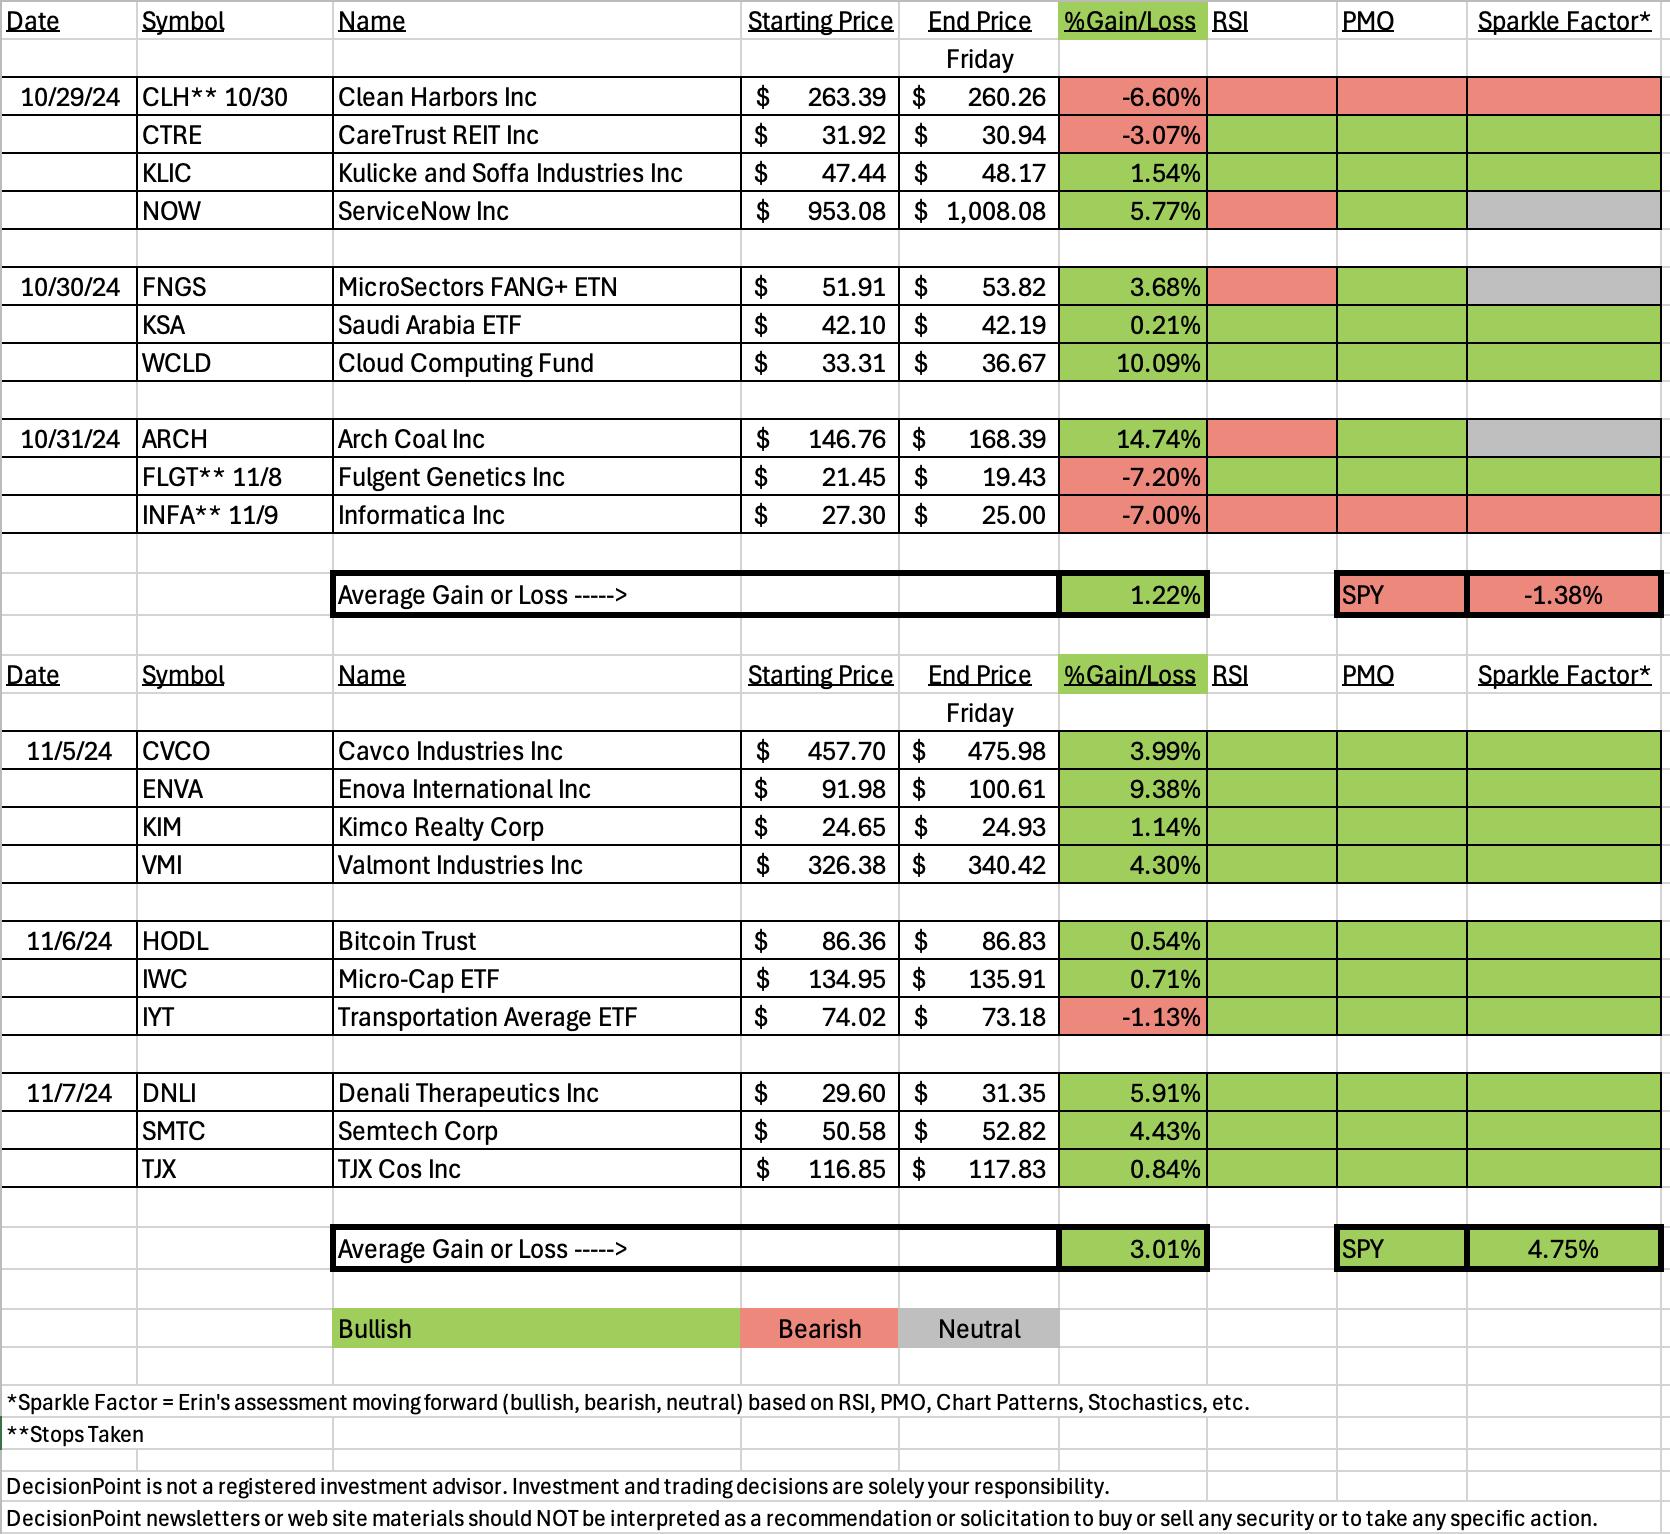
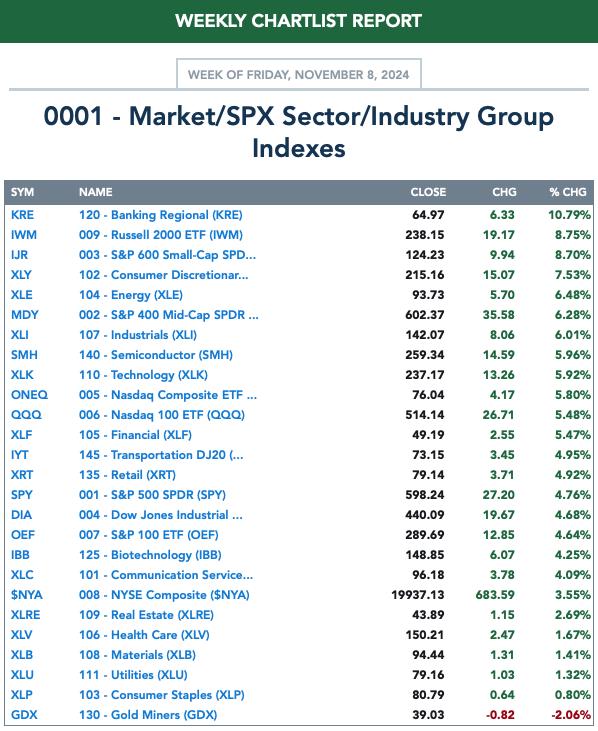
The election lifted nearly all boats with its rising tide. Some areas were not necessarily beneficiaries, but most did see excellent follow through. This week's Diamonds in the Rough enjoyed an excellent week. Only one of the positions was down and that position still looks bullish moving forward.
The one that declined, our Dud, was IYT the Transports ETF. I still like this area of the market and with the slight decline it makes it a better entry. The Darling this week was ENVA Enova International. It was up almost 10% since being picked on Tuesday.
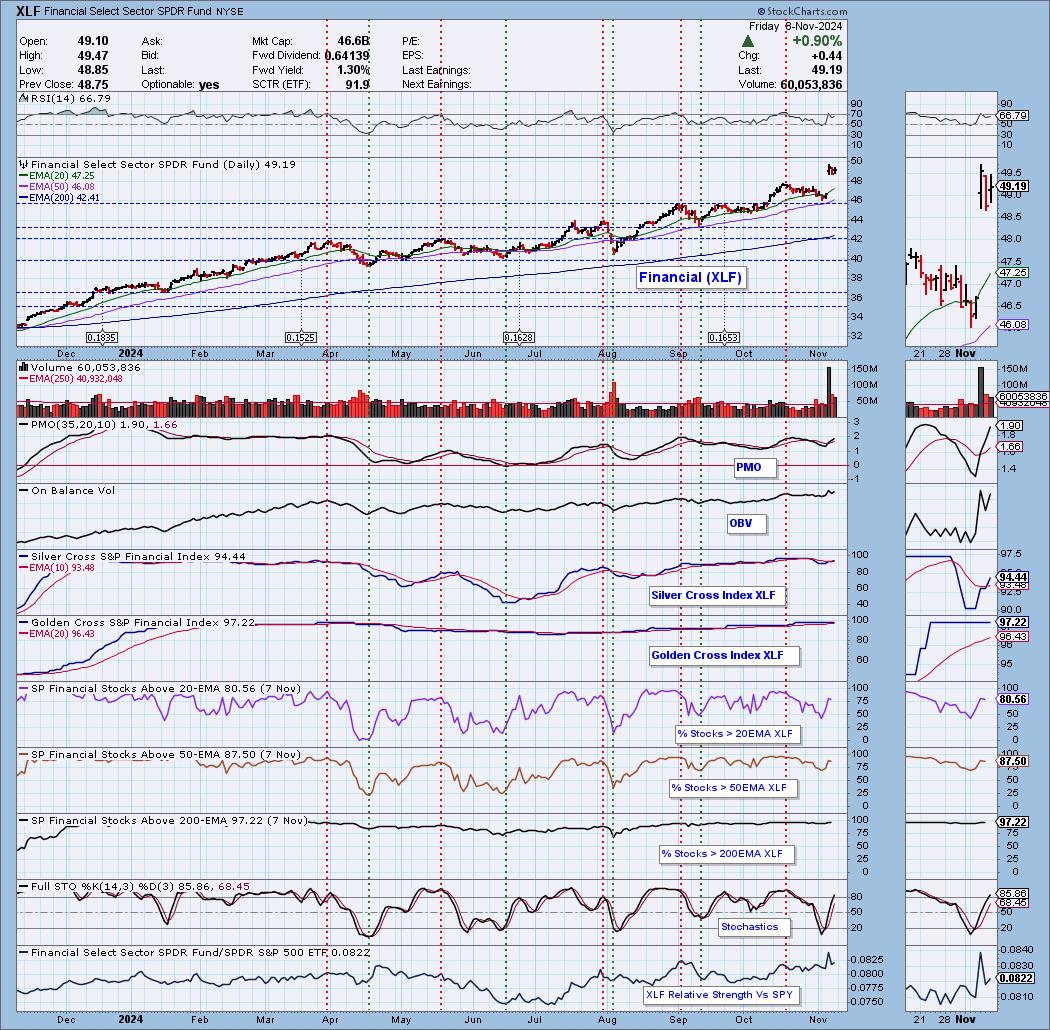
The Sector to Watch was narrowed down to Financials and Industrials. The consensus in the Diamond Mine was to go with Financials. I was worried they were overbought, but the RSI is still technically below 70.
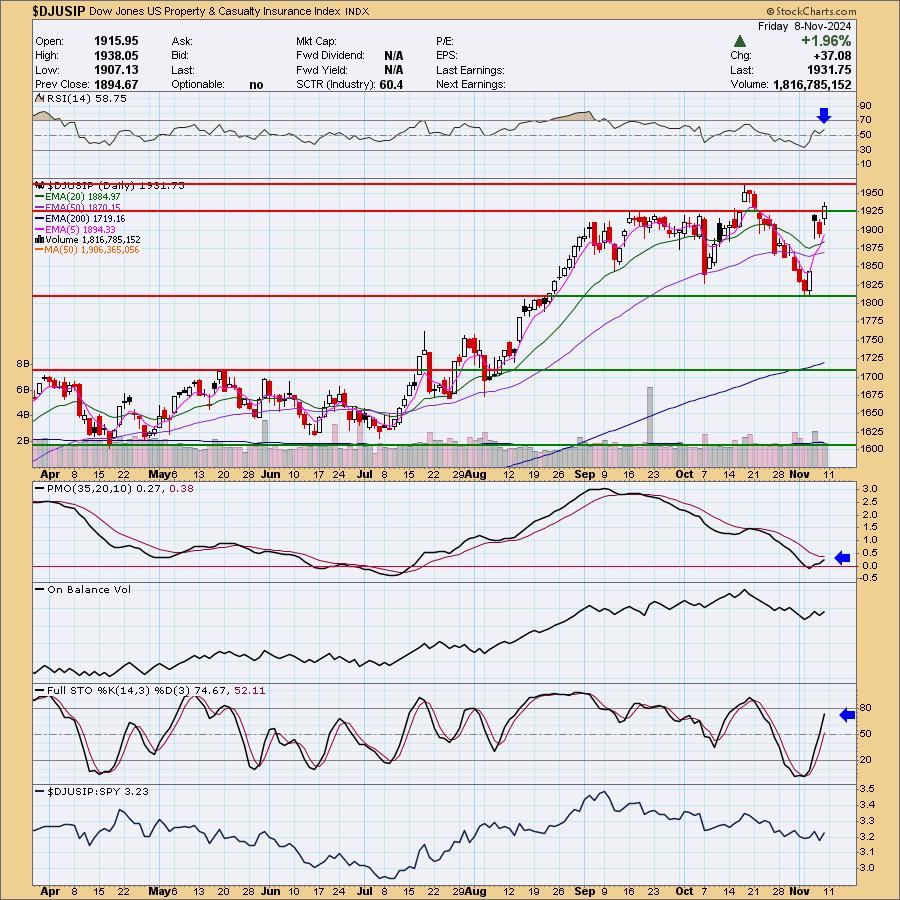
The Industry Group to Watch ended up being Property-Casualty Insurance which had quite a few symbols that looked good moving forward. Check out: HRTG, MCY, CINF, PGR and AXS.
Finally, we ran the Diamond PMO Scan at the end of the trading room and found some symbols of interest: DEI, AVGO, TT, TBBK and MMM.
Have a great weekend! I'll see you in the trading room Monday!
Good Luck & Good Trading,
Erin

Diamond Mine Trading Room:
RECORDING & DOWNLOAD LINK (11/8/2024):
Topic: DecisionPoint Diamond Mine (11/8/2024) LIVE Trading Room
Recording & Download Link
Passcode: November#8
REGISTRATION for 11/15/2024:
When: November 15, 2024 09:00 AM Pacific Time (US and Canada)
Topic: DecisionPoint Diamond Mine LIVE Trading Room
Register in advance for this webinar HERE
After registering, you will receive a confirmation email containing information about joining the webinar.

Below is the latest free DecisionPoint Trading Room recording from 11/4. You'll find these recordings posted on Mondays to our DP YouTube Channel. Be sure and subscribe HERE.
A few items about the spreadsheet: I've put on the spreadsheet whether the RSI is positive (green) or negative (red). The PMO column tells you if it is rising (green) or falling (red). Finally I've added my own "Sparkle Factor" that gives you my assessment going forward, bullish (green), bearish (red) or neutral (gray). The Sparkle Factor is basically my thoughts on whether I expect it to rise or fall. A neutral means it could really go either way so it could be added to a watch list. If you're in a stock I consider "neutral" going forward, the ball is in your court.
Darling:
Enova International, Inc. (ENVA)
EARNINGS: 2025-01-28 (AMC)
Enova International, Inc. engages in the provision of online financial services. Its products and services include short-term consumer loan, line of credit accounts, instalment loans, receivables purchase agreements, credit services organization program, bank program, and decision management platform-as-a-service & analytics-as-a-service. It caters non-prime credit consumers and small businesses in the United States and Brazil. The company was founded by Albert Goldstein and Alexander Goldstein in 2003 and is headquartered in Chicago, IL.
Predefined Scans Triggered: Moved Above Upper Bollinger Band.
Below are the commentary and chart from Tuesday, 11/5:
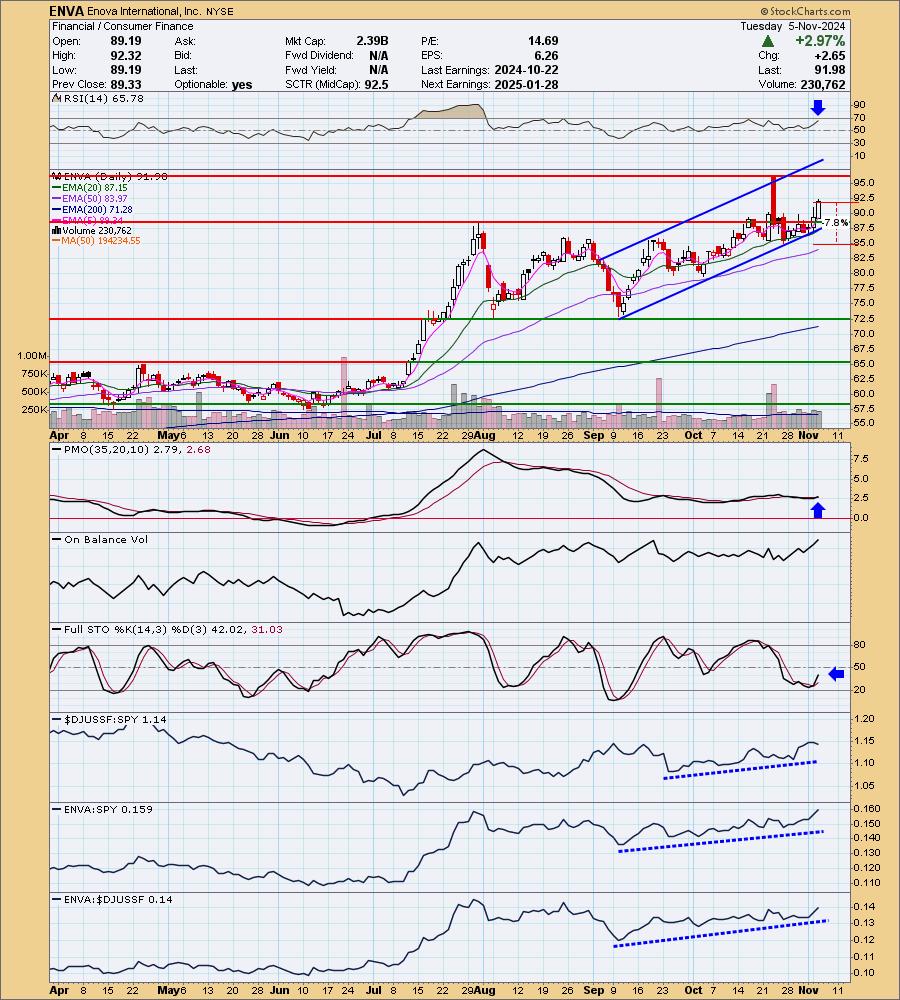
"ENVA is up +0.62% in after hours trading. We have a breakout above resistance and a nice rising trend channel that price is coming off the bottom of. The RSI is not yet overbought and the PMO is on a new Crossover BUY Signal. Note also that the PMO is flat above the signal line implying pure strength. Stochastics have turned back up and relative strength is solid across the board. The stop is set below support and near the 50-day EMA at 7.8% or $84.80."
Here is today's chart:
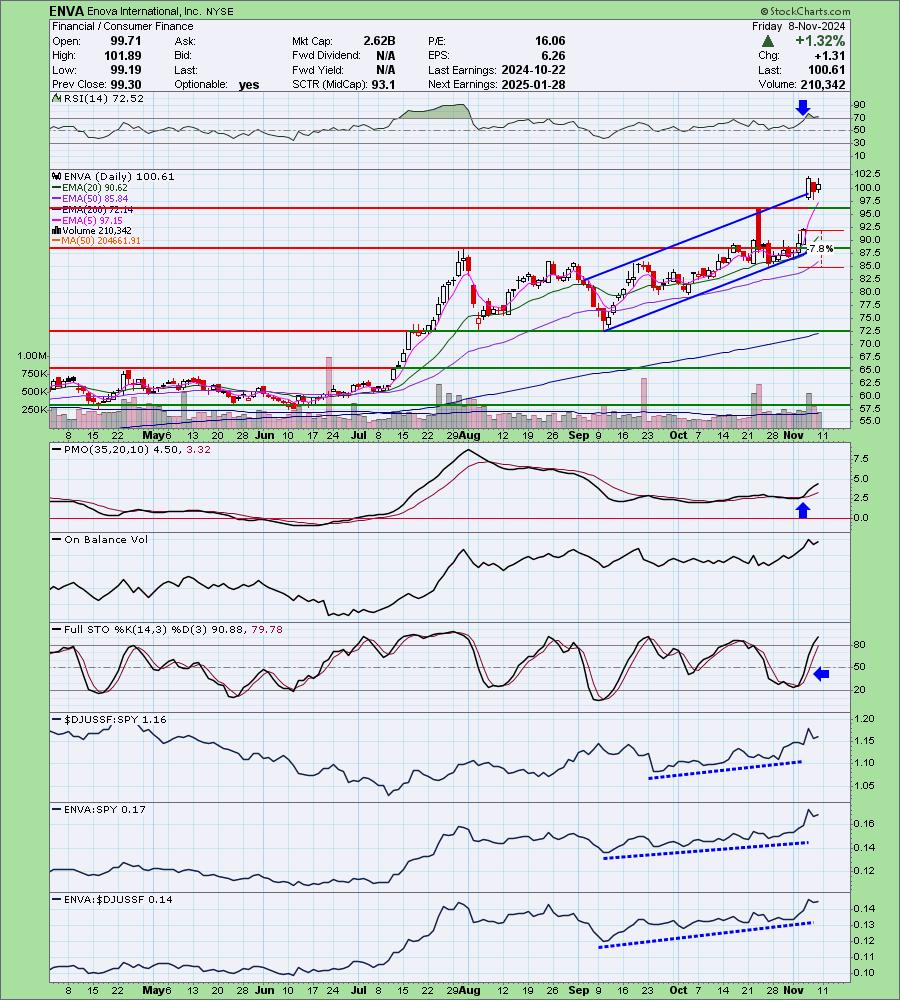
The election aftermath gave ENVA a beautiful gap up and out of the rising trend channel. This is especially bullish. Price is now digesting the move. The RSI has moved into overbought territory so it is may be a bit too late for entry, but a pullback could make it more attractive. The PMO and Stochastics are very bullish. There is likely more upside ahead.
Don't forget, on Thursdays I look at reader-requested symbols, so shoot me an email at erin@decisionpoint.com. I read every email I receive and try to answer them all!
Dud:
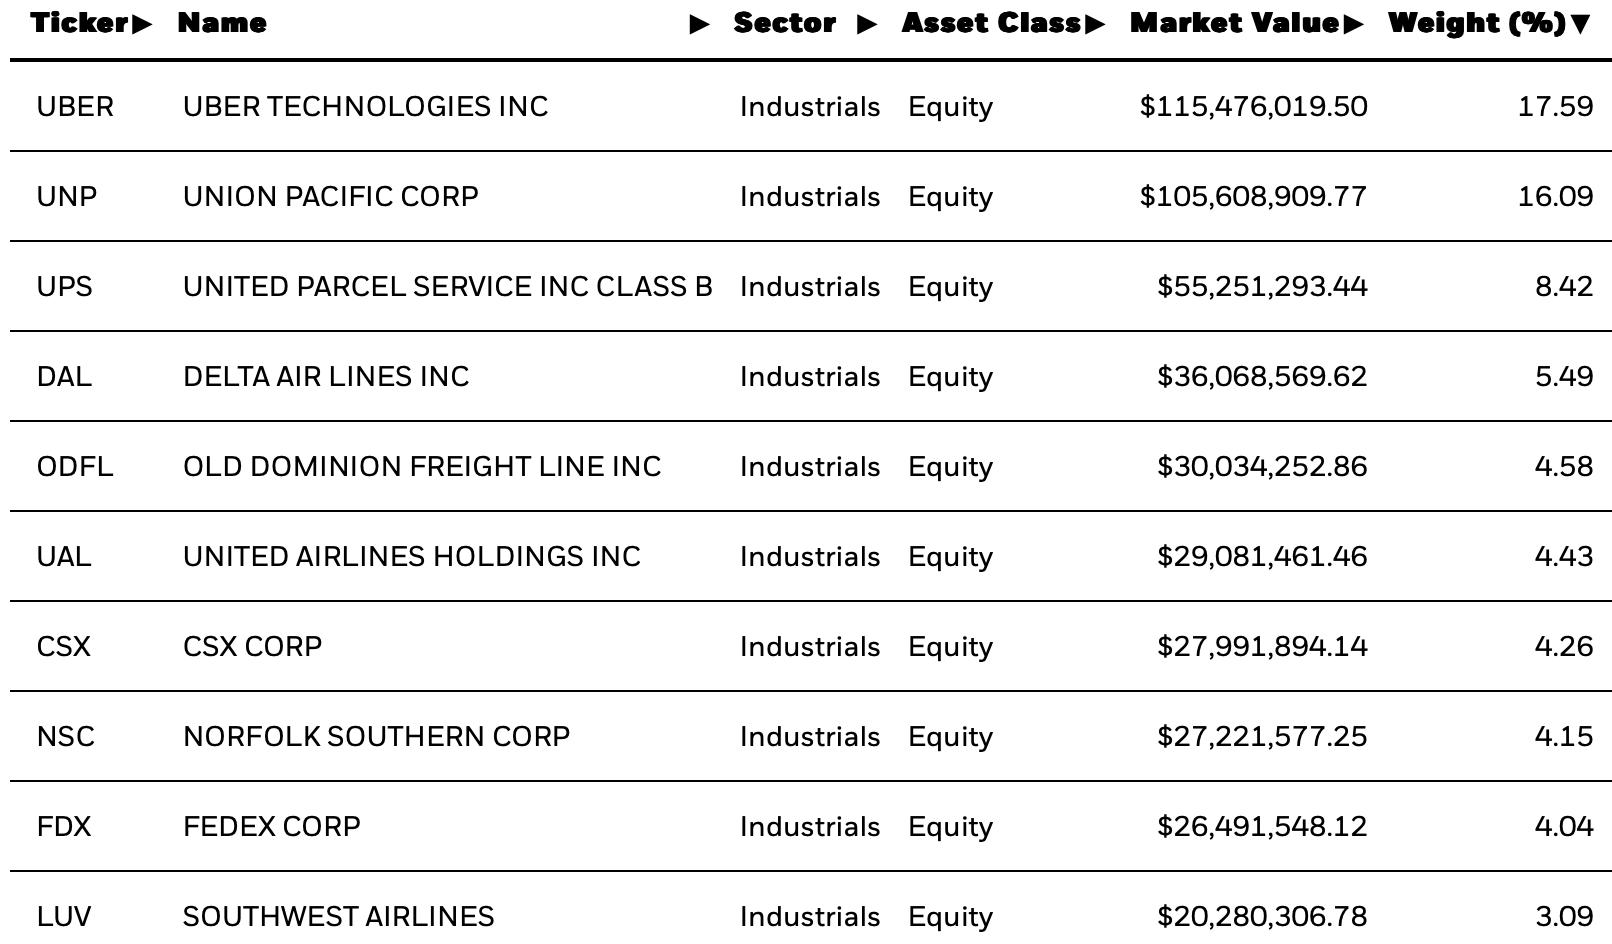
iShares Transportation Average ETF (IYT)
EARNINGS: N/A
IYT tracks a broad-based, modified market-cap-weighted index of US stocks in the transportation industry. Click HERE for more information.
Predefined Scans Triggered: New CCI Buy Signals, Moved Above Upper Keltner Channel, New 52-week Highs, Moved Above Upper Bollinger Band, Stocks in a New Uptrend (Aroon), Moved Above Upper Price Channel, Parabolic SAR Buy Signals and P&F Double Top Breakout.
Below are the commentary and chart from Wednesday, 11/6:
"IYT is up +0.88% in after hours trading. Today saw a huge breakout gap up move that took price out of a declining trend and congestion area. The RSI is not yet overbought and the PMO is on a new Crossover BUY Signal. The Silver Cross Index is at a robust 80% and rising and the Golden Cross Index is at a healthy 85% and rising. Participation is strong with 85% plus holding above key moving averages. We can also see that this group has been outperforming the SPY for some time. The stop is set beneath support around the 50-day EMA at 7.6% or $68.39."
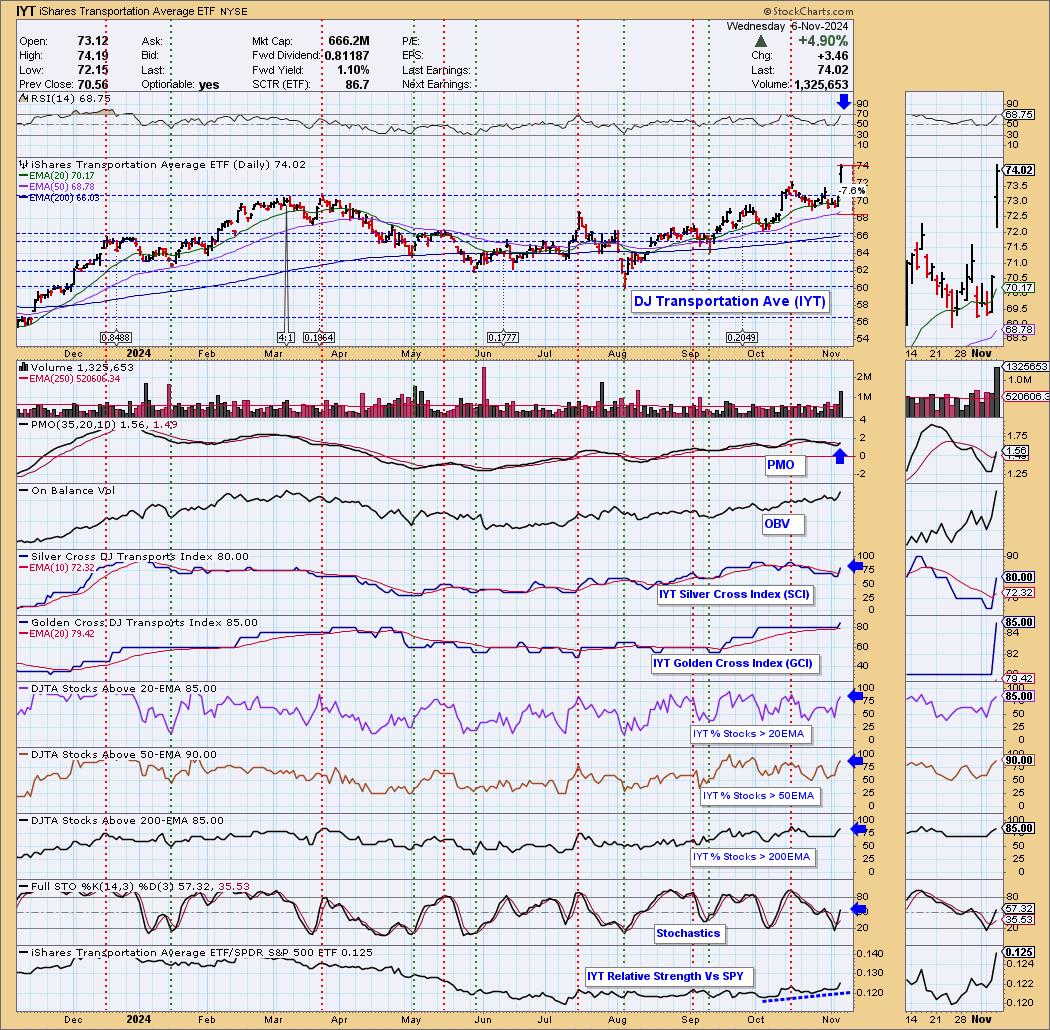
Here is today's chart:
The only real issue here is that it began consolidating the gap up move and so it ended up down by today. The chart is still very bullish given strong participation. The Silver and Golden Cross Indexes are very bullish in the 80th percentile. 90% of stocks are above both the 20/50-day EMAs. I don't see any weakness.
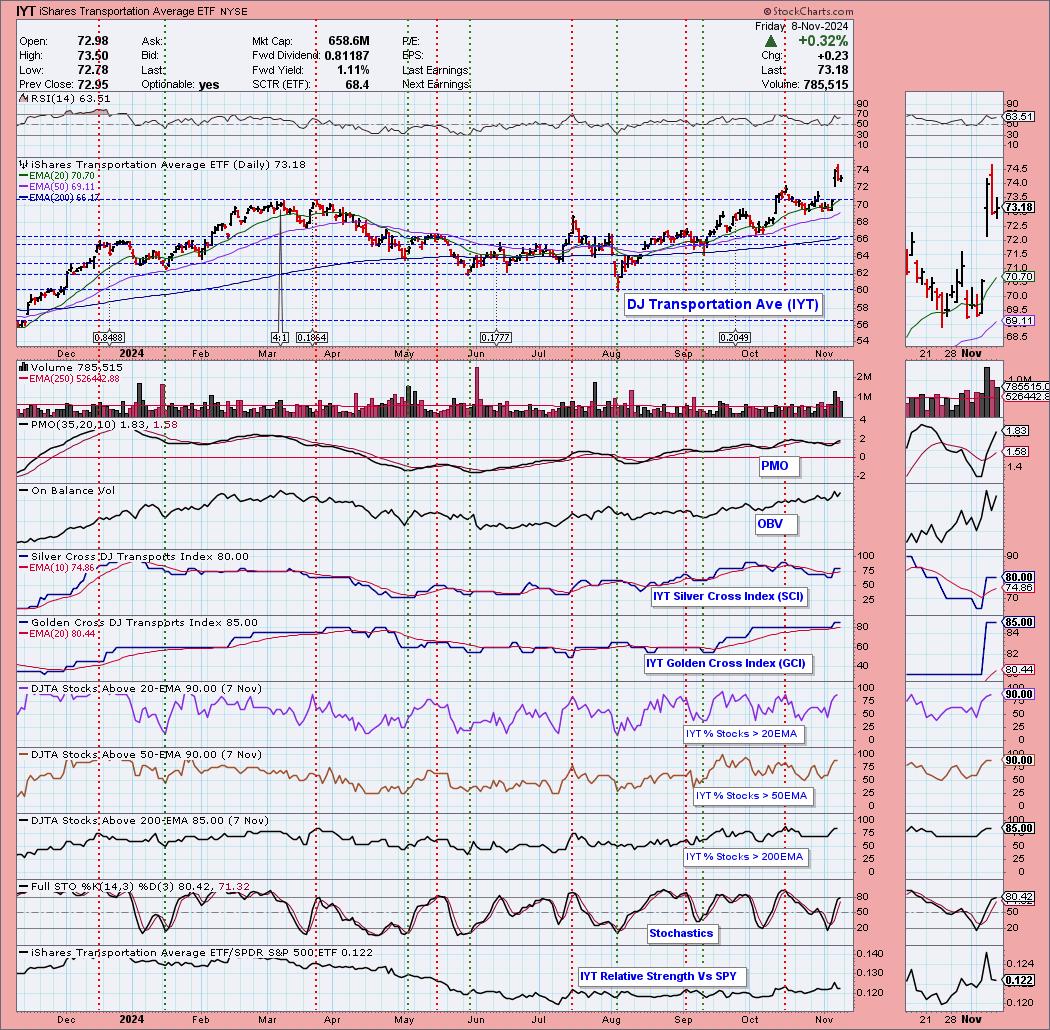
THIS WEEK's Performance:
DecisionPoint Market Scoreboard (Mechanical Trend Model Signals):
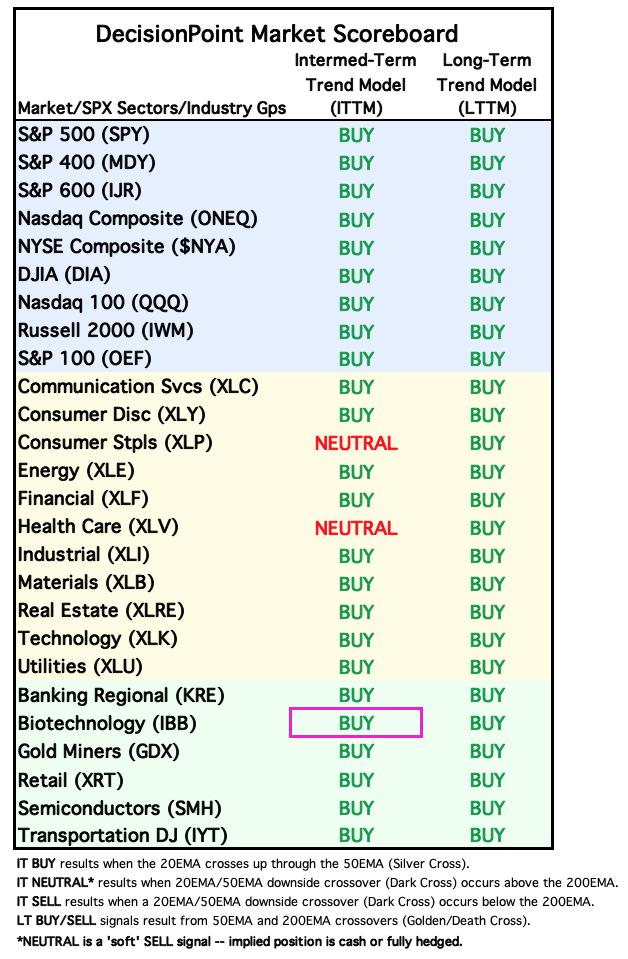
Friday signal changes are outlined in purple.
Click Here to view Carl's annotated "Under the Hood" ChartList!
Sector to Watch: Financials (XLF)
This is a sector that gapped up on the election as Trump indicates that he will be deregulating. This is a sector that will benefit. If the Trump trade gets tired though it will be due for some pullback. For now we have very strong participation readings and clear outperformance. Best news is that the RSI is not overbought. Stochastics look very good as well.
Industry Group to Watch: Property & Casualty Insurance ($DJUSIP)
This looks like a good group. The problem I had was that all of the really good looking groups were overbought based on the RSI. That only left a few groups to work with. This one looked promising. It had a terrible decline before gapping up and recovering most of the losses. The RSI is not overbought at all so it can accommodate more upside. The PMO is nearing a Crossover BUY Signal and Stochastics are rising toward 80. Relative strength isn't great and that is due to the prior decline. There were some symbols within that looked promising with better charts than this one: HRTG, MCY, CINF, PGR and AXS.
Go to our Under the Hood ChartList on DecisionPoint.com to get an in-depth view of all the sectors. On StockCharts.com you can find the Industry Summary.
Good Luck & Good Trading!
- Erin
erin@decisionpoint.com
Full Disclosure: I'm 75% long, 0% short.
Watch the latest episode of the DecisionPoint Trading Room with Carl & Erin Swenlin HERE!
Technical Analysis is a windsock, not a crystal ball. --Carl Swenlin
NOTE: The stocks reported herein are from mechanical trading model scans that are based upon moving average relationships, momentum and volume. DecisionPoint analysis is then applied to get selections from the scans. The selections given should prompt readers to do a chart review using their own analysis process. This letter is not a call for a specific action to buy, sell or short any of the stocks provided. There are NO sure things or guaranteed returns on the selection of "diamonds in the rough."
Helpful DecisionPoint Links:
DecisionPoint Shared ChartList and DecisionPoint Chart Gallery
Price Momentum Oscillator (PMO)
Swenlin Trading Oscillators (STO-B and STO-V)
(c) Copyright 2024 DecisionPoint.com