
We are clearly in a downturn in the market and that is making stock picking particularly difficult. For the record, the Diamond Dog Scan which produces shorting candidates is still fairly small, but bullish scans are really hurting. Those of you with the Scan Alert System, I wasn't thrilled with any of today's results. I will contemplate adding shorts next week, but ultimately the internals of the market haven't fallen apart. It's just going to be hard to find strong candidates when the market trend is down. Make sure you have your stops in play on short-term investments. Intermediate-term investments should weather this storm, but it never hurts to book a profit either. Watch for declining PMOs with Crossover SELL Signals along with topping Stochastics.
Thank you to those who provided picks today. I know it was hard. I found three charts that look pretty good, but all stocks are going to have an uphill battle if this decline gets going.
It's already time for the Diamond Mine trading room! Don't forget to register! See you then!
Good Luck & Good Trading,
Erin
Today's "Diamonds in the Rough": HEI, PRMW and SHOP.
Other requests: RKLB, ALT, CIEN, J, AS and PWR.

Diamond Mine Trading Room:
RECORDING & DOWNLOAD LINK (11/8/2024):
Topic: DecisionPoint Diamond Mine (11/8/2024) LIVE Trading Room
Recording & Download Link
Passcode: November#8
REGISTRATION for 11/15/2024:
When: November 15, 2024 09:00 AM Pacific Time (US and Canada)
Topic: DecisionPoint Diamond Mine LIVE Trading Room
Register in advance for this webinar HERE
After registering, you will receive a confirmation email containing information about joining the webinar.

Below is the latest free DecisionPoint Trading Room recording from 11/11. You'll find these recordings posted on Mondays to our DP YouTube Channel. Be sure and subscribe HERE.
Welcome to DecisionPoint Diamonds, wherein I highlight ten "Diamonds in the Rough" per week. These are selected from the results of my DecisionPoint Scans which search for stocks that could benefit from the trend and condition of the market. Remember, these are not recommendations to buy or sell, but are the most interesting of the stocks that surfaced in my scans. My objective is to save you the work of the initial, tedious culling process, but you need to apply your own analysis to see if these stocks pique your interest as well. There are no guaranteed winners here!
"Predefined Scans Triggered" are taken from StockCharts.com using the "Symbol Summary" option instead of a "SharpChart" on the workbench.
Stop levels are all rounded down.
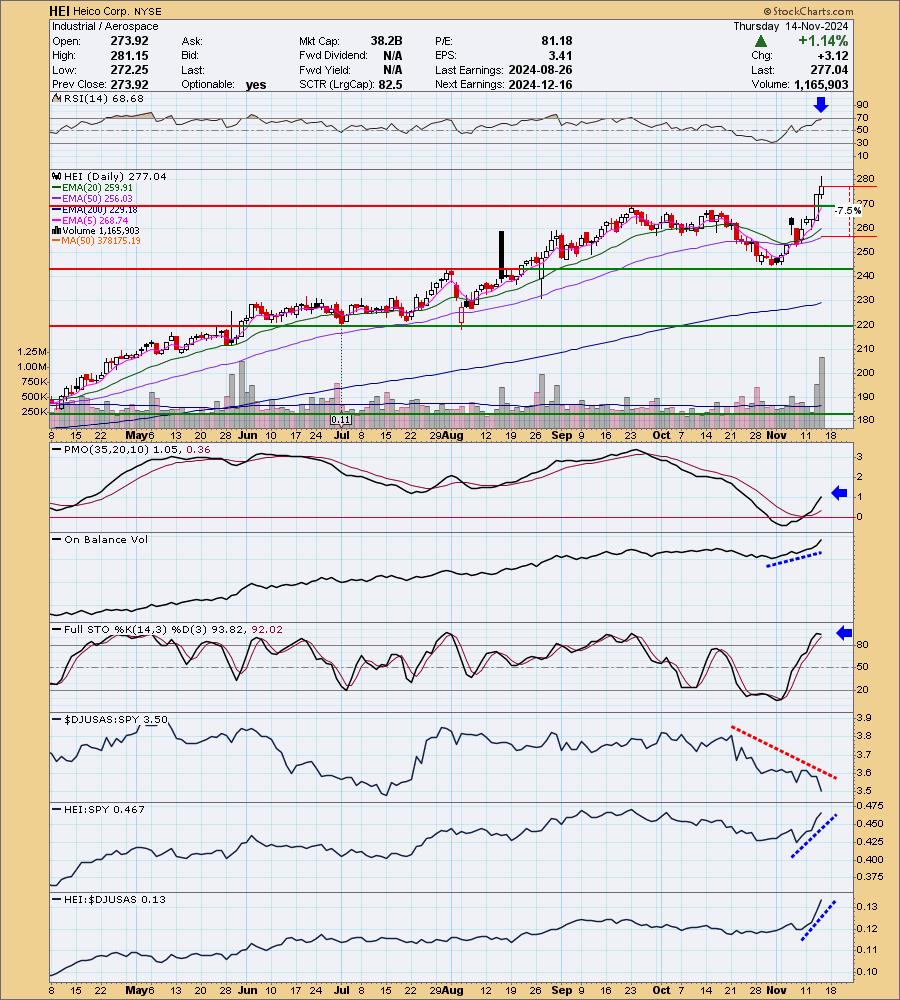
Heico Corp. (HEI)
EARNINGS: 2024-12-16 (AMC)
HEICO Corp. engages in the manufacturing of electronic equipment for the aviation, defense, space, medical, telecommunications, and electronics industries. It operates through the Flight Support Group and Electronic Technologies Group segments. The Flight Support Group segment designs, manufactures, repairs, overhauls, and distributes jet engine and aircraft component replacement parts. The Electronic Technologies Group segment focuses on designing and manufacturing electronic, data and microwave, and electro-optical products, including infrared simulation and test equipment, laser rangefinder receivers, electrical power supplies, back-up power supplies, power conversion products, underwater locator beacons, emergency locator transmission beacons, flight deck annunciators, panels and indicators, electromagnetic and radio frequency interference shielding and filters, high power capacitor charging power supplies, amplifiers, traveling wave tube amplifiers, photo detectors, amplifier modules, microwave power modules, flash lamp drivers, laser diode drivers, arc lamp power supplies, custom power supply designs, cable assemblies, high voltage power supplies, high voltage interconnection devices and wire, high voltage energy generators, high frequency power delivery systems, and memory products. The company was founded in 1957 and is headquartered in Hollywood, FL.
Predefined Scans Triggered: New 52-week Highs, P&F Ascending Triple Top Breakout and P&F Double Top Breakout.
HEI is up +0.04% in after hours trading. We have a nice strong breakout on the chart hitting new 52-week highs. The rally is slightly stale, but the past two days show a nice thrust upward. The RSI is getting overbought, but so far staying below 70. The PMO is rising strongly on a Crossover BUY Signal above the zero line. The OBV is showing excellent volume coming in and is confirming the rally with its own rise. The group is not doing well unfortunately and that could apply some downside pressure, but so far that hasn't been a problem as it is outperforming the group and the SPY by a mile. The stop is set near the 50-day EMA at 7.5% or $256.26.
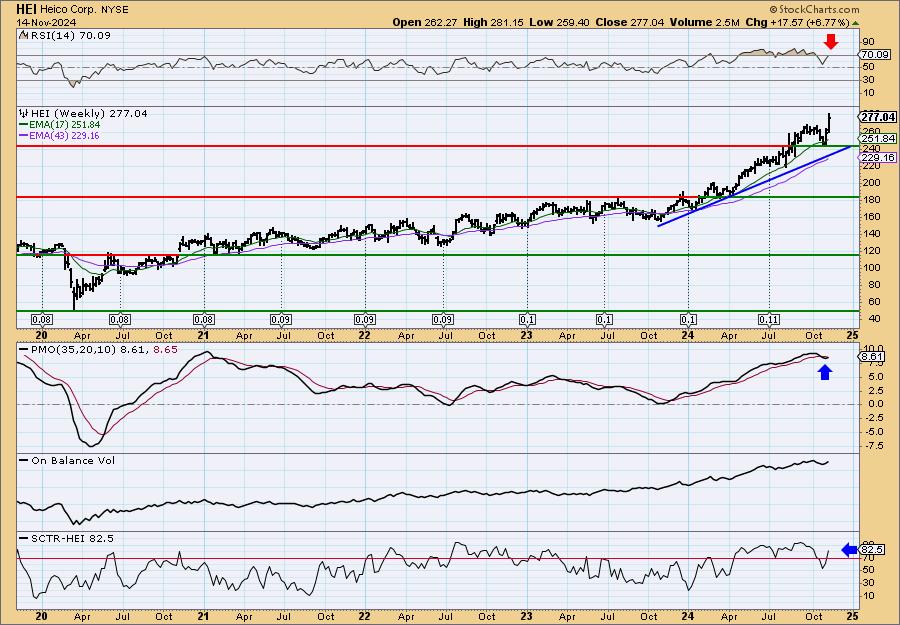
We have a solid rising trend on the weekly chart that implies more upside to be had. The weekly RSI is overbought, but only a little and it has held those conditions with no problem this year. The weekly PMO is turning back up well above the zero line and the StockCharts Technical Rank (SCTR) is well within the hot zone* above 70. Consider a 17% upside target to $324.14.
*If a stock is in the "hot zone" above 70, it implies that it is stronger than 70% of its universe (large-, mid-, small-caps and ETFs) primarily in the intermediate to long terms.
Primo Water Corporation (PRMW)
EARNINGS: 2025-02-26 (BMO)
Primo Brands Corp. is a branded beverage company. It focuses on healthy hydration, delivering sustainably and domestically sourced diversified offerings across products, formats, channels, price points and consumer occasions, distributed in every state and Canada. The company was founded on June 16, 2024 and is headquartered in Tampa FL.
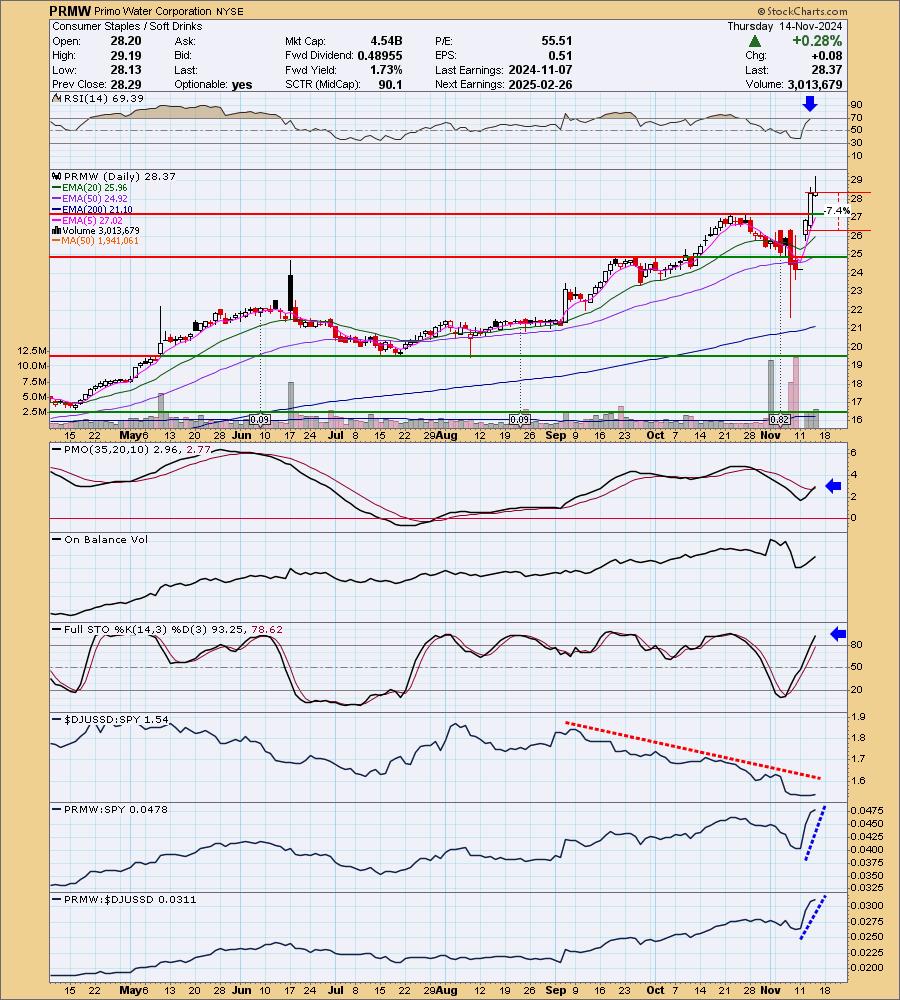
Predefined Scans Triggered: New 52-week Highs, P&F Ascending Triple Top Breakout and P&F Double Top Breakout.
PRMW is unchanged in after hours trading. Here we have a strong upward thrust and breakout. This has brought the RSI into overbought territory, but this stock's personality shows it isn't afraid of overbought conditions. The PMO is on a new Crossover BUY Signal. I'd prefer to see the OBV making new highs of its own, but it is showing strong volume on this rally. Stochastics are rising strongly. The group is struggling, but I am looking for Consumer Staples to improve on this market downturn as it is defensive. This stock could benefit. This rally has set it up for excellent outperformance against the group and the SPY. The stop is set near the 20-day EMA at 7.4% or $26.27.
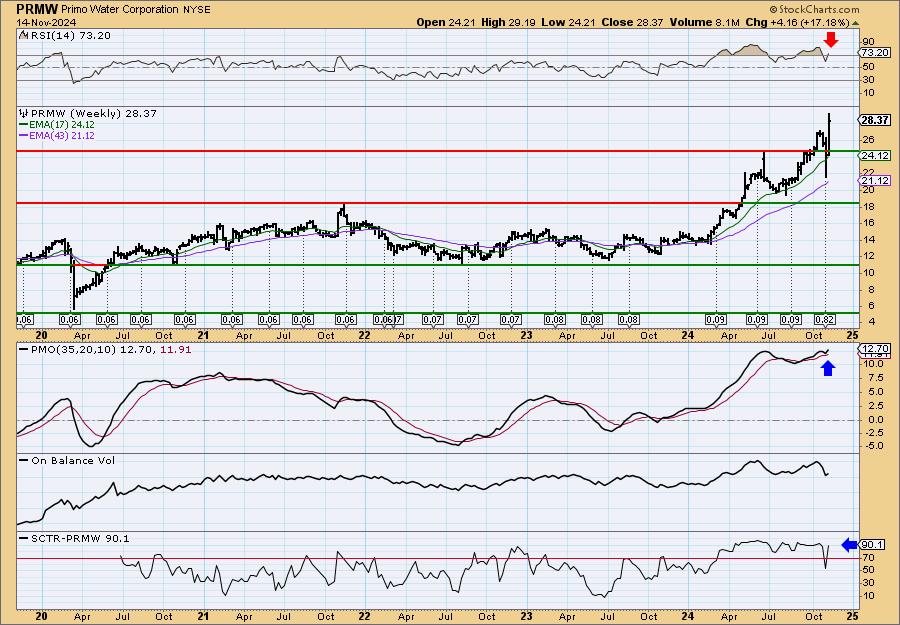
The weekly chart shows a nice rising trend and breakout that suggests price could run higher from here. The weekly RSI did get overbought, but it can get far more overbought without issue. The weekly PMO has surged (bottomed) above the signal line and the SCTR is in the hot zone. Consider a 17% upside target to about $33.19.
Shopify, Inc. (SHOP)
EARNINGS: 2025-02-11 (BMO)
Shopify, Inc. engages in the cloud-based commerce platform designed for small and medium-sized businesses. Its software is used by merchants to run business across all sales channels, including web, tablet and mobile storefronts, social media storefronts, and brick-and-mortar, and pop-up shops. The firm's platform provides merchants with a single view of business and customers and enables them to manage products and inventory, process orders and payments, build customer relationships and leverage analytics and reporting. It focuses on merchant and subscription solutions. The company was founded on September 28, 2004 and is headquartered in Ottawa, Canada.
Predefined Scans Triggered: P&F Bear Trap.
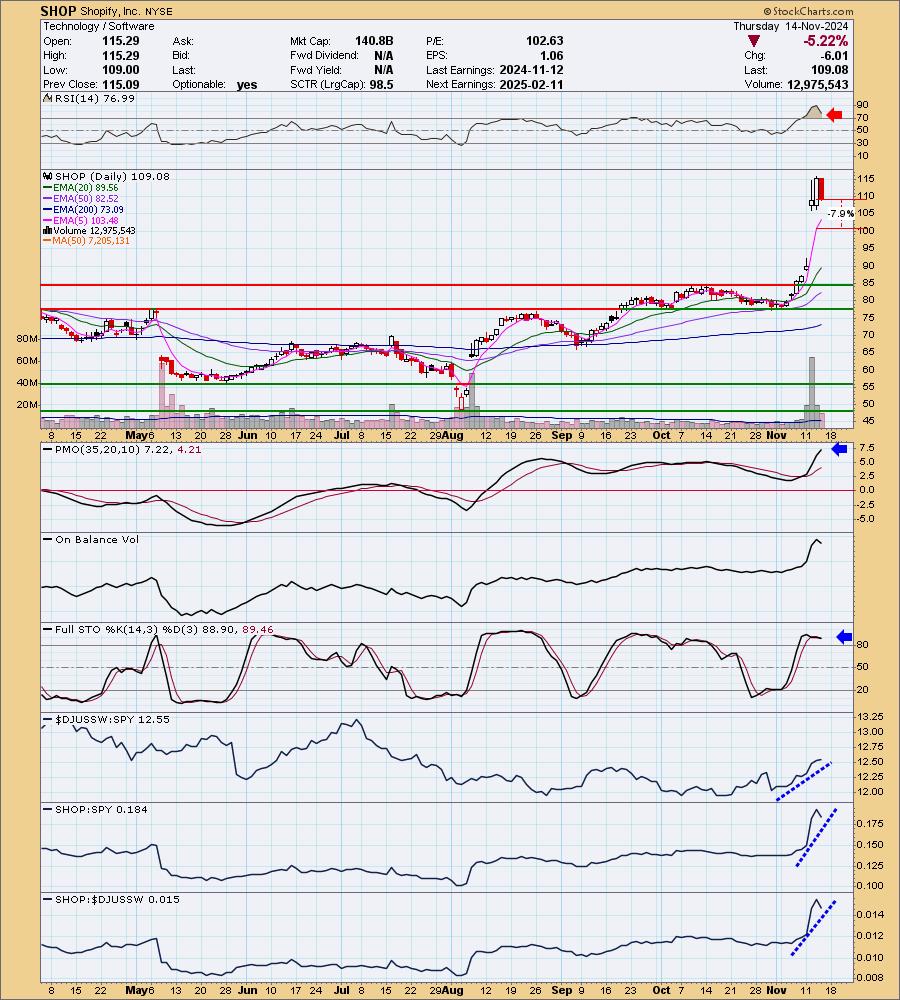
SHOP is down -0.44% in after hours trading. It may not be done pulling back, but this breakout coming off a rising trend looks very good. It has already reported earnings and they were clearly well received. We should see some followthrough, but as I mentioned it may need more pullback first which is why I have set the stop so deeply at 7.9% or $100.46. The RSI is still very overbought, but a little more pull back or even more sideways movement would clear that condition. The PMO is rising very strongly and is well above the zero line. Stochastics are holding above 80 so internal strength is still strong. Relative strength studies are very positive across the board. I think this would be slightly more attractive on a bit more pullback.
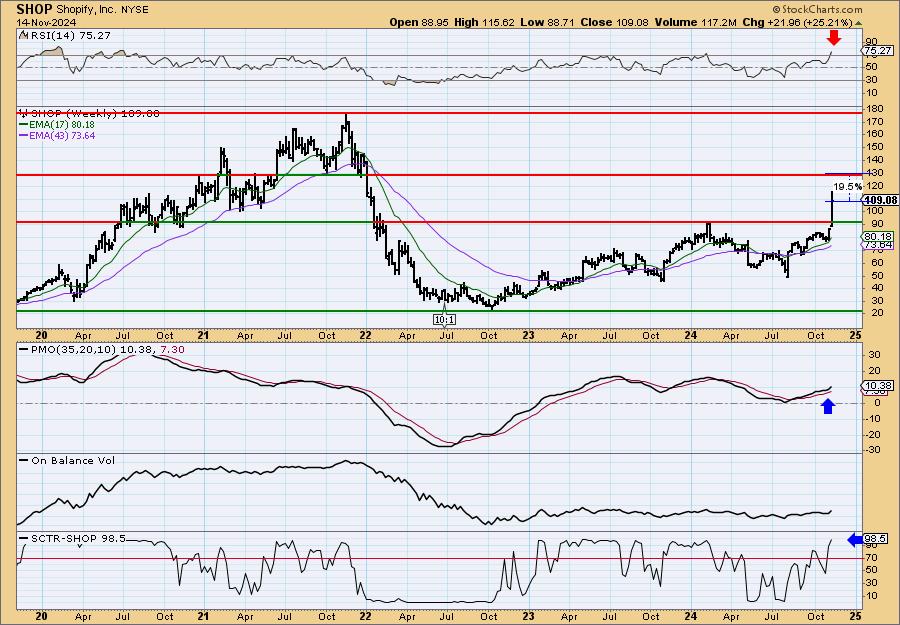
This is an excellent breakout above strong overhead resistance. The weekly RSI has gotten overbought so as above, it could be due for a bit more consolidation or digestion of the gap up rally. The weekly PMO has surged above the signal line above the zero line. The SCTR is in the hot zone. If it can get to the next level of resistance, it would be an over 19% gain.
Don't forget, on Thursdays I look at reader-requested symbols, click HERE to send me an email. I read every email I receive and try to answer them all!
Current Market Outlook:
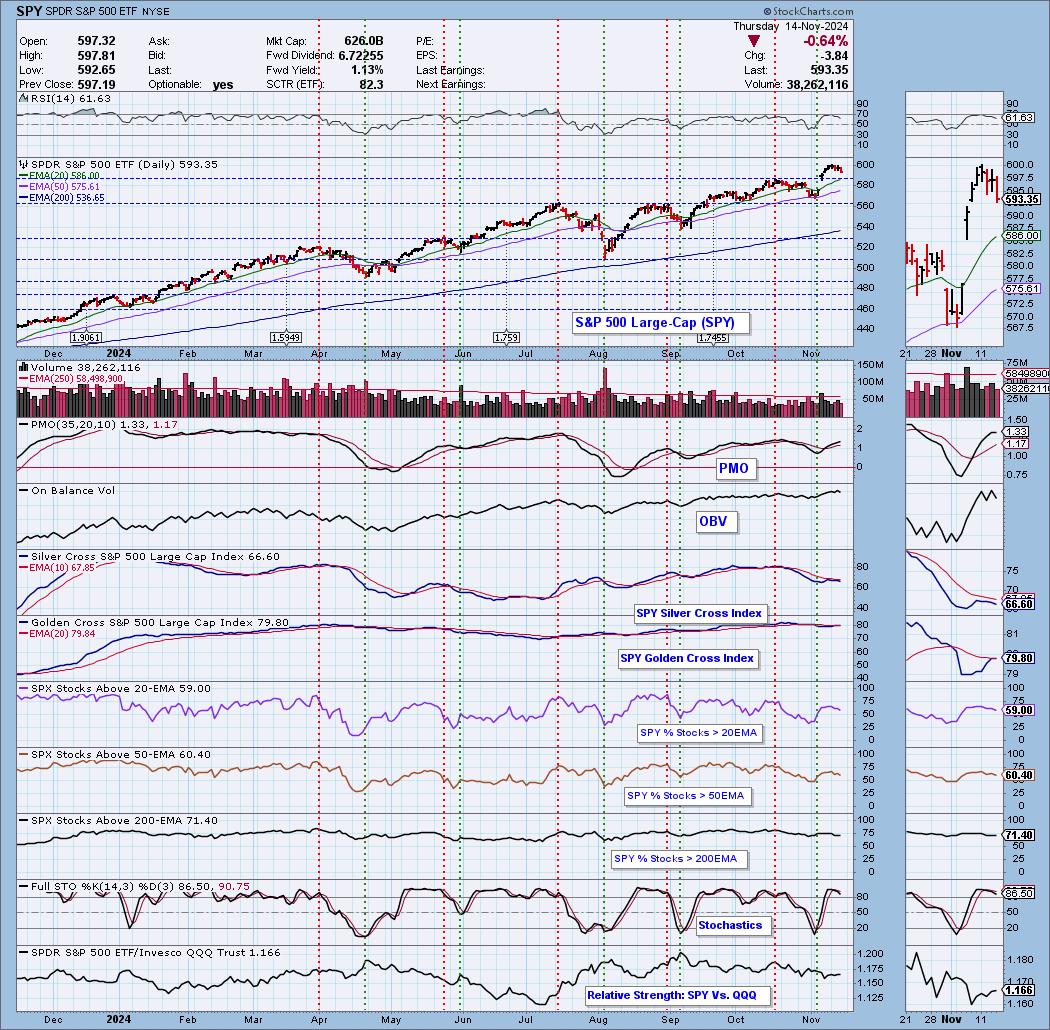
Market Environment: It is important to consider the odds for success by assessing the market tides. The following chart uses different methodologies for objectively showing the depth and trend of participation for intermediate- and long-term time frames.
- The Silver Cross Index (SCI) shows the percentage of SPX stocks on IT Trend Model BUY signals (20-EMA > 50-EMA)
- The Golden Cross Index (GCI) shows the percentage of SPX stocks on LT Trend Model BUY signals (50-EMA > 200-EMA)
Don't forget that as a "Diamonds" member, you have access to our "Under the Hood" curated ChartList on DecisionPoint.com. You'll find it under "Members Only" links on the left side on the Blogs and Links Page.
Here is the current chart:
Full Disclosure: I am 70% long, 0% short.
I'm required to disclose if I currently own a stock I mention and/or may buy/short it within the next 72 hours.
"Technical Analysis is a windsock, not a crystal ball." - Carl Swenlin
(c) Copyright 2024 DecisionPoint.com
Watch the latest episode of DecisionPoint Trading Room with Carl & Erin Swenlin Mondays on the DecisionPoint YouTube channel here!
NOTE: The stocks reported herein are from mechanical trading model scans that are based upon moving average relationships, momentum and volume. DecisionPoint analysis is then applied to get five selections from the scans. The selections given should prompt readers to do a chart review using their own analysis process. This letter is not a call for a specific action to buy, sell or short any of the stocks provided. There are NO sure things or guaranteed returns on the daily selection of "Diamonds in the Rough."
Regarding BUY/SELL Signals: The signal status reported herein is based upon mechanical trading model signals and crossovers. They define the implied bias of the price index/stock based upon moving average relationships and momentum, but they do not necessarily call for a specific action. They are information flags that should prompt chart review. Further, they do not call for continuous buying or selling during the life of the signal. For example, a BUY signal will probably (but not necessarily) return the best results if action is taken soon after the signal is generated. Additional opportunities for buying may be found as price zigzags higher, but the trader must look for optimum entry points. Conversely, exit points to preserve gains (or minimize losses) may be evident before the model mechanically closes the signal.
Helpful DecisionPoint Links:
Price Momentum Oscillator (PMO)
Swenlin Trading Oscillators (STO-B and STO-V)
For more links, go to DecisionPoint.com