
I had a few problems running my scans today. There was some sort of bug that returned results that shouldn't have been included. Fortunately, the Scan Alert System did return the proper results. There weren't many results. I had to open up the 'universe' I was scanning and dig into some older scans that I don't use unless I'm unhappy with primary scan results.
I was very close to including a short position today, but found four charts on the long side that I liked. Be very careful as we proceed from here. This could be the beginning of something dangerous so stops are a must. Exposure could be limited as well.
One of today's selections (LXFR), probably the one I like most, is from our Industry Group to Watch, Diversified Industrials. I included a Consumer Discretionary stock begrudgingly as this is a more aggressive area of the market, but the chart looked awfully good not to include (VFC).
The other two (MCK & MDLZ) come from defensive areas of the market (Healthcare & Food Products).
Good Luck & Good Trading,
Erin
Today's "Diamonds in the Rough": LXFR, MCK, MDLZ and VFC.
Runner-ups: MDU, HRL and HTBK.

Diamond Mine Trading Room:
RECORDING & DOWNLOAD LINK (8/30/2024):
Topic: DecisionPoint Diamond Mine (8/30/2024) LIVE Trading Room
Recording and Download LINK
Passcode: August#30
REGISTRATION for 9/6/2024:
When: September 6, 2024 09:00 AM Pacific Time (US and Canada)
Topic: DecisionPoint Diamond Mine LIVE Trading Room
Register in advance for this webinar HERE
After registering, you will receive a confirmation email containing information about joining the webinar.

Below is the latest free DecisionPoint Trading Room recording from 8/26 (No recording 9/2). You'll find these recordings posted on Mondays to our DP YouTube Channel. Be sure and subscribe HERE.
Welcome to DecisionPoint Diamonds, wherein I highlight ten "Diamonds in the Rough" per week. These are selected from the results of my DecisionPoint Scans which search for stocks that could benefit from the trend and condition of the market. Remember, these are not recommendations to buy or sell, but are the most interesting of the stocks that surfaced in my scans. My objective is to save you the work of the initial, tedious culling process, but you need to apply your own analysis to see if these stocks pique your interest as well. There are no guaranteed winners here!
"Predefined Scans Triggered" are taken from StockCharts.com using the "Symbol Summary" option instead of a "SharpChart" on the workbench.
Stop levels are all rounded down.
Luxfer Holdings plc (LXFR)
EARNINGS: 2024-10-29 (AMC)
Luxfer Holdings Plc is a global producer of engineered industrial materials, which engages in the design and manufacture of high-performance products for transportation, defense and emergency response, healthcare, and general industrial purposes. It operates through the following segments: Graphic Arts, Gas Cylinder, and Elektron. The Graphic Arts segment is involved in magnesium photo-engraving plates, engraving metals and etching chemicals. The Gas Cylinders segment manufactures and markets high-pressure aluminum and composite cylinders, systems, and accessories under the Luxfer Gas Cylinders and Superform brands. The Elektron segment focuses on specialty materials based on magnesium, zirconium, and rare earths. The company was founded in February 1996 and is headquartered in Milwaukee, the United Kingdom.
Predefined Scans Triggered: P&F Double Bottom Breakdown, P&F Bullish Signal Reversal and Moved Above Upper Price Channel.
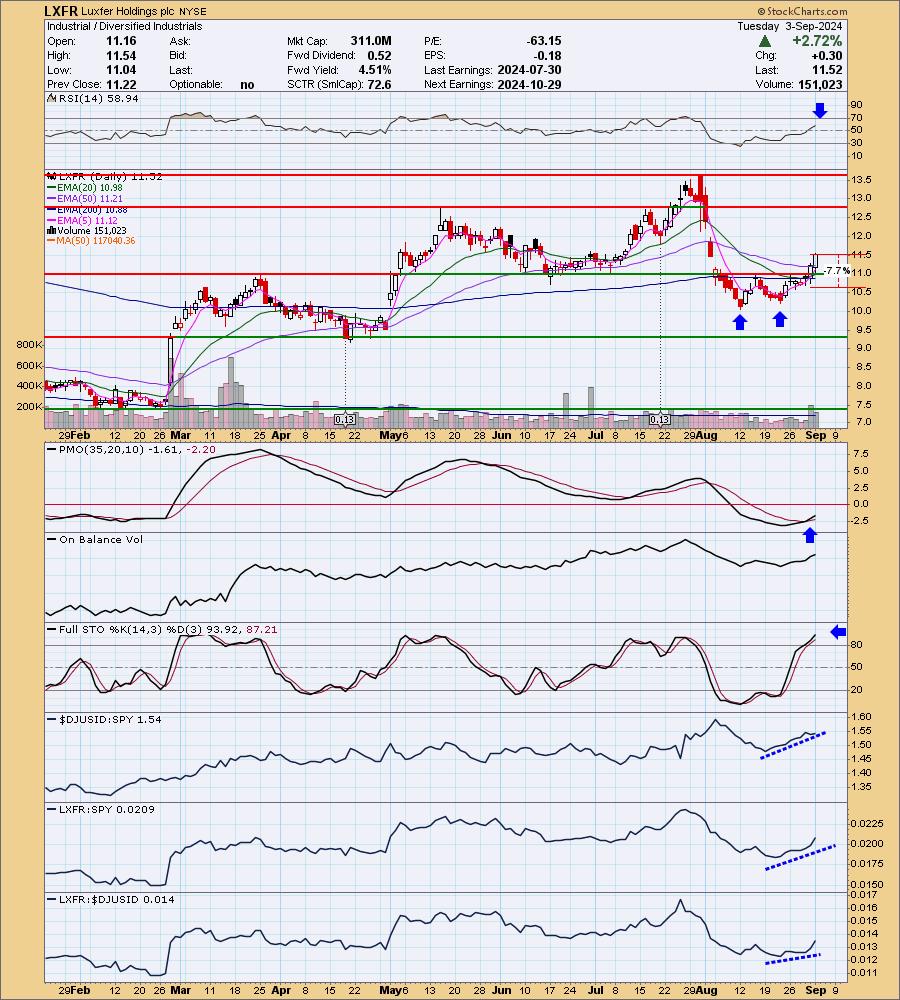
LXFR is down -0.04% in after hours trading. The bullish double bottom caught my attention. Technically it has just about reached its minimum upside target, but it is a "minimum" target. The rally is forceful and price has broken above all three key moving averages. The RSI is not overbought and the PMO is rising on a Crossover BUY Signal. Stochastics are well above 80 and relative strength is improving across the board. I've set the stop beneath support at 7.7% or $10.63.
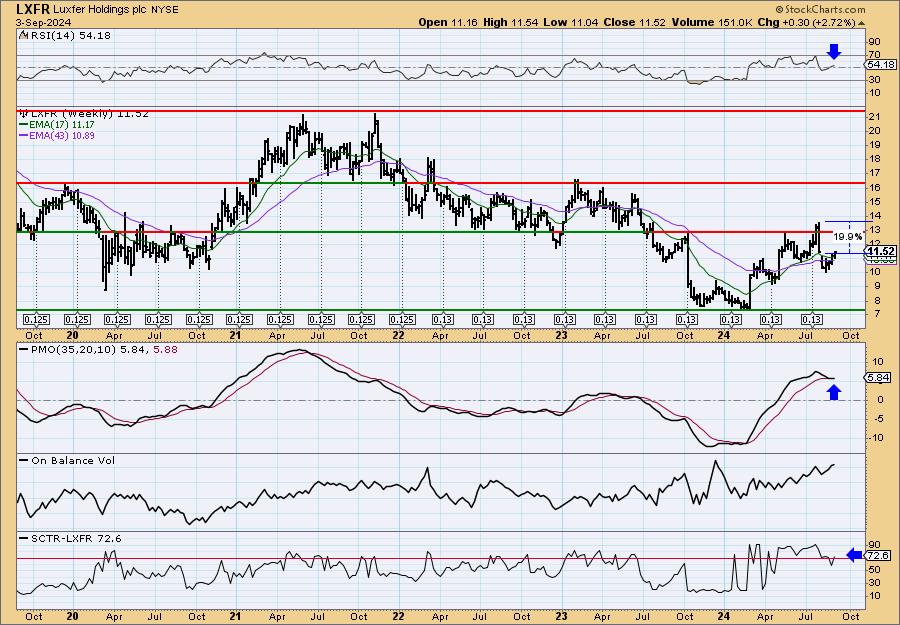
Price did break the rising trend out of the 2024 low, but it has recuperated quite a bit. The weekly RSI is back in positive territory. The weekly PMO is in the process of an upside reversal. The StockCharts Technical Rank (SCTR) just got back into the hot zone* above 70. If it can reach the prior high, it would be an almost 20% gain. (Full disclosure: I own LXFR.)
*If a stock is in the "hot zone" above 70, it implies that it is stronger than 70% of its universe (large-, mid-, small-caps and ETFs) primarily in the intermediate to long terms.
McKesson Corp. (MCK)
EARNINGS: 2024-11-06 (AMC)
McKesson Corp. engages in providing healthcare services. It operates through the following segments: U.S. Pharmaceutical, Prescription Technology Solutions (RxTS), Medical-Surgical Solutions, and International. The U.S. Pharmaceutical segment distributes branded, generic, specialty, biosimilar and over-the-counter pharmaceutical drugs. The RxTS segment offers prescription price transparency, benefit insight, dispensing support services, third-party logistics, and wholesale distribution. The Medical-Surgical Solutions segment provides medical-surgical supply distribution, logistics, and other services to healthcare providers. The International segment refers to the distribution and services to wholesale, institutional, and retail customers in Europe and Canada. The company was founded by John McKesson and Charles Olcott in 1833 and is headquartered in Irving, TX.
Predefined Scans Triggered: P&F Ascending Triple Top Breakout and P&F Double Top Breakout.
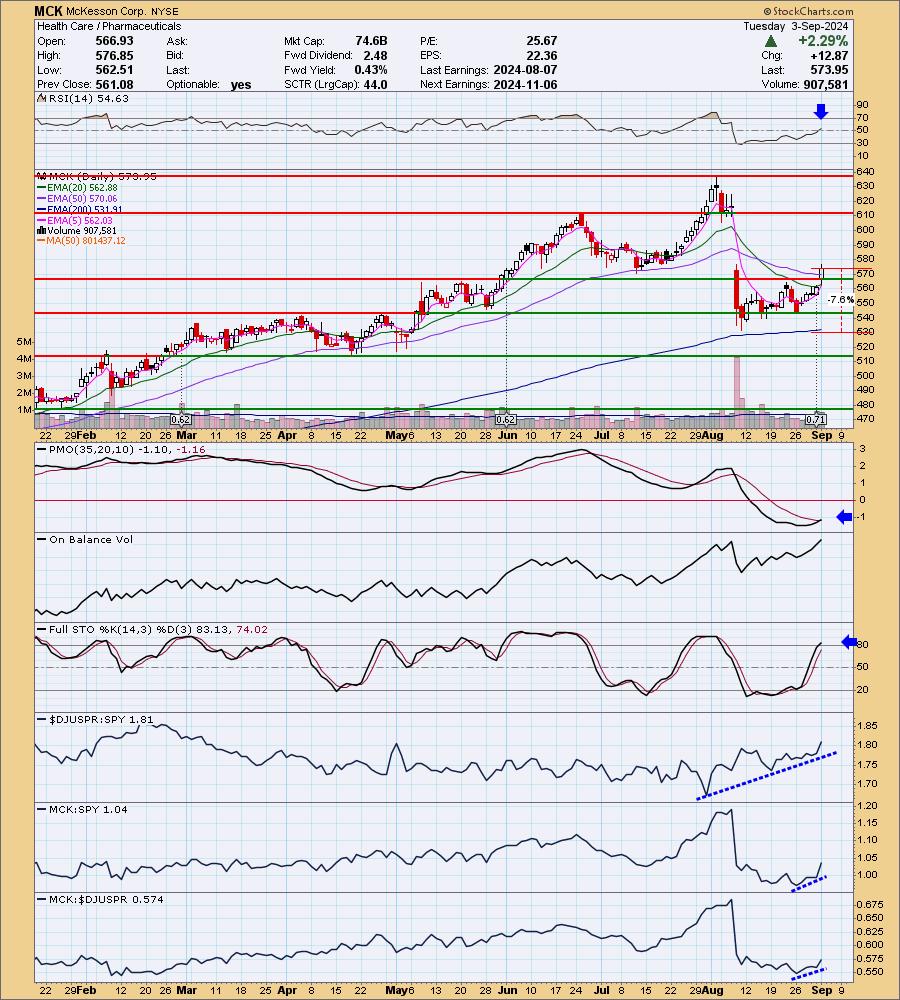
MCK is unchanged in after hours trading. Today saw a very nice breakout from a recent trading range. The RSI just hit positive territory. There is a new Crossover BUY Signal. Stochastics are rising above 80 and relative strength is picking up across the board. One issue may be gap resistance. It didn't quite overcome it, but the breakout above both the 20/50-day EMAs tell me we should see more follow through to the upside. The stop is set beneath the 200-day EMA at 7.6% or $530.33.
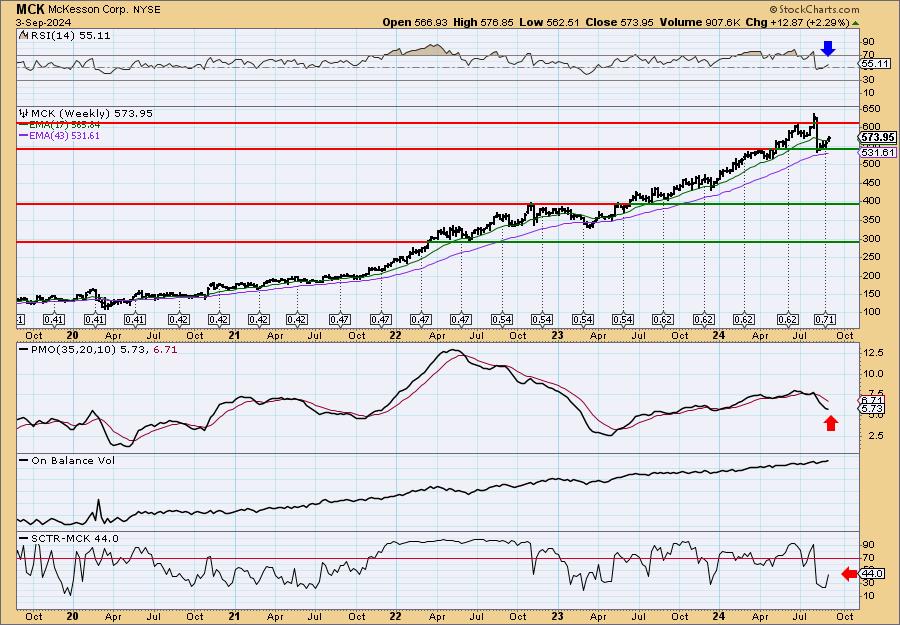
The weekly chart needs help, but I do like this reversal off support. The deep decline took out both the weekly RSI and weekly PMO. They are only now beginning to recover. The SCTR is rising, but is still outside the hot zone. Keep this one in the short term for now. Consider a 17% upside target to about $671.52.
Mondelez International, Inc. (MDLZ)
EARNINGS: 2024-10-30 (AMC)
Mondelez International, Inc. engages in the manufacture and marketing of snack food and beverage products. Its products include beverages, biscuits, chocolate, gum and candy, cheese and groceries, and meals. Its brands include 5Star, 7Days, Alpen Gold, Barni, Belvita, Bournvita, Cadbury, Cadbury Dairy Milk, Chips Ahoy! Clif, Clorets, Club Social, Côte d'Or, Daim, Enjoy Life Foods, Freia, Grenade, Halls, Honey Maid, Hu, Kinh Do, Lacta, Lu, Marabou, Maynards Bassett's, Mikado, Milka, Oreo, Perfect Snacks, Philadelphia, Prince, Ritz, Royal, Sour Patch Kids, Stride, Tang, Tate's Bake Shop, Tiger, Toblerone, Triscuit, TUC, and Wheat Thins. It operates through the following geographical segments: Latin America, Asia, Middle East, and Africa, Europe, and North America. The company was founded by James Lewis Kraft in 1903 is headquartered in Chicago, IL.
Predefined Scans Triggered: New CCI Buy Signals.
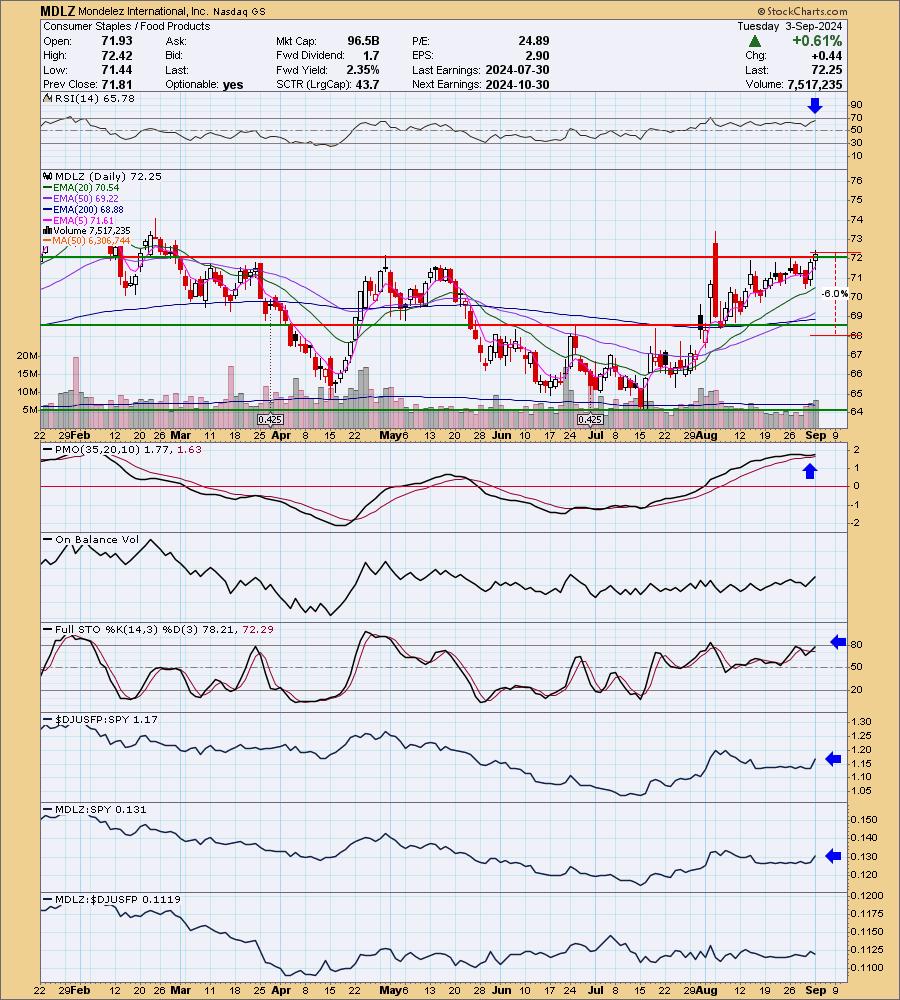
MDLZ is up +0.33% in after hours trading. I liked today's breakout that took price above the May tops. Today we saw a PMO Surge above the signal line. It is already reading at a strong level. The RSI is not overbought yet and can accommodate higher prices. Stochastics are almost above 80. It hasn't been a stellar performer, but it is seeing some slight improvement. I like this one primarily because it is in defensive Consumer Staples. The stop doesn't have to be set too deeply if you don't want to. I've opted to set it below support at 6% or $67.91.
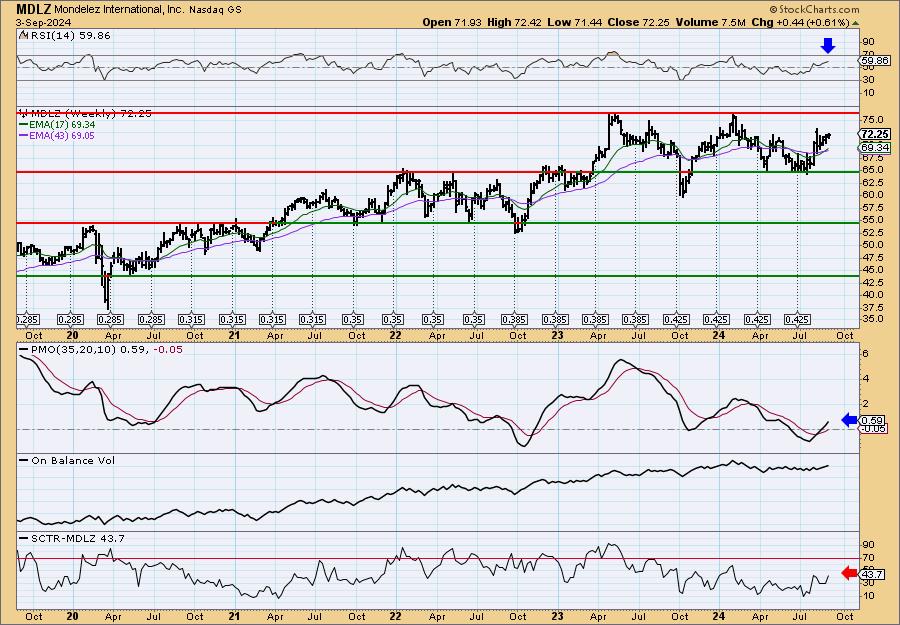
I'm not thrilled that it is stuck in a trading range, but the indicators sure look good for an upside breakout. The weekly RSI is positive and not overbought. The weekly PMO is rising in positive territory on a Crossover BUY Signal. The SCTR isn't what we want yet, but at least it isn't in the basement. Consider a 17% upside target to $84.53.
VFCorp (VFC)
EARNINGS: 2024-11-04 (AMC)
VF Corp. engages in the business of producing and marketing apparel, footwear, and accessories. It operates through the following segments: Outdoor, Active, Work, and Other. The Outdoor segment includes authentic outdoor-based lifestyle brands such as performance-based and outdoor apparel, footwear, and equipment. The Active segment focuses on activity-based lifestyle brands including active apparel, footwear, backpacks, luggage, and accessories. The Work segment offers work and work-inspired lifestyle brands with product offerings including apparel, footwear, and accessories. The Other segment refers to the sale of non-VF products and sourcing activities related to transition services. The company was founded by John Barbey in October 1899 and is headquartered in Denver, CO.
Predefined Scans Triggered: Moved Above Upper Bollinger Band, Stocks in a New Uptrend (Aroon), P&F Ascending Triple Top Breakout and P&F Double Top Breakout.
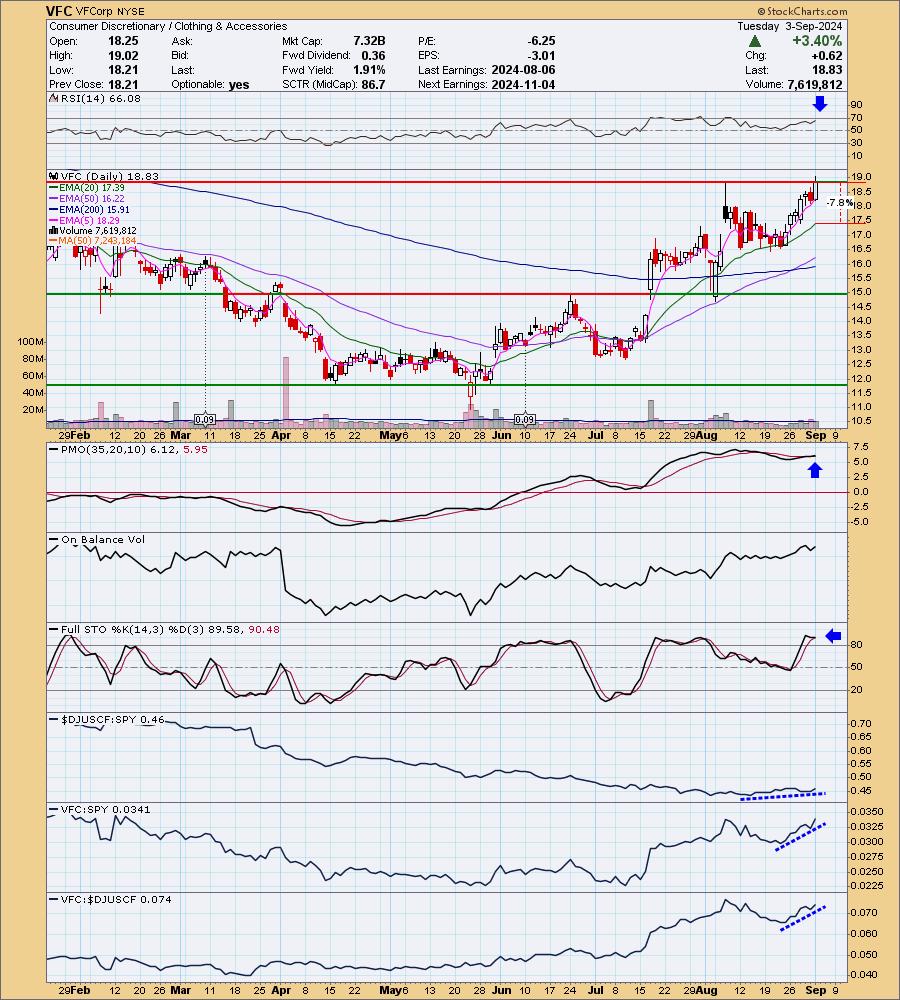
VFC is down -0.32% in after hours trading. We are seeing a breakout combined with strong indicators. The RSI is positive and not yet overbought. There is a PMO Crossover BUY Signal. Also note that the PMO is rather flat above the zero line suggesting pure strength. Stochastics are rising again above 80. Relative strength for the group is mediocre, but VFC is outperforming the SPY easily. It also happens to be outperforming the industry group as well. I've set the stop near the 20-day EMA at 7.8% or $17.36.
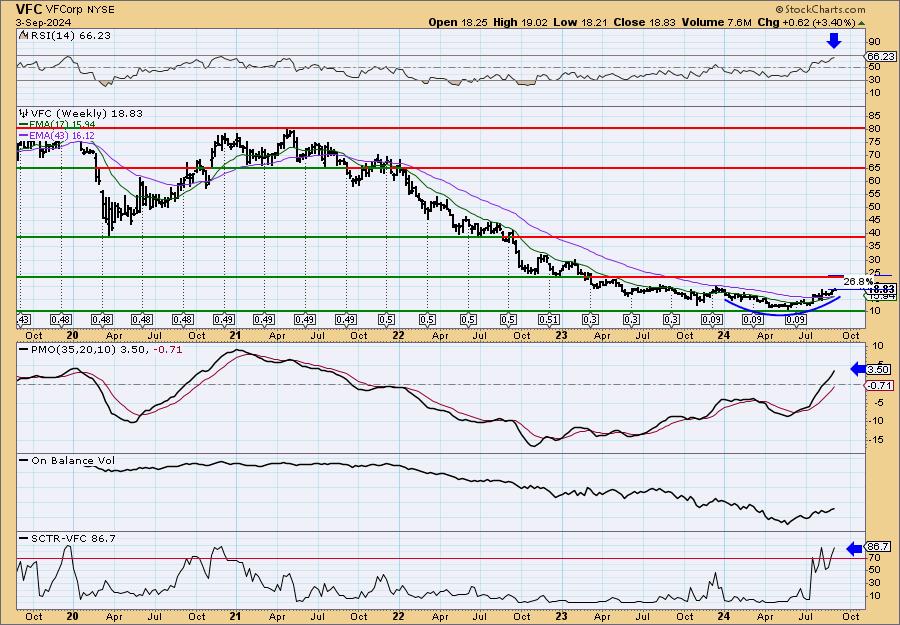
This is a beat down stock, but we are starting to see a rounded or saucer shaped bottom which implies more upside. The weekly RSI is positive and the weekly PMO is on the rise. The SCTR is at the top of the hot zone. Even if it just made it to the top of the current trading range, it would be an over 25% gain.
Don't forget, on Thursdays I look at reader-requested symbols, click HERE to send me an email. I read every email I receive and try to answer them all!
Current Market Outlook:
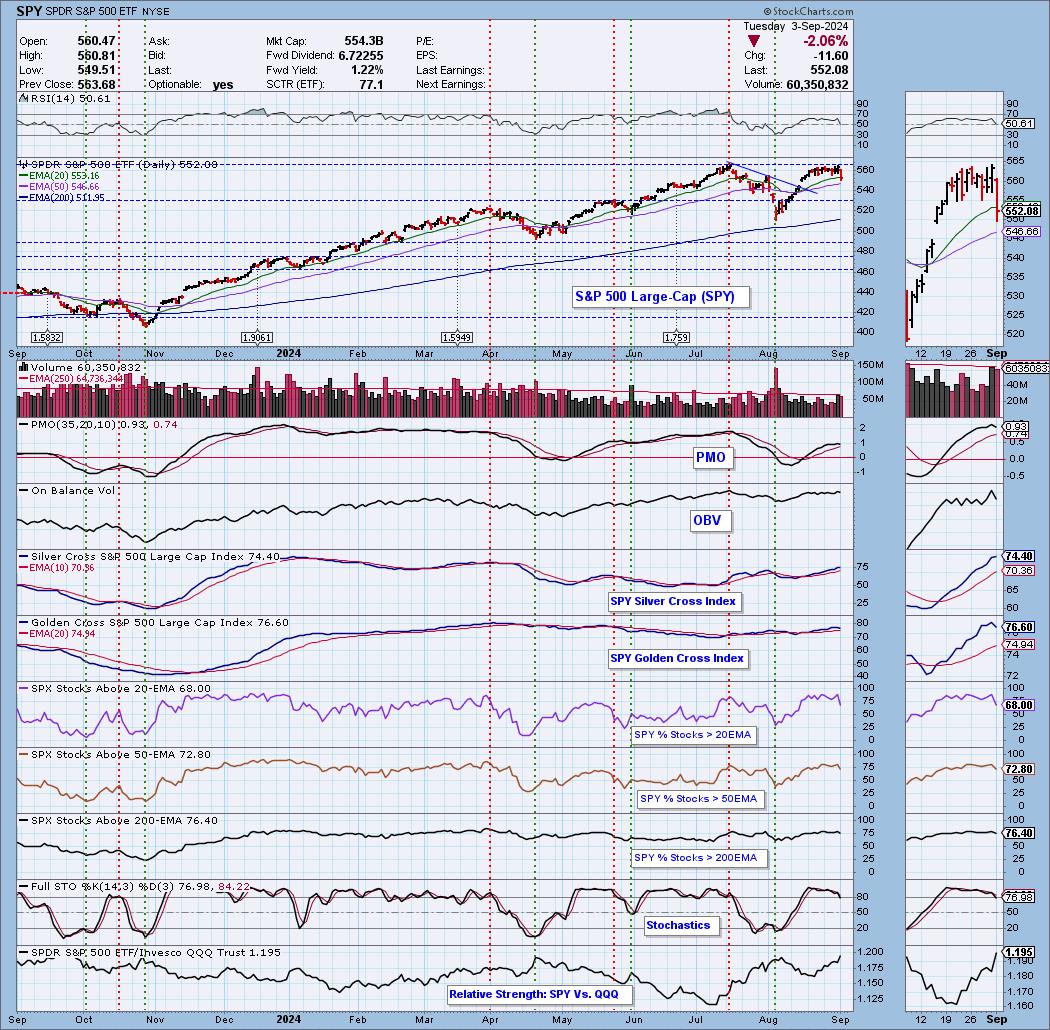
Market Environment: It is important to consider the odds for success by assessing the market tides. The following chart uses different methodologies for objectively showing the depth and trend of participation for intermediate- and long-term time frames.
- The Silver Cross Index (SCI) shows the percentage of SPX stocks on IT Trend Model BUY signals (20-EMA > 50-EMA)
- The Golden Cross Index (GCI) shows the percentage of SPX stocks on LT Trend Model BUY signals (50-EMA > 200-EMA)
Don't forget that as a "Diamonds" member, you have access to our "Under the Hood" curated ChartList on DecisionPoint.com. You'll find it under "Members Only" links on the left side on the Blogs and Links Page.
Here is the current chart:
Full Disclosure: I am 40% long, 0% short. I own LXFR.
I'm required to disclose if I currently own a stock I mention and/or may buy/short it within the next 72 hours.
"Technical Analysis is a windsock, not a crystal ball." - Carl Swenlin
(c) Copyright 2024 DecisionPoint.com
Watch the latest episode of DecisionPoint Trading Room with Carl & Erin Swenlin Mondays on the DecisionPoint YouTube channel here!
NOTE: The stocks reported herein are from mechanical trading model scans that are based upon moving average relationships, momentum and volume. DecisionPoint analysis is then applied to get five selections from the scans. The selections given should prompt readers to do a chart review using their own analysis process. This letter is not a call for a specific action to buy, sell or short any of the stocks provided. There are NO sure things or guaranteed returns on the daily selection of "Diamonds in the Rough."
Regarding BUY/SELL Signals: The signal status reported herein is based upon mechanical trading model signals and crossovers. They define the implied bias of the price index/stock based upon moving average relationships and momentum, but they do not necessarily call for a specific action. They are information flags that should prompt chart review. Further, they do not call for continuous buying or selling during the life of the signal. For example, a BUY signal will probably (but not necessarily) return the best results if action is taken soon after the signal is generated. Additional opportunities for buying may be found as price zigzags higher, but the trader must look for optimum entry points. Conversely, exit points to preserve gains (or minimize losses) may be evident before the model mechanically closes the signal.
Helpful DecisionPoint Links:
Price Momentum Oscillator (PMO)
Swenlin Trading Oscillators (STO-B and STO-V)
For more links, go to DecisionPoint.com