
The market may be hitting a snag as it pushes up against resistance at all-time highs, but the scans were plentiful today offering me plenty of choices. I whittled down my list and still had too many to look at so I whittled it down again to get today's list of runner-ups.
Two of today's selections I picked based on upside potential before reaching strong overhead resistance (BLD and IBP). American Express (AXP) was a pick as I do see financial stocks popping into the scan results right now. Finally, the last pick was one of the stocks I picked up from the scans we ran during Friday's trading room (VVV).
Good Luck & Good Trading,
Erin
Today's "Diamonds in the Rough": AXP, BLD, IBP and VVV.
Runner-ups: HAS, JEF, TRN, EAT, CBT, MTZ and SKX.

Diamond Mine Trading Room:
RECORDING & DOWNLOAD LINK (9/13/2024):
Topic: DecisionPoint Diamond Mine (9/13/2024) LIVE Trading Room
Recording & Download LINK
Passcode: September#13
REGISTRATION for 9/20/2024:
When: September 20, 2024 09:00 AM Pacific Time (US and Canada)
Topic: DecisionPoint Diamond Mine LIVE Trading Room
Register in advance for this webinar HERE
After registering, you will receive a confirmation email containing information about joining the webinar.

Below is the latest free DecisionPoint Trading Room recording from 9/16. You'll find these recordings posted on Mondays to our DP YouTube Channel. Be sure and subscribe HERE.
Welcome to DecisionPoint Diamonds, wherein I highlight ten "Diamonds in the Rough" per week. These are selected from the results of my DecisionPoint Scans which search for stocks that could benefit from the trend and condition of the market. Remember, these are not recommendations to buy or sell, but are the most interesting of the stocks that surfaced in my scans. My objective is to save you the work of the initial, tedious culling process, but you need to apply your own analysis to see if these stocks pique your interest as well. There are no guaranteed winners here!
"Predefined Scans Triggered" are taken from StockCharts.com using the "Symbol Summary" option instead of a "SharpChart" on the workbench.
Stop levels are all rounded down.
American Express Co. (AXP)
EARNINGS: 2024-10-18 (BMO)
American Express Co. is an integrated payments company, which engages in the provision of credit and charge cards to consumers, small businesses, mid-sized companies, and large corporations. It operates through the following segments: the United States Consumer Services (USCS), Commercial Services (CS), International Card Services (ICS), Global Merchant and Network Services (GMNS), and Corporate and Other. The USCS segment includes proprietary consumer cards and provides services to consumers including travel and lifestyle services as well as banking and non-card financing products. The CS segment offers proprietary corporate and small business cards and provides services to businesses including payment and expense management, banking, and non-card financing products. The ICS segment focuses on providing services to international customers including travel and lifestyle services and managing certain international joint ventures and loyalty coalition businesses. The GMNS segment is involved in operating a global payments network that processes and settles card transactions, acquires merchants, and provides multi-channel marketing programs and capabilities, services and data analytics. The Corporate and Other segment covers corporate functions and certain other businesses and operations. The company was founded by Henry Wells, William G. Fargo, and John Warren Butterfield on March 28, 1850 and is headquartered in New York, NY.
Predefined Scans Triggered: Moved Above Upper Bollinger Band, Moved Above Upper Price Channel, P&F Double Top Breakout and New 52-week Highs.
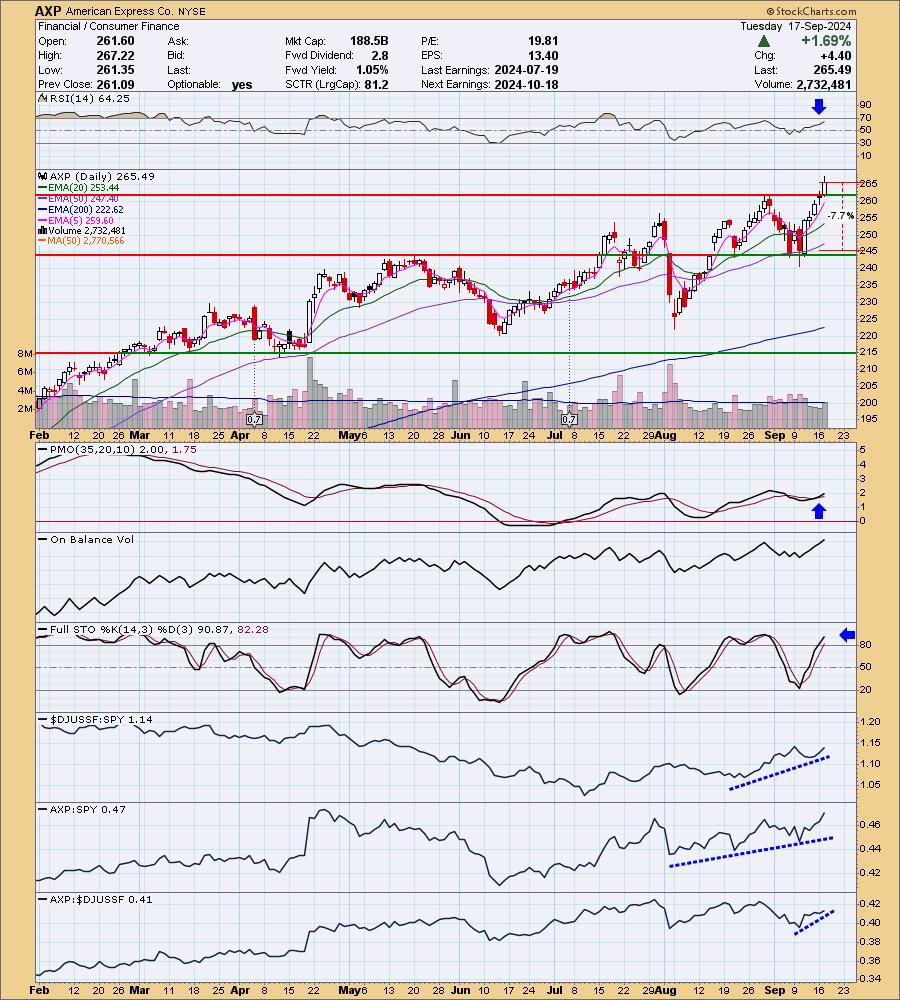
AXP is down -0.04% in after hours trading. I loved today's breakout and move to new 52-week highs. It looks primed for more follow through, but may pause after breaking out. The RSI is not overbought and the PMO is rising on a Crossover BUY Signal above the zero line. Stochastics are now above 80 and relative strength is improving across the board. It is doing particularly well against the SPY right now. The stop is set as close to support as possible at 7.7% or $245.04.
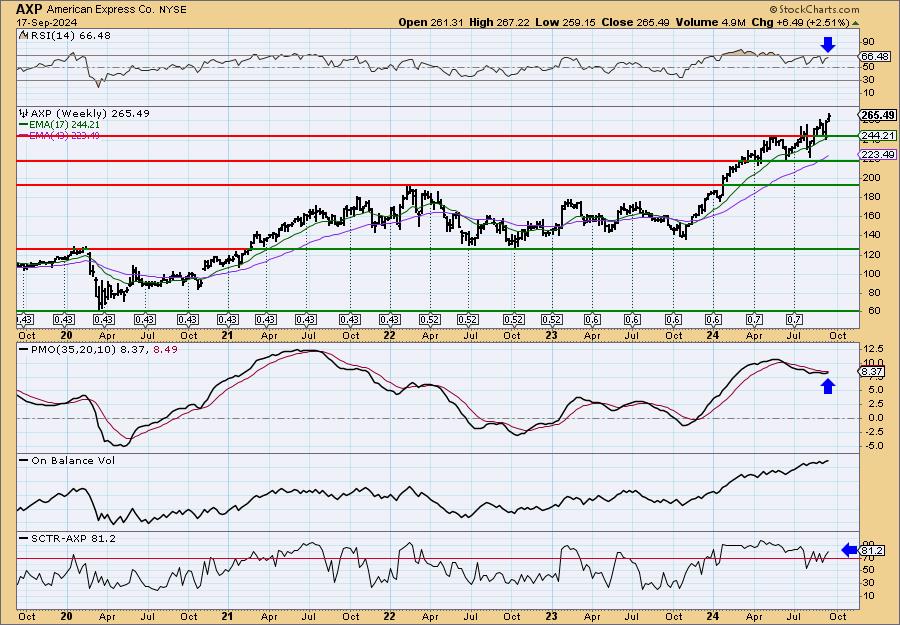
This looks great for the intermediate term as well given the strong weekly chart. Price is in a strong rising trend and breaking to new all-time highs. The weekly RSI is positive and not overbought. The weekly PMO has turned back up well above the zero line. The StockCharts Technical Rank (SCTR) is in the hot zone* above 70. Consider a 17% upside target to about $310.62.
*If a stock is in the "hot zone" above 70, it implies that it is stronger than 70% of its universe (large-, mid-, small-caps and ETFs) primarily in the intermediate to long terms.
TopBuild Corp. (BLD)
EARNINGS: 2024-10-29 (BMO)
TopBuild Corp. engages in the installation and distribution of insulation products and other building products to the U.S. and Canadian construction industry. It operates through the following segments: Installation, Specialty Distribution, and Corporate. The Installation segment provides insulation installation services nationwide through its TruTeam contractor services and business branches located in the U.S. The Specialty Distribution segment distributes insulation and other building products, including rain gutters, fireplaces, closet shelving, and roofing materials through its service partners business. The company was founded in February 2015 and is headquartered in Daytona Beach, FL.
Predefined Scans Triggered: P&F Double Top Breakout.
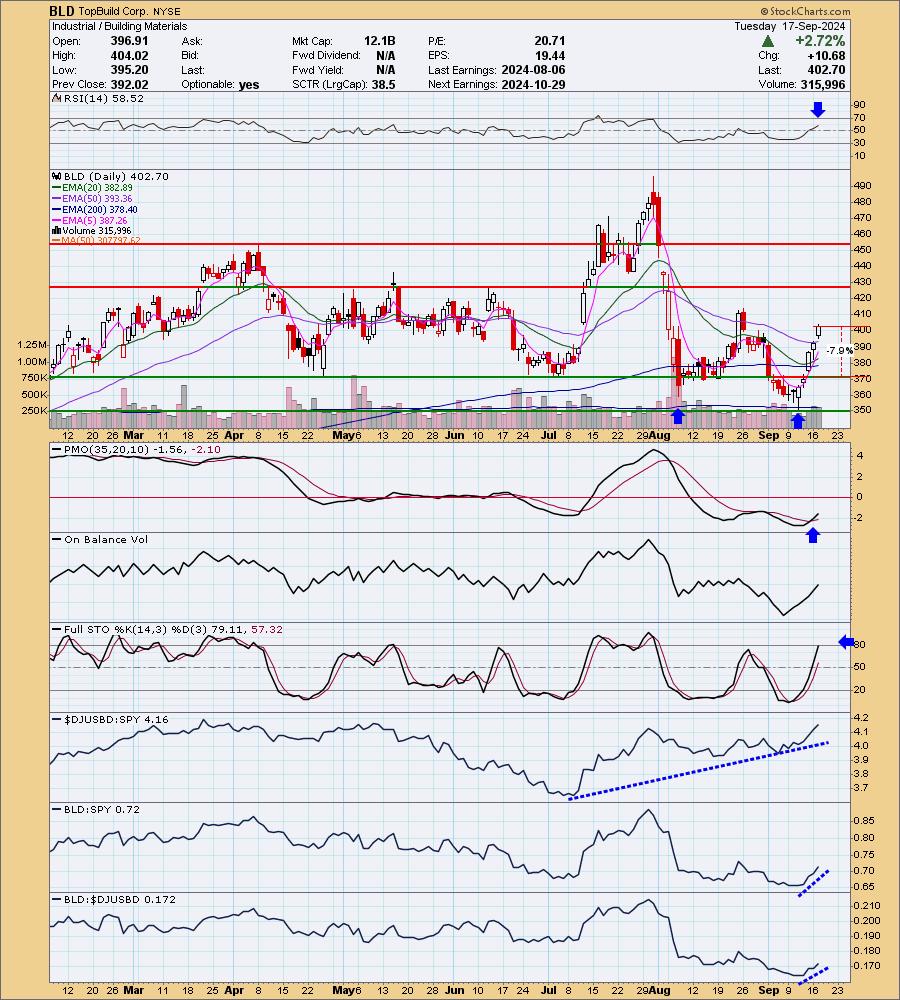
BLD is up +3.25% in after hours trading so we may be onto something here. We have a large bullish double bottom pattern that will be confirmed with a breakout above the August top. Price has seen a strong upside reversal, but it may need to take a breather soon. The RSI is not overbought despite this forceful rally. The PMO is rising on a Crossover BUY Signal. Volume is definitely coming in. Stochastics are nearly above 80. The group is seeing excellent relative strength and BLD is seeing new relative strength. The stop is set beneath support at 7.9% or $370.88.
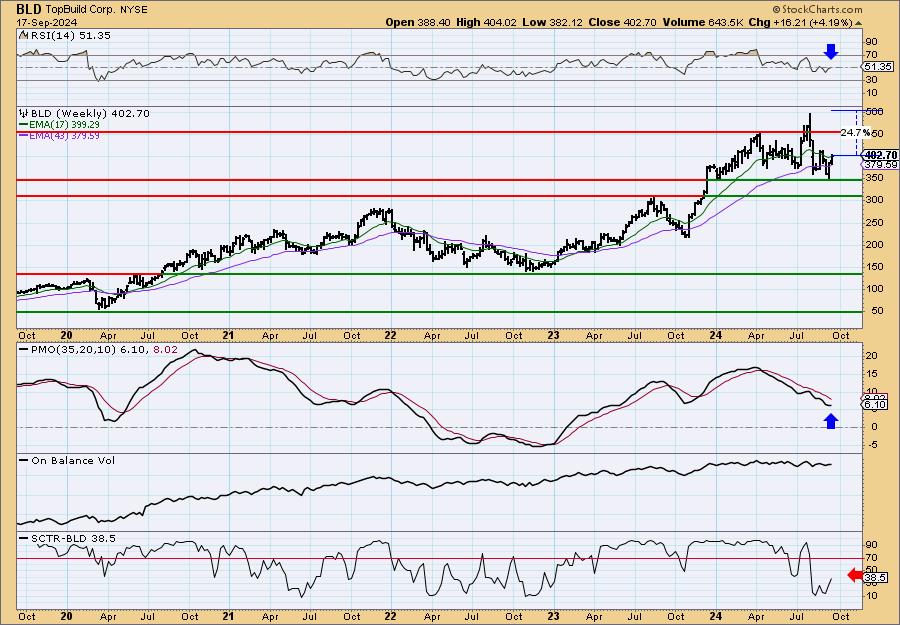
I'm not a fan of the weekly chart as price is basically in a declining trend, but it isn't that bad because support is holding. The weekly RSI did just get into positive territory and the weekly PMO is turning up. The SCTR still needs some help to get up to the hot zone. We have excellent upside potential if it can keep this rally going.
Installed Building Products Inc. (IBP)
EARNINGS: 2024-11-11 (BMO)
Installed Building Products, Inc. engages in the business of installing insulation for the residential new construction market. Its products include garage doors, rain gutters, shower doors, closet shelving, and mirrors. The company was founded in 1977 and is headquartered in Columbus, OH.
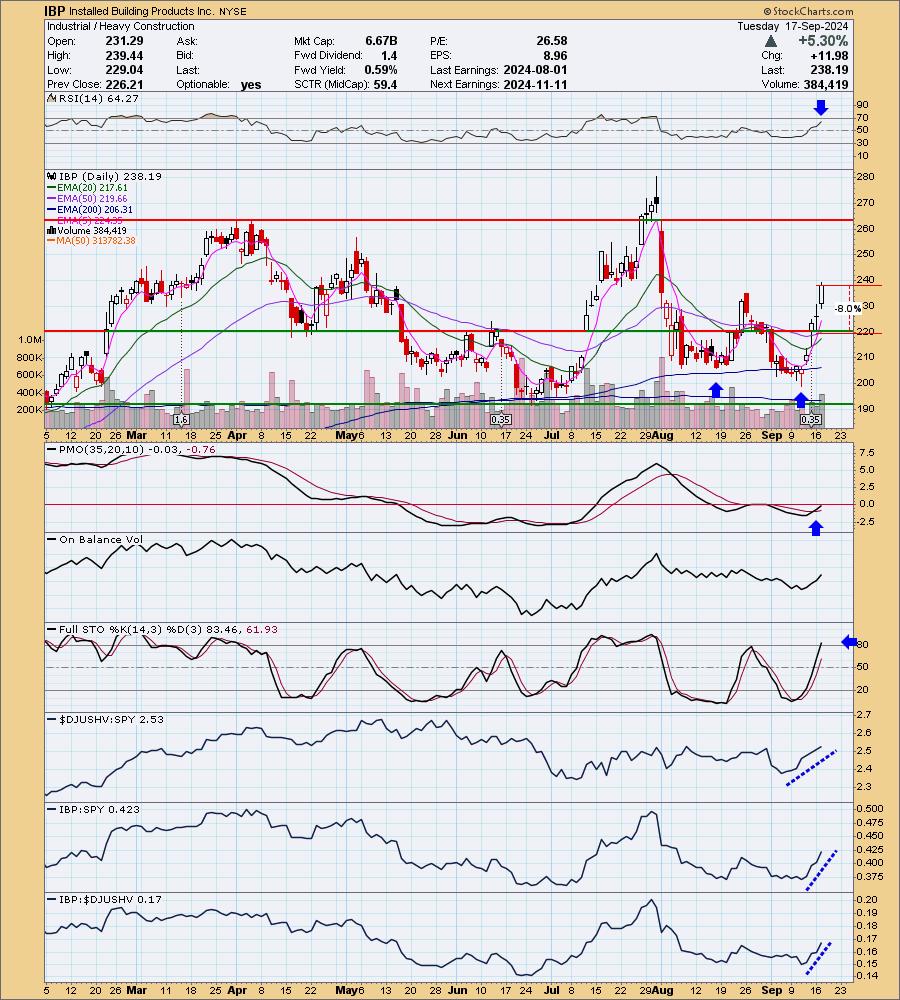
Predefined Scans Triggered: Moved Above Upper Bollinger Band, Moved Above Upper Price Channel, New CCI Buy Signals, Entered Ichimoku Cloud, P&F Double Top Breakout and Moved Above Upper Keltner Channel.
IBP is down -0.02% in after hours trading. We have a very strong rally going on that helped form a bullish double bottom pattern. The pattern implies that we could see a breakout to the July top. Poor earnings performance had it hitting the skids but it is slowly covering the losses. The RSI is positive and not overbought despite this lengthy rally. The PMO is rising on a Crossover BUY Signal and Stochastics just moved above 80. Relative strength is excellent across the board. The stop is set beneath support at 8% or $219.13.
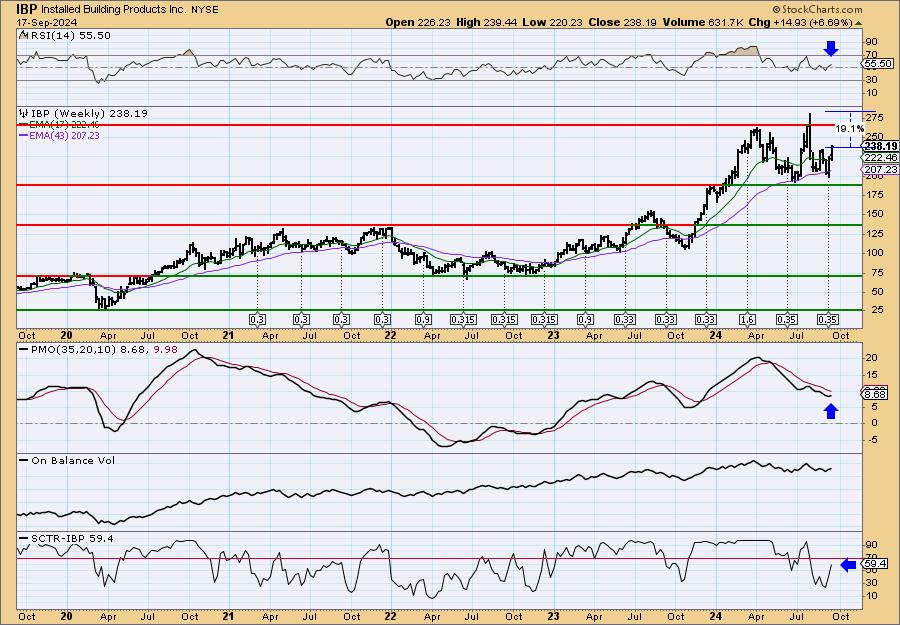
This is a mediocre weekly chart so keep it in the short-term timeframe for now. Price is in a high level consolidation digesting the rally from earlier in the year. The weekly RSI is back in positive territory. The weekly PMO has turned up and the SCTR is nearing the hot zone. Upside potential is quite good if it can recapture those highs.
Valvoline Inc. (VVV)
EARNINGS: 2024-11-07 (BMO)
Valvoline, Inc. engages in the production, marketing, and supply of engine and automotive maintenance products and services. It operates through the Retail Services segment. The Retail Services segment services the passenger car and light truck quick lube market in the US and Canada with preventive maintenance services done through company operated and independent franchise care stores. The company was founded by John Ellis in 1866 and is headquartered in Lexington, KY.
Predefined Scans Triggered: None.
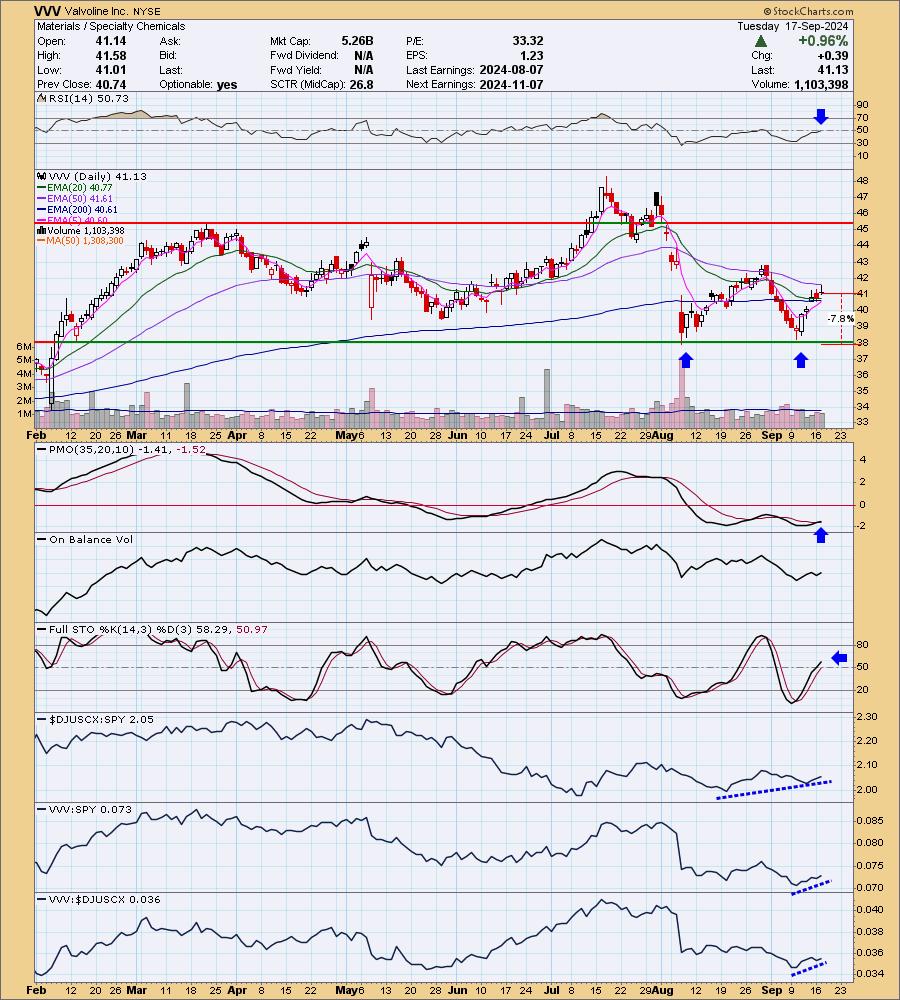
VVV is unchanged in after hours trading. As with the other charts above, we have a nice bullish double bottom building. Price is back above the 200-day EMA. It had trouble at the 50-day EMA last time, but I think we'll get a breakout this time. The RSI just moved into positive territory. The PMO is on a new Crossover BUY Signal and we have Stochastics rising in positive territory. The group has been outperforming for some time and now we see VVV beginning to outperform too. The stop is set beneath support at 7.8% or $37.92.
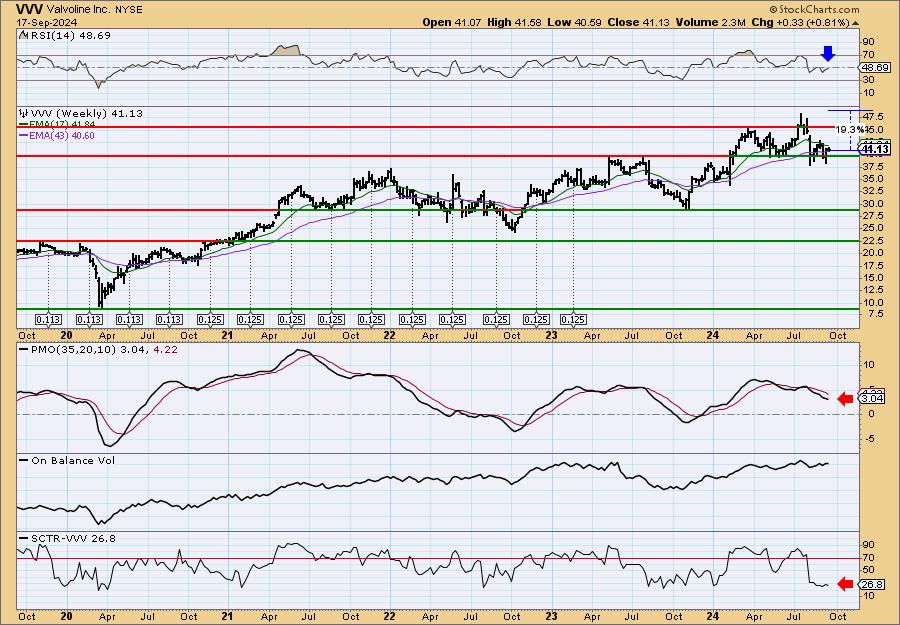
This is another so-so weekly chart as price is in consolidation mode and barely holding above support. The weekly RSI is nearly in positive territory, but we have a weekly PMO still in decline and a low SCTR value. If it can reach the prior highs it would be an excellent gain.
Don't forget, on Thursdays I look at reader-requested symbols, click HERE to send me an email. I read every email I receive and try to answer them all!
Current Market Outlook:
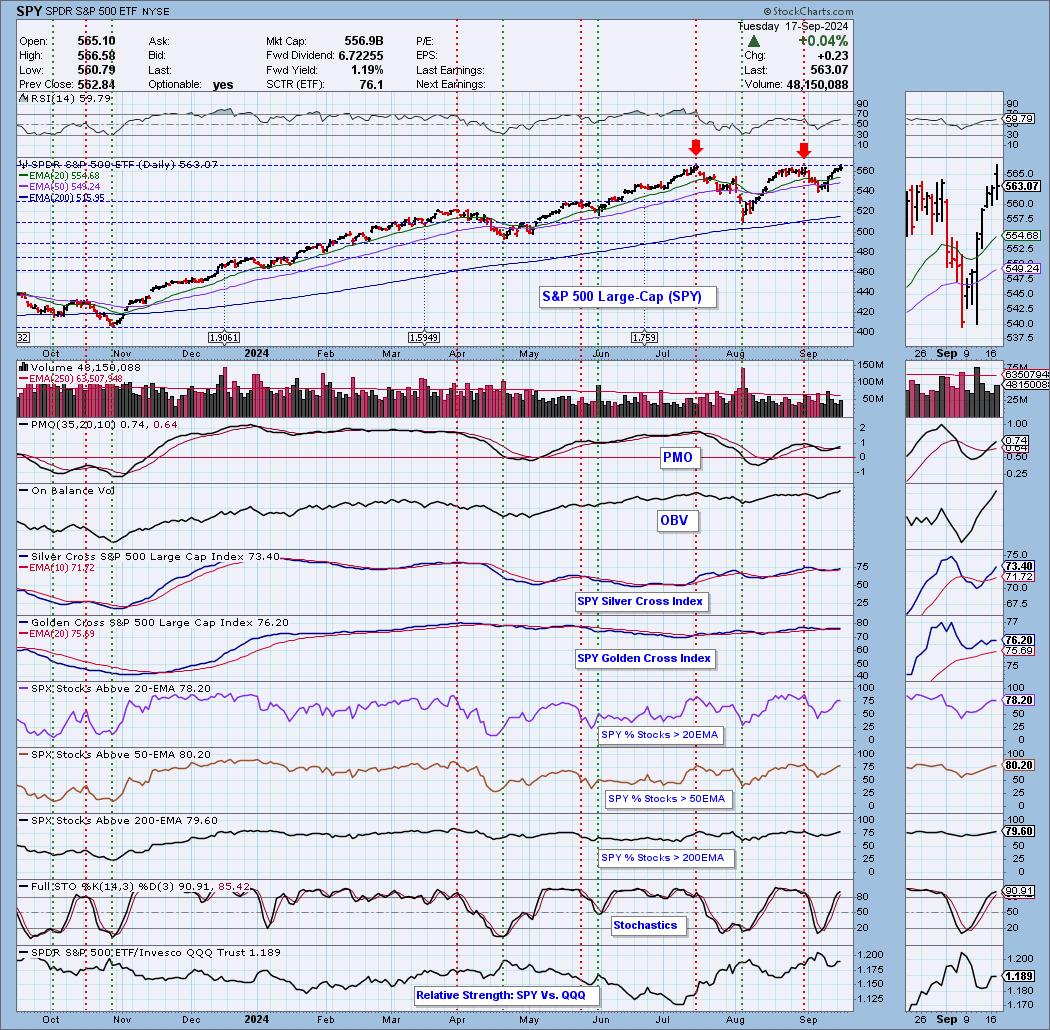
Market Environment: It is important to consider the odds for success by assessing the market tides. The following chart uses different methodologies for objectively showing the depth and trend of participation for intermediate- and long-term time frames.
- The Silver Cross Index (SCI) shows the percentage of SPX stocks on IT Trend Model BUY signals (20-EMA > 50-EMA)
- The Golden Cross Index (GCI) shows the percentage of SPX stocks on LT Trend Model BUY signals (50-EMA > 200-EMA)
Don't forget that as a "Diamonds" member, you have access to our "Under the Hood" curated ChartList on DecisionPoint.com. You'll find it under "Members Only" links on the left side on the Blogs and Links Page.
Here is the current chart:
Full Disclosure: I am 30% long, 0% short. I'm considering all four for an add, not sure which ones yet.
I'm required to disclose if I currently own a stock I mention and/or may buy/short it within the next 72 hours.
"Technical Analysis is a windsock, not a crystal ball." - Carl Swenlin
(c) Copyright 2024 DecisionPoint.com
Watch the latest episode of DecisionPoint Trading Room with Carl & Erin Swenlin Mondays on the DecisionPoint YouTube channel here!
NOTE: The stocks reported herein are from mechanical trading model scans that are based upon moving average relationships, momentum and volume. DecisionPoint analysis is then applied to get five selections from the scans. The selections given should prompt readers to do a chart review using their own analysis process. This letter is not a call for a specific action to buy, sell or short any of the stocks provided. There are NO sure things or guaranteed returns on the daily selection of "Diamonds in the Rough."
Regarding BUY/SELL Signals: The signal status reported herein is based upon mechanical trading model signals and crossovers. They define the implied bias of the price index/stock based upon moving average relationships and momentum, but they do not necessarily call for a specific action. They are information flags that should prompt chart review. Further, they do not call for continuous buying or selling during the life of the signal. For example, a BUY signal will probably (but not necessarily) return the best results if action is taken soon after the signal is generated. Additional opportunities for buying may be found as price zigzags higher, but the trader must look for optimum entry points. Conversely, exit points to preserve gains (or minimize losses) may be evident before the model mechanically closes the signal.
Helpful DecisionPoint Links:
Price Momentum Oscillator (PMO)
Swenlin Trading Oscillators (STO-B and STO-V)
For more links, go to DecisionPoint.com