
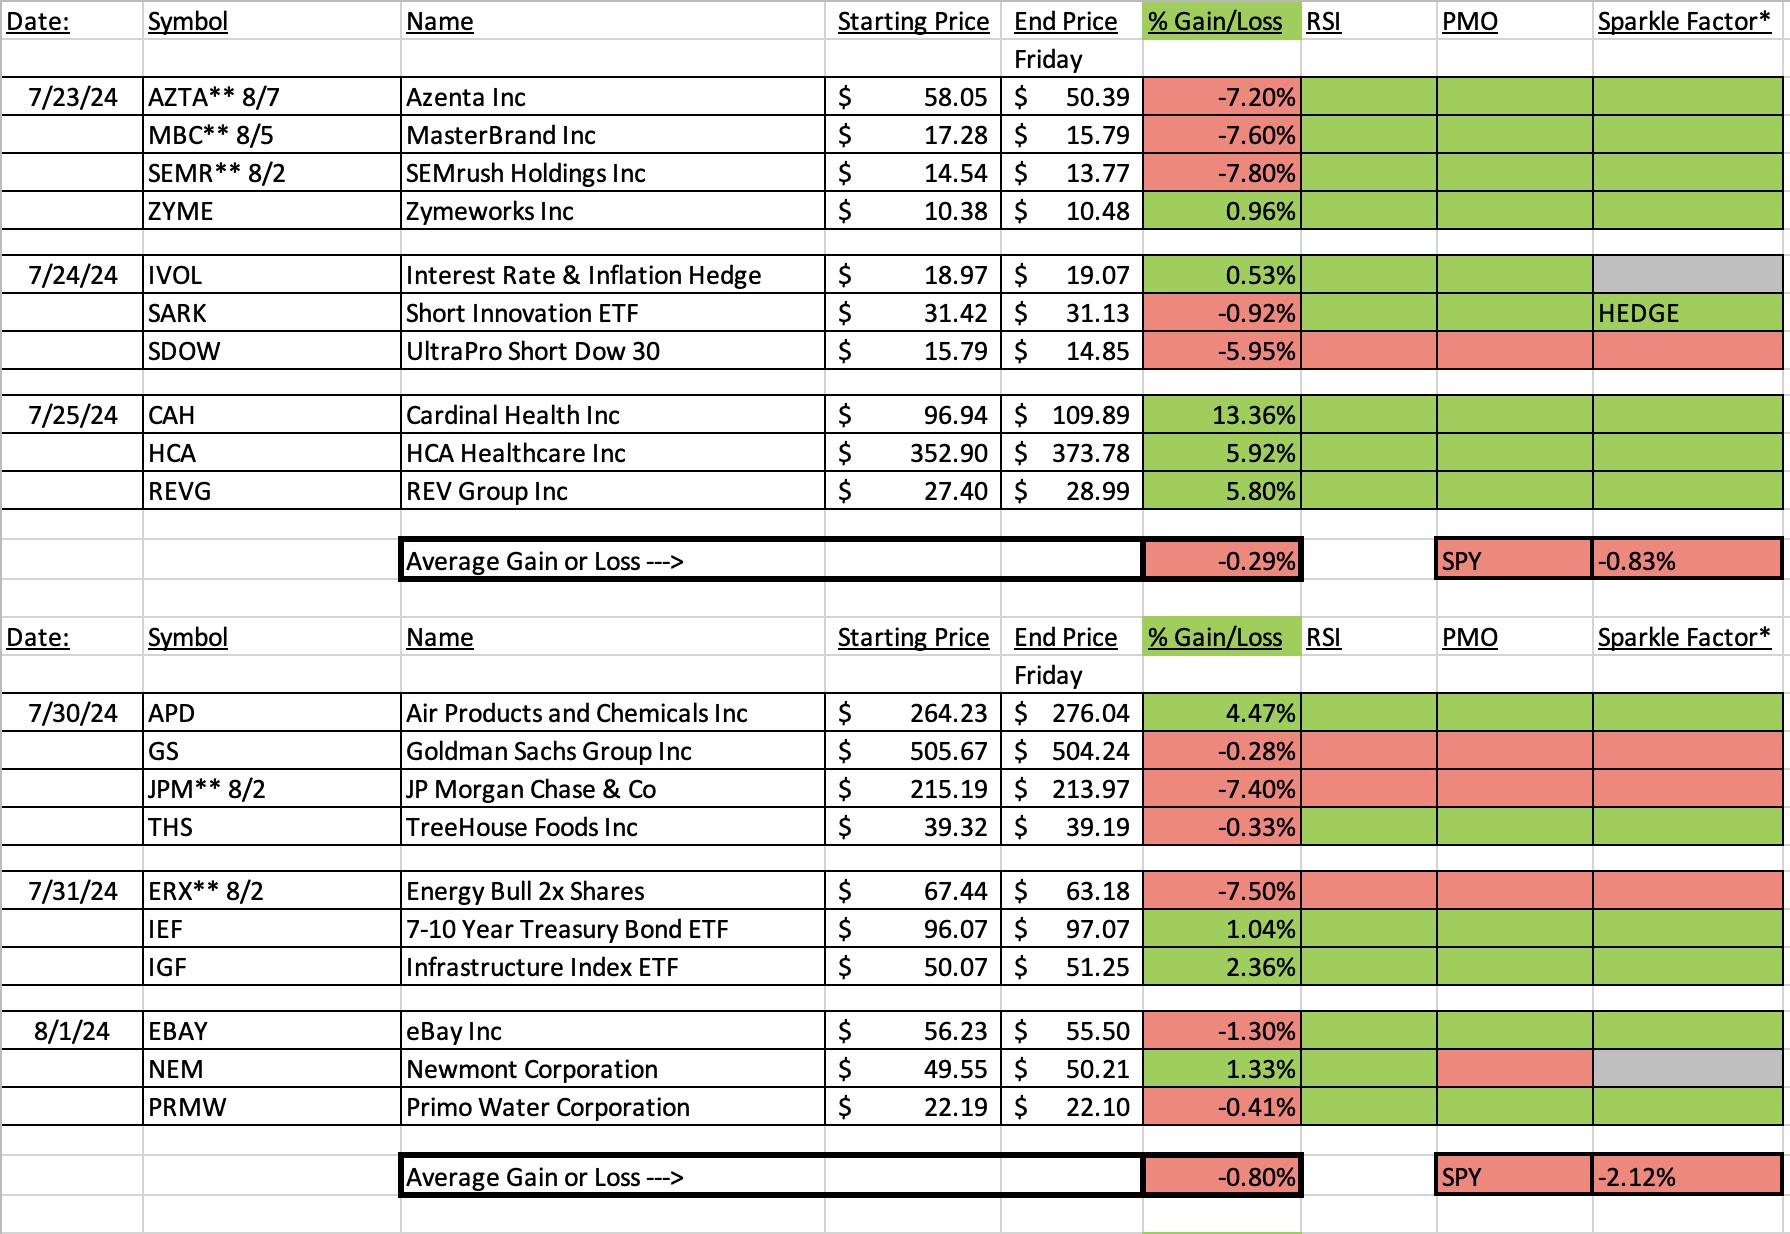
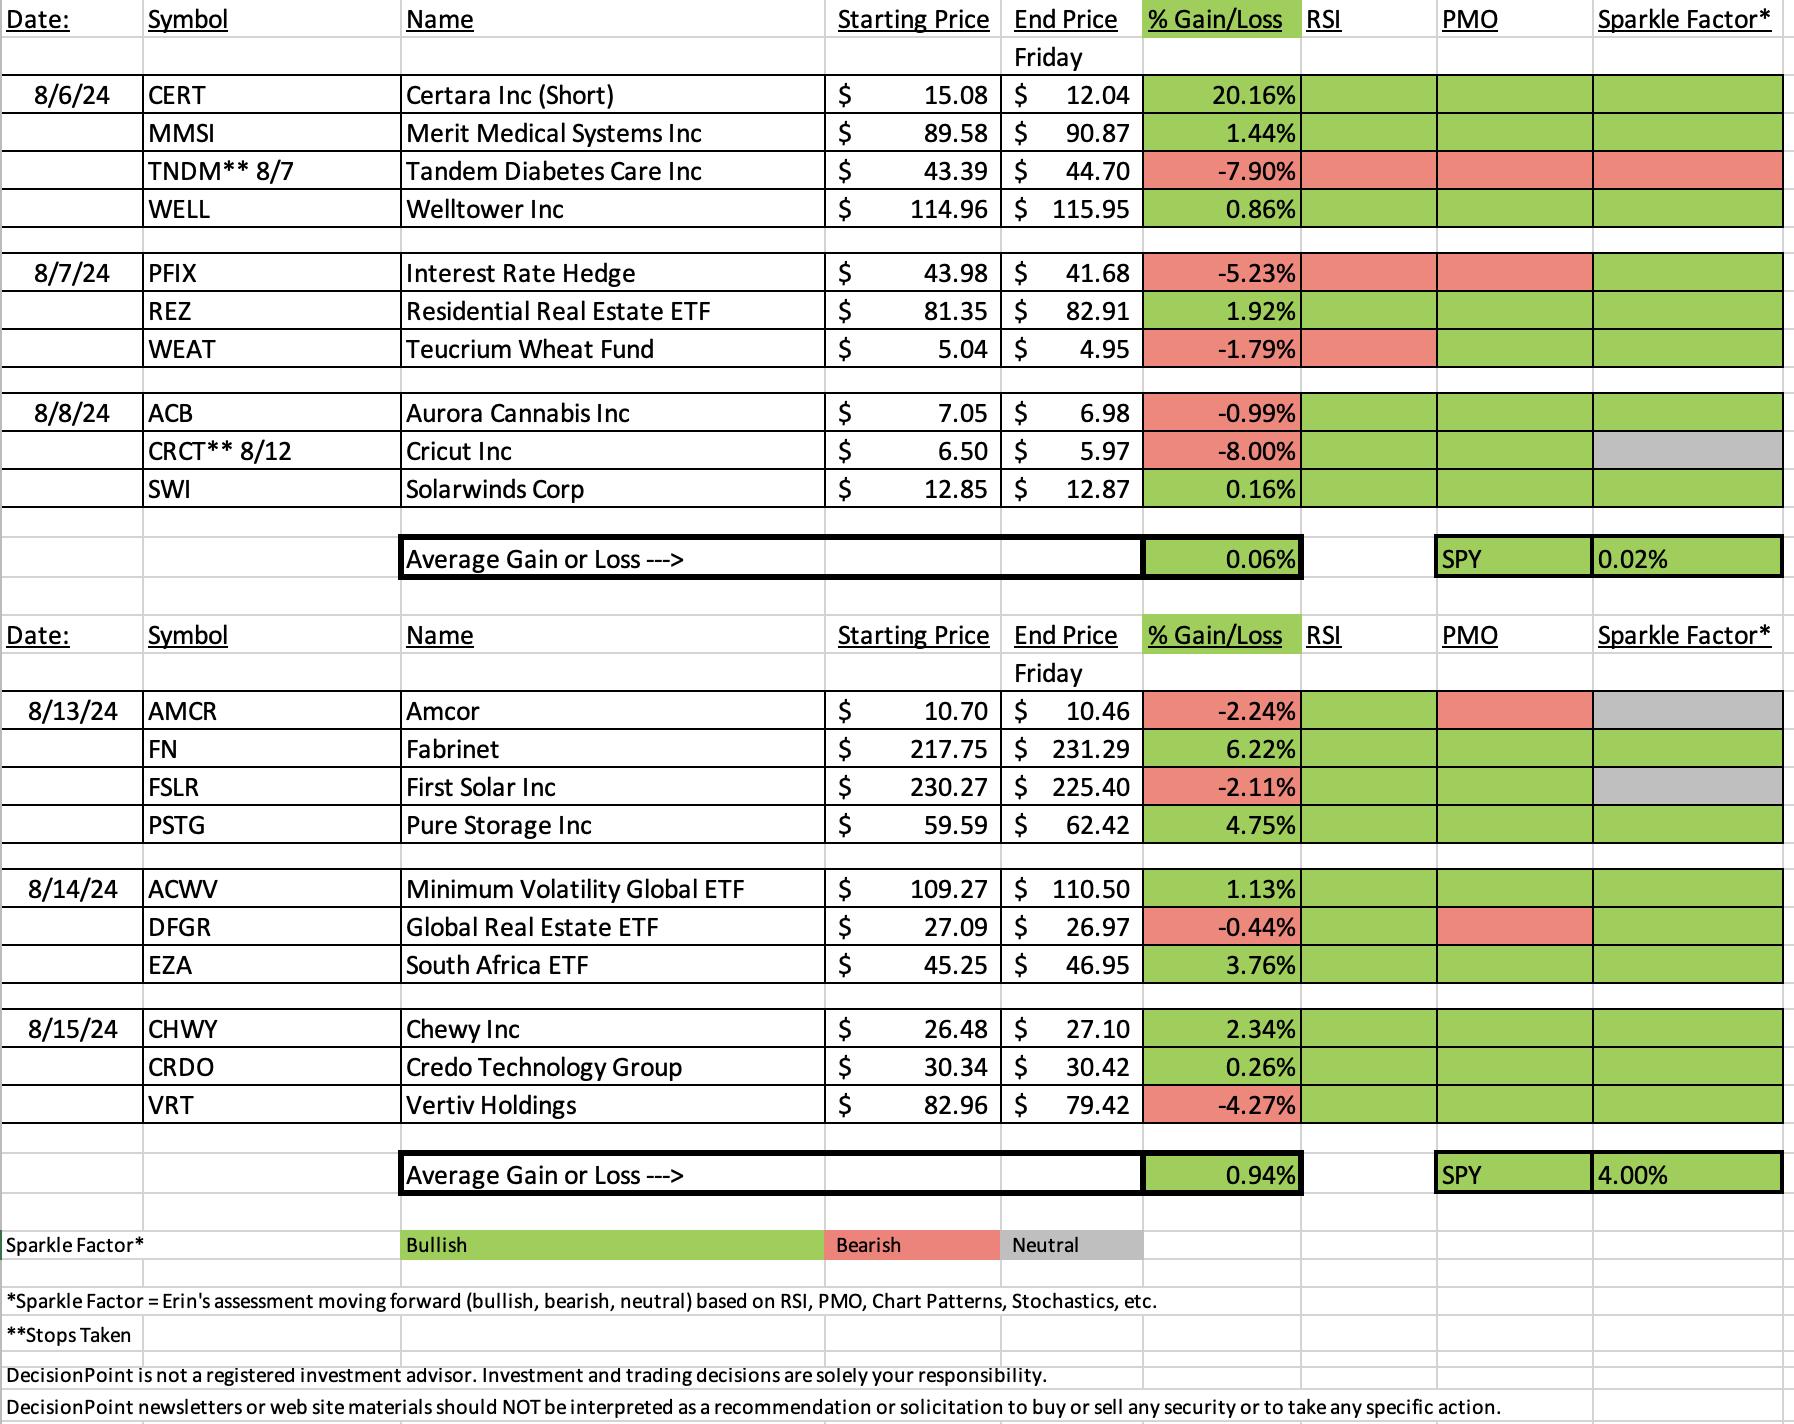
"Diamonds in the Rough" finished higher on the week, but not as high as the SPY. We did have a couple of big winners however, three positions took the average lower.
The market has made a swift turnaround and given the improvement in participation and DP signals, we have moved out of our bearish stance. It is time to focus on opportunities in the growth sectors. We are due for some digestion on the rally, but it should continue forward.
One of the losers this week was Amcor (AMCR). While it wasn't the worst performer, the chart really went south on earnings. I will be better about picking stocks that are going to report earnings as this was primarily the reason this stock was beat up. Still, the decline was only -2.24% on the week.
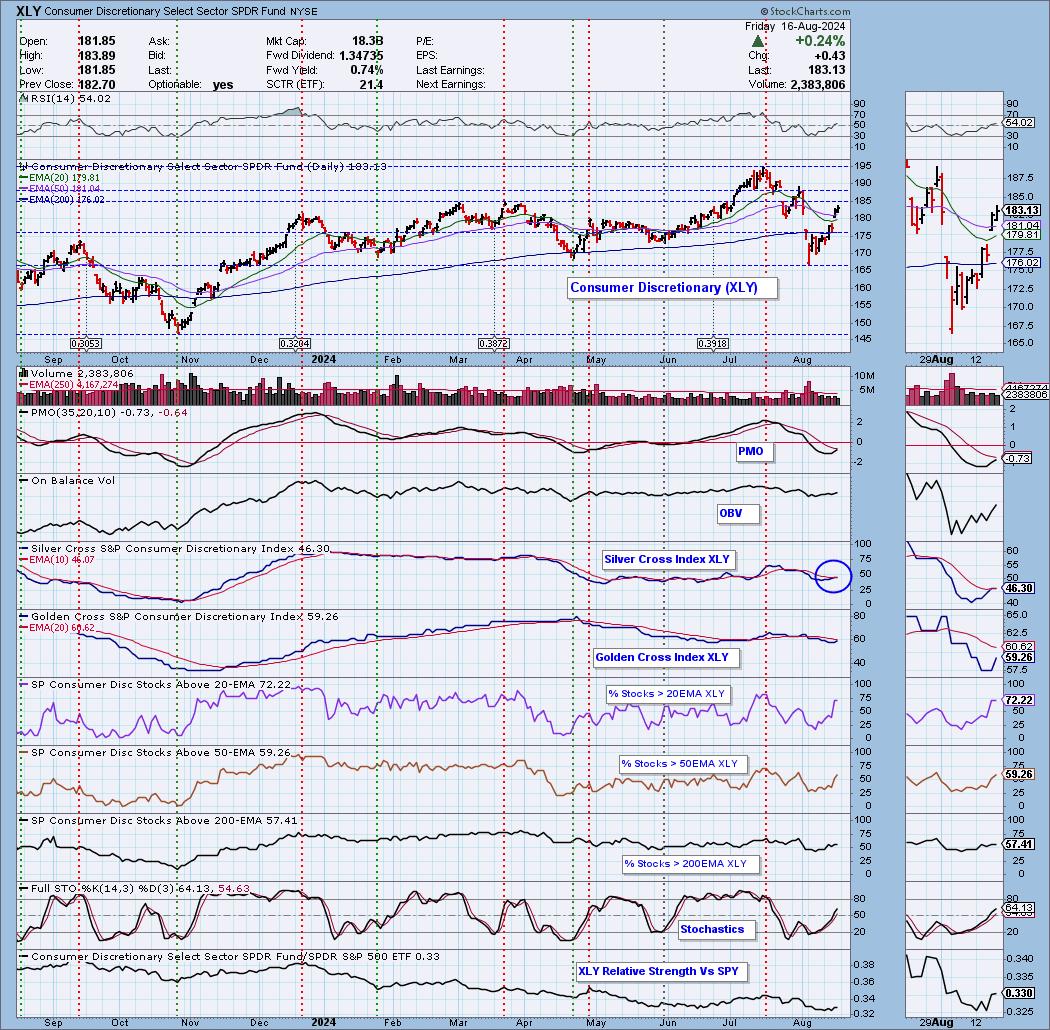
This week's Sector to Watch is Consumer Discretionary (XLY). I could've easily picked Technology (XLK) or even Materials (XLB), but ultimately on the back of the positive retail reports, I opted to go with XLY.
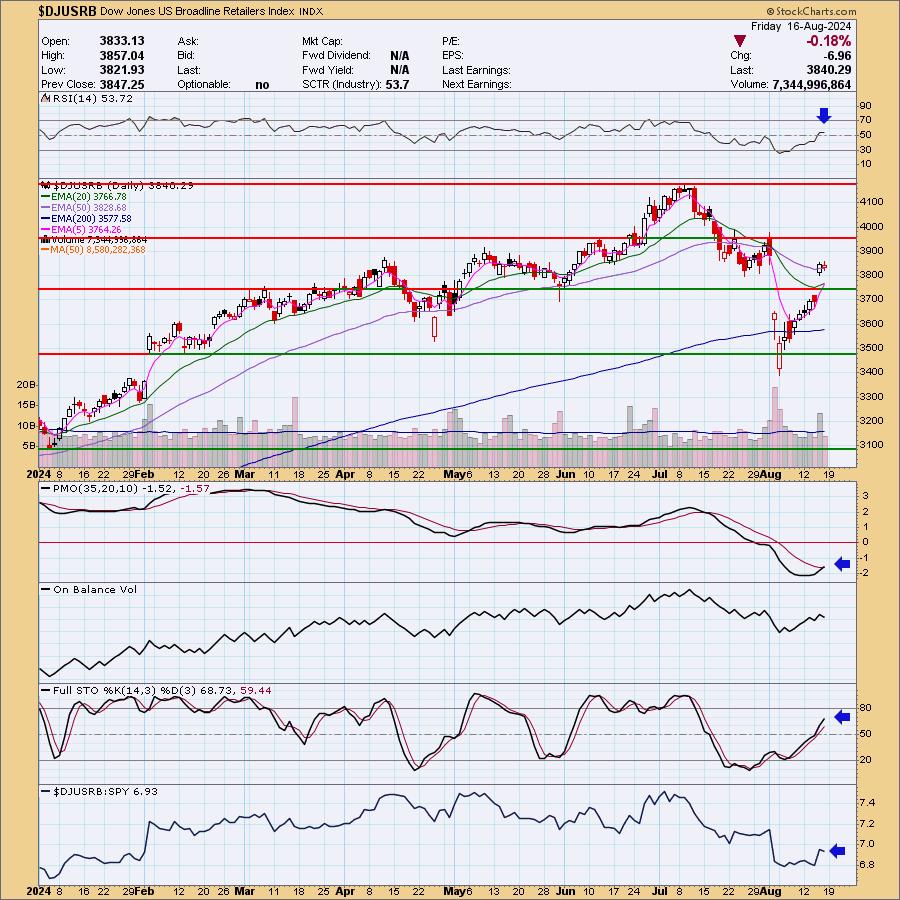
The Industry Group to Watch came down to Broadline Retailers and Autos. I opted for Retailers based on positive retail data. I found the following symbols for your review in this area: PDD, JD, BABA, M and AMZN.
The Darling this week was Fabrinet (FN) which was up over 6% this week. The chart is clicking. The Dud this week is Vertiv Holdings (VRT) which had a tough day on profit taking. We'll look to see if the chart has deteriorated too much.
We had time to run a scan at the end of the trading room. The Momentum Sleepers Scan presented quite a few good opportunities so you have a long list to review over the weekend: MET, KN, EQH, FDS, PFG, THRV, COTY, OGN and BBY.
Have a great weekend! See you in the Monday trading room!
Good Luck & Good Trading,
Erin

Diamond Mine Trading Room:
RECORDING & DOWNLOAD LINK (8/16/2024):
Topic: DecisionPoint Diamond Mine (8/16/2024) LIVE Trading Room
Download & Recording Link
Passcode: August#16
REGISTRATION for 8/23/2024:
When: August 23, 2024 09:00 AM Pacific Time (US and Canada)
Topic: DecisionPoint Diamond Mine LIVE Trading Room
Register in advance for this webinar HERE
After registering, you will receive a confirmation email containing information about joining the webinar.

Below is the latest free DecisionPoint Trading Room recording from 8/12. You'll find these recordings posted on Mondays to our DP YouTube Channel. Be sure and subscribe HERE.
A few items about the spreadsheet: I've put on the spreadsheet whether the RSI is positive (green) or negative (red). The PMO column tells you if it is rising (green) or falling (red). Finally I've added my own "Sparkle Factor" that gives you my assessment going forward, bullish (green), bearish (red) or neutral (gray). The Sparkle Factor is basically my thoughts on whether I expect it to rise or fall. A neutral means it could really go either way so it could be added to a watch list. If you're in a stock I consider "neutral" going forward, the ball is in your court.
Darling:
Fabrinet (FN)
EARNINGS: 2024-08-19 (AMC)
Fabrinet engages in the provision of optical packaging and electronic manufacturing services to original equipment manufacturers. The firm's engineering services include process design, failure analysis, reliability testing, tooling design, and real-time traceability system. Its manufacturing operations offer sensors, subsystems, customized optics, and optical modules and components. The company was founded by David Thomas Mitchell on August 12, 1999 and is headquartered in George Town, Cayman Islands.
Predefined Scans Triggered: Elder Bar Turned Green, Entered Ichimoku Cloud, P&F Double Top Breakout and Bullish MACD Crossovers.
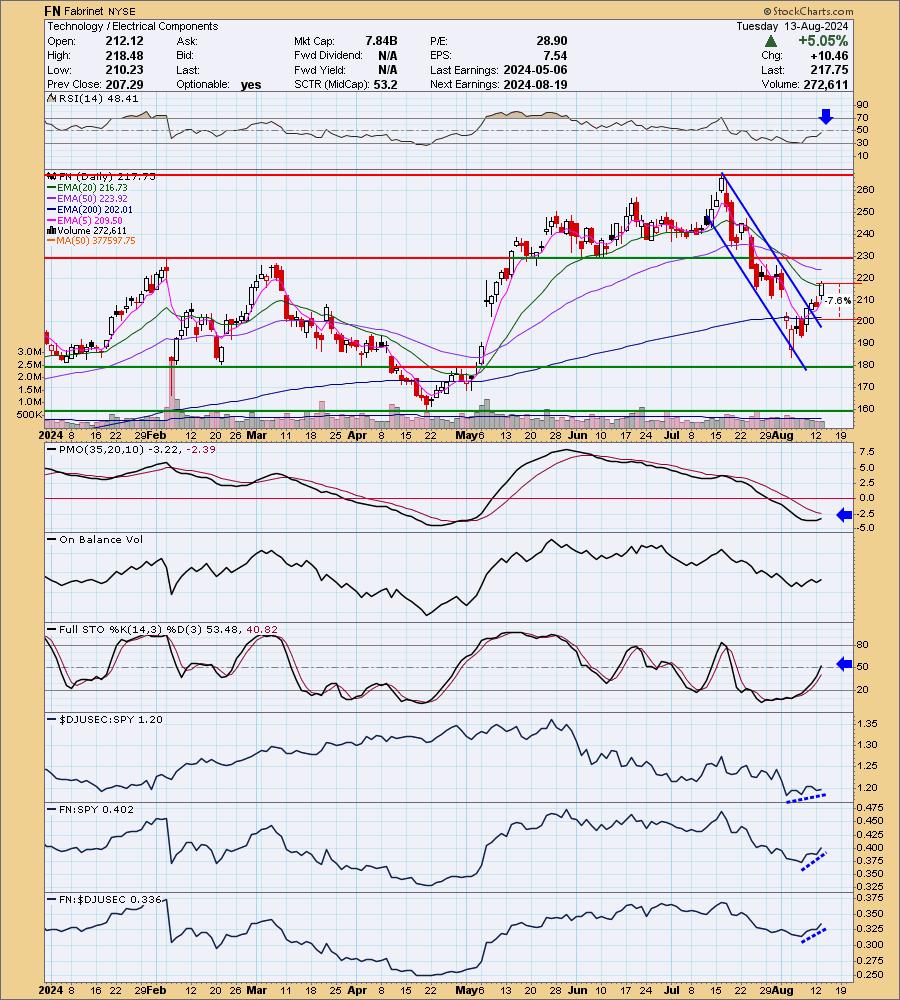
Below are the commentary and chart from Tuesday, 8/13:
"FN is down -1.62% in after hours trading so it is shaving off some of today's rally. The rally took price back above the 20-day EMA. It has been on a steep decline, but this rally has taken price out of a steep declining trend channel. The RSI is still negative, but it is rising and is just about in positive territory above net neutral (50). The PMO has just started to rise. Stochastics are now in positive territory and like the bit of outperformance we are seeing from both the group and the stock. The stop is set beneath the 200-day EMA at 7.6% or $201.20."
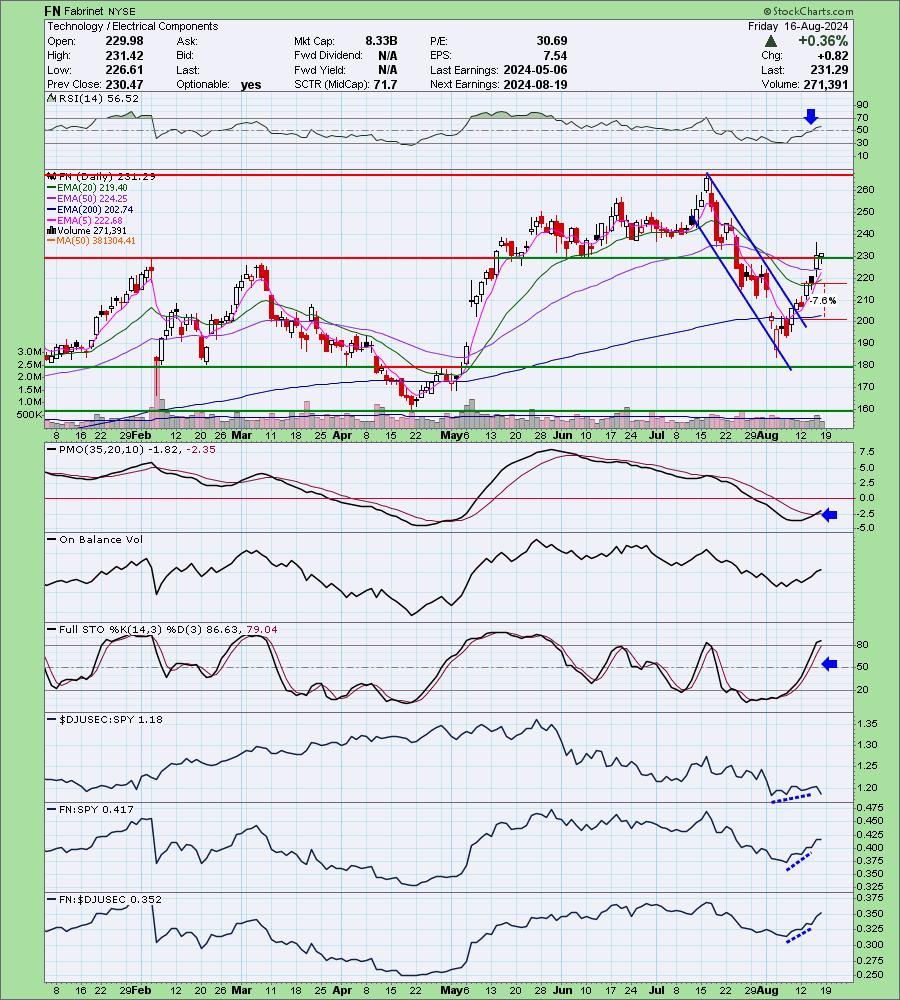
Here is today's chart:
The rally continues and has pushed above the next level of overhead resistance. We now have a PMO Crossover BUY Signal. The only blemish on the chart would be relative strength of the industry group is fading. FN doesn't seem to be bothered so I think it does have more upside to go.
Don't forget, on Thursdays I look at reader-requested symbols, so shoot me an email at erin@decisionpoint.com. I read every email I receive and try to answer them all!
Dud:
Vertiv Holdings, LLC (VRT)
EARNINGS: 2024-10-23 (BMO)
Vertiv Holdings Co. engages in the design, manufacture, and service of critical digital infrastructure technology that powers, cools, deploys, secures and maintains electronics that process, store and transmit data. It also offers power management products, thermal management products, integrated rack systems, modular solutions, and management systems for monitoring and controlling digital infrastructure. It operates through the following segments: Americas, Asia Pacific, and Europe, Middle East and Africa (EMEA). The Americas segment offers critical infrastructure and solutions, integrated rack solutions, and services and spares. The Asia Pacific segment includes products and services sold for applications within the data center, communication networks, and commercial or industrial markets throughout China, India, and the rest of Asia. The EMEA segment sells products and services for applications within the data center, communication networks and commercial/industrial markets. The company was founded on February 7, 2020 and is headquartered in Columbus, OH.
Predefined Scans Triggered: P&F Double Top Breakout.
Below are the commentary and chart from Thursday, 8/15:
"VRT is down -0.04% in after hours trading. Today saw a nice breakout above the 50-day EMA. It is still technically in a declining trend out of the May top, but it should see a breakout soon. The RSI is not overbought and there is a new PMO Crossover BUY Signal. Volume is starting to come in on the rally looking at the OBV. Stochastics are rising above 80 and I like that relative strength lines are all on the rise. The stop is set at the 20-day EMA at 7.7% or $76.57."
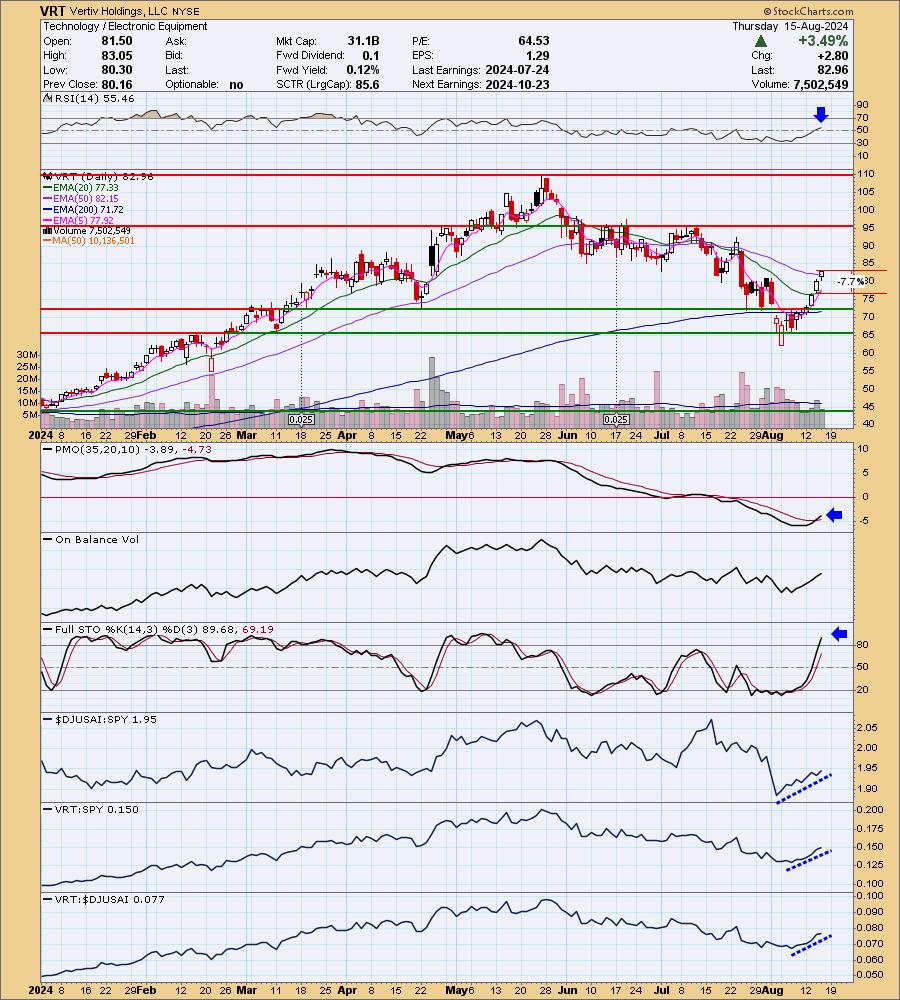
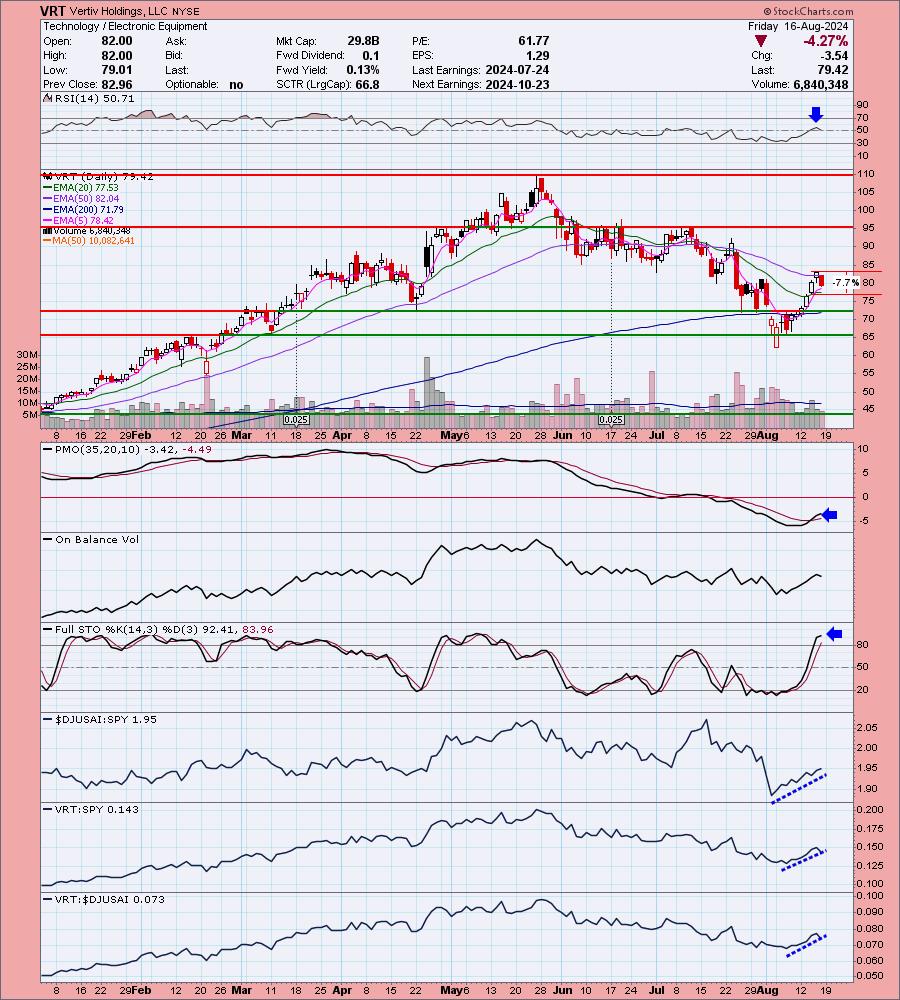
Here is today's chart:
It was a big decline today but it appears that it was a function of profit taking on a stock that has made a great move higher. The rising trend wasn't compromised and the PMO is still on the rise. I still like this one moving forward. Today's decline might offer a better entry. (Full disclosure: I own VRT)
THIS WEEK's Performance:
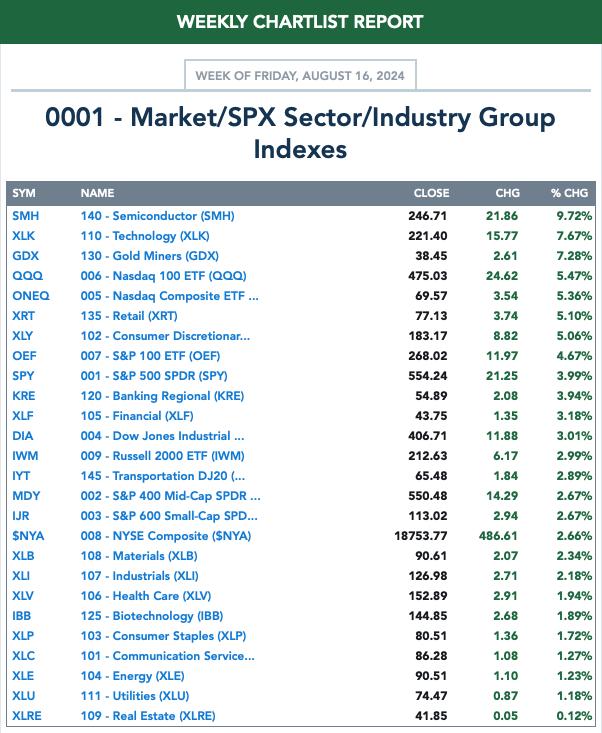
DecisionPoint Market Scoreboard (Mechanical Trend Model Signals):
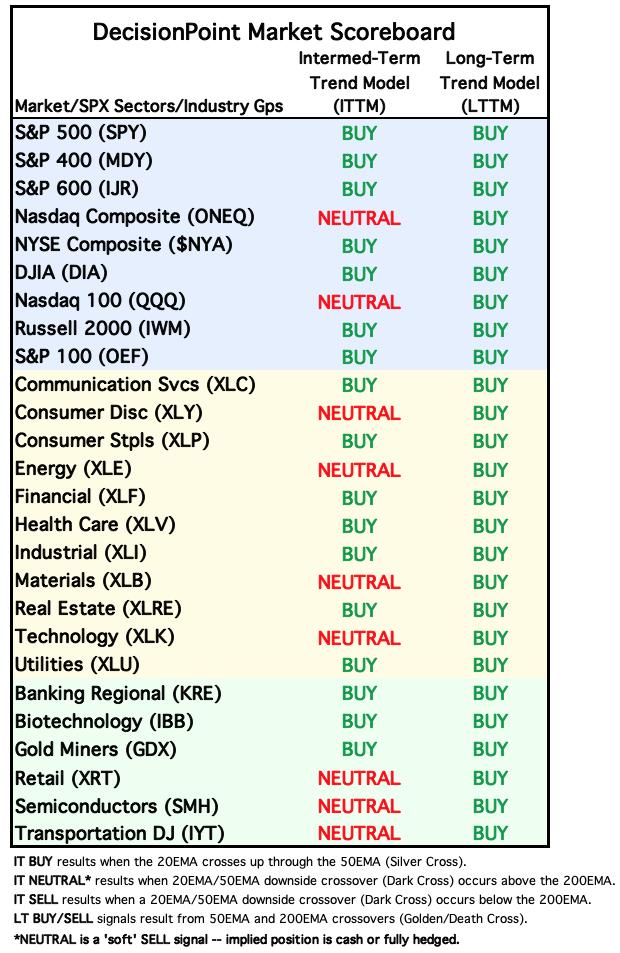
Friday signal changes are outlined in purple.
Click Here to view Carl's annotated "Under the Hood" ChartList!
Sector to Watch: Consumer Discretionary (XLY)
I liked the chart this morning and with new participation numbers, I like it even more. Primary is the Silver Cross Index moving above its signal line. This has shifted the IT Bias to BULLISH. We do have a zone of overhead resistance arriving, but with so many stocks above their 20-day EMAs and rising Stochastics, I'm looking for a breakout. The PMO is even nearing a Crossover BUY Signal and the RSI is not overbought. I like XLY's chances next week.
Industry Group to Watch: Broadline Retailers ($DJUSRB)
I like the big gap up move that was part of an island reversal. You'll note the price island that it gapped up above. This calls for more upside. The RSI is not at all overbought and we have a new PMO Crossover BUY Signal. Stochastics are also rising strongly. I also note some outperformance coming in. Some stocks to review from this group include: PDD, JD, BABA, M and AMZN.
Go to our Under the Hood ChartList on DecisionPoint.com to get an in-depth view of all the sectors. On StockCharts.com you can find the Industry Summary.
Good Luck & Good Trading!
- Erin
erin@decisionpoint.com
Full Disclosure: I'm 40% long, 0% short.
Watch the latest episode of the DecisionPoint Trading Room with Carl & Erin Swenlin on Mondays 3:00p EST!
Technical Analysis is a windsock, not a crystal ball. --Carl Swenlin
NOTE: The stocks reported herein are from mechanical trading model scans that are based upon moving average relationships, momentum and volume. DecisionPoint analysis is then applied to get selections from the scans. The selections given should prompt readers to do a chart review using their own analysis process. This letter is not a call for a specific action to buy, sell or short any of the stocks provided. There are NO sure things or guaranteed returns on the selection of "diamonds in the rough."
Helpful DecisionPoint Links:
DecisionPoint Shared ChartList and DecisionPoint Chart Gallery
Price Momentum Oscillator (PMO)
Swenlin Trading Oscillators (STO-B and STO-V)
(c) Copyright 2024 DecisionPoint.com