
The market managed to hold its own today in spite of NVDA's loss on the day. The broad market is indeed holding things together right now. This should be good for our portfolios.
There was one stock today requested by two people, GLDD. I was all set to present it given the duplication, but the chart looks like it is beginning to breakdown a bit. I can see the interest on the recent pullback, but I had better charts to show today.
Thank you to those who submitted requests. I will plan on looking at stocks not covered in tomorrow's Diamond Mine trading room. Be sure and sign up now! Information is always below the Diamonds logo below.
One of today's requests is 'boom or bust' so there is some good upside potential, but there is downside risk to digest (ALAB).
The other two look like winners that will keep on winning in a good bull market as we have right now. One of the stocks is in Defense which goes hand in hand with yesterday's Aerospace & Defense ETF (ITA). The other is on a bit of parabolic move, but looks really good in the short term to keep on running higher.
Good Luck & Good Trading,
Erin
Today's "Diamonds in the Rough": ALAB, AVAV and PPC.
Other requests: SCWX, GLDD, SFM, MCY, EMBC and DEI.

Diamond Mine Trading Room:
RECORDING & DOWNLOAD LINK (8/23/2024):
Topic: DecisionPoint Diamond Mine (8/23/2024) LIVE Trading Room
Recording & Download Link
Passcode: August#23
REGISTRATION for 8/30/2024:
When: August 30, 2024 09:00 AM Pacific Time (US and Canada)
Topic: DecisionPoint Diamond Mine LIVE Trading Room
Register in advance for this webinar HERE
After registering, you will receive a confirmation email containing information about joining the webinar.

Below is the latest free DecisionPoint Trading Room recording from 8/26. You'll find these recordings posted on Mondays to our DP YouTube Channel. Be sure and subscribe HERE.
Welcome to DecisionPoint Diamonds, wherein I highlight ten "Diamonds in the Rough" per week. These are selected from the results of my DecisionPoint Scans which search for stocks that could benefit from the trend and condition of the market. Remember, these are not recommendations to buy or sell, but are the most interesting of the stocks that surfaced in my scans. My objective is to save you the work of the initial, tedious culling process, but you need to apply your own analysis to see if these stocks pique your interest as well. There are no guaranteed winners here!
"Predefined Scans Triggered" are taken from StockCharts.com using the "Symbol Summary" option instead of a "SharpChart" on the workbench.
Stop levels are all rounded down.
Astera Labs Inc. (ALAB)
EARNINGS: None Listed.
Astera Labs, Inc. manufactures semiconductors. It offers smart retimers, riser cards, and GPU booster cards. The company products include: Aries PCIe CXLSmart DSP Retimers, Taurus Ethernet Smart Cable Modules and Leo CXL Memory Connectivity Controllers. Astera Labs is founded by Jitendra Mohan, Casey Morrison and Sanjay Gajendra in October 2017 and headquartered in Santa Clara, CA.
Predefined Scans Triggered: Moved Above Upper Bollinger Band, Stocks in a New Uptrend (Aroon), Moved Above Upper Price Channel, P&F Double Top Breakout and P&F Triple Top Breakout.
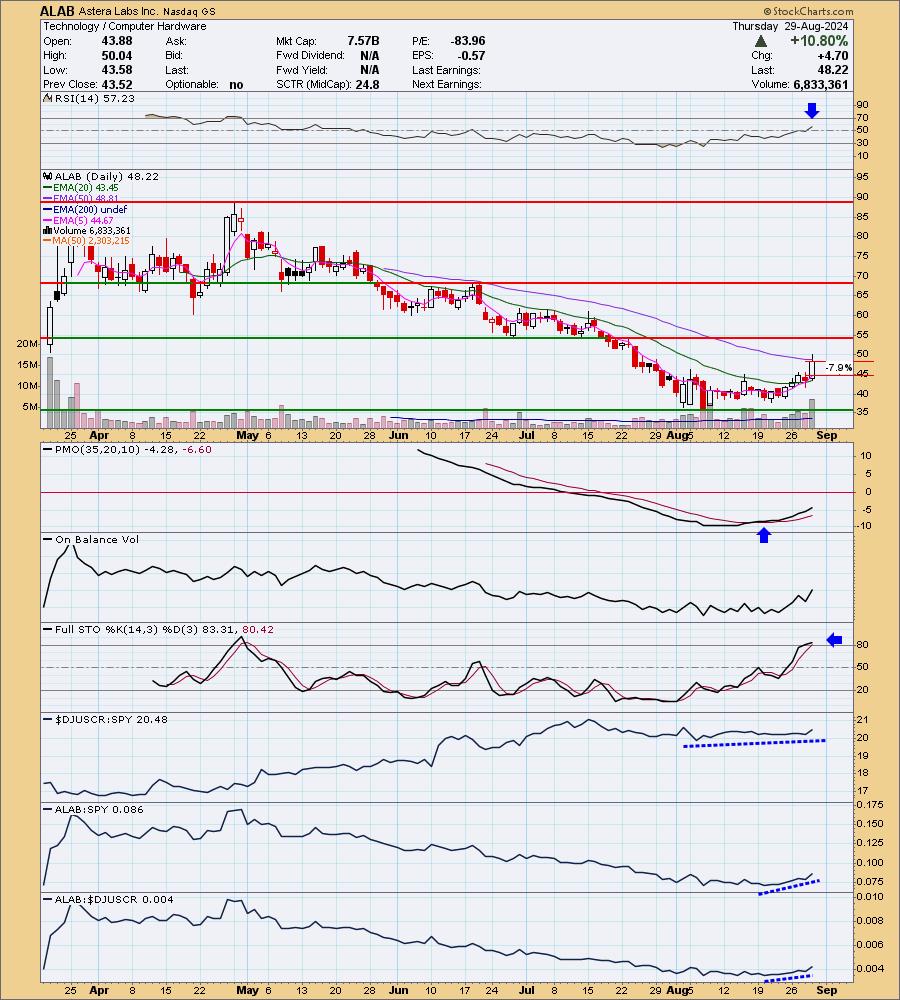
ALAB is up +0.04% in after hours trading. Today it ran very hot so a day or two of pause may be in order. I really liked the rounded bottom and the 5-day EMA crossing above the 20-day EMA for a Short-Term Trend Model BUY Signal. It looks primed for higher prices. The RSI is not yet overbought even with an over 10% rally today. The PMO is on a Crossover BUY Signal. It is beneath the zero line so I wouldn't label it pure strength at this point in time. Stochastics are above 80. The group is holding its own against the SPY and ALAB is outperforming both the group and the SPY. The stop was difficult to set given today's big rally, so I set it about as deeply as I could at 7.9% or $44.41.
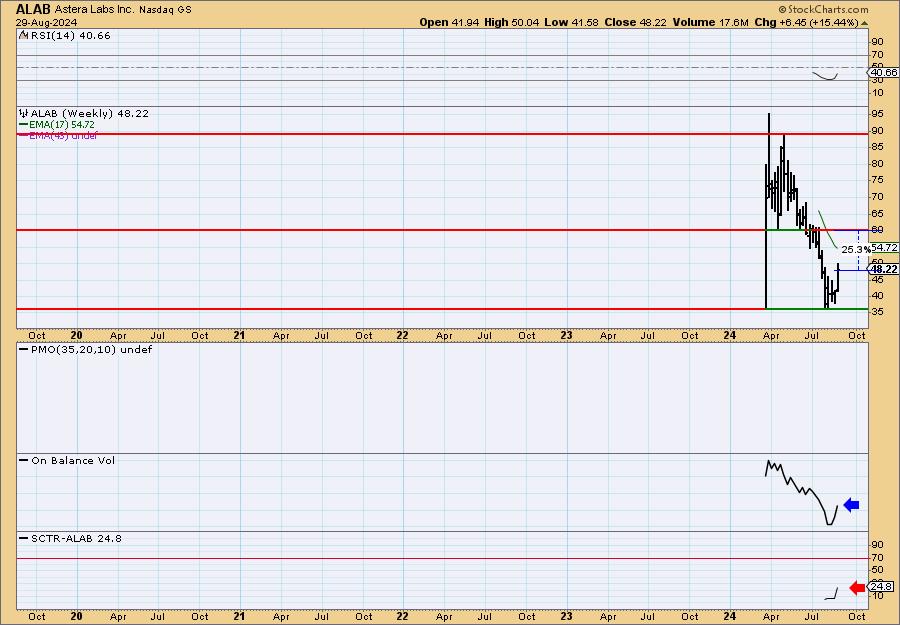
It's a newer issue so we don't have much on the weekly chart to help us. I do note that this bounce is coming off all-time lows with plenty of volume based on the OBV. Unfortunately, the StockCharts Technical Rank (SCTR) is well outside the hot zone*. Upside potential is very good on this boom or bust stock.
*If a stock is in the "hot zone" above 70, it implies that it is stronger than 70% of its universe (large-, mid-, small-caps and ETFs) primarily in the intermediate to long terms.
AeroVironment Inc. (AVAV)
EARNINGS: 2024-09-04 (AMC)
AeroVironment, Inc. engages in the design, development, and production of multi-domain robotic systems and related services for government agencies and businesses. It operates through the following business segments: UnCrewed Systems, Loitering Munitions Systems, and MacCready Work segments. The UnCrewed System segment focuses primarily on small UAS products designed to operate reliably at lower altitudes in a wide range of environmental conditions. The Loitering Munitions Systems segment focuses primarily on tube-launched aircraft that deploy with the push of a button, fly at higher speeds than small UAS products, and perform either effects delivery or reconnaissance missions, and related support services including training, spare parts, product repair, and product replacement. The MacCready Works segment focuses on customer-funded research and development in the areas of HAPS, robotics, sensors, software analytics, data intelligence and connectivity. The company was founded by Paul B. MacCready, Jr. in July 1971 and is headquartered in Arlington, VA.
Predefined Scans Triggered: Moved Above Upper Bollinger Band and Moved Above Upper Keltner Channel.
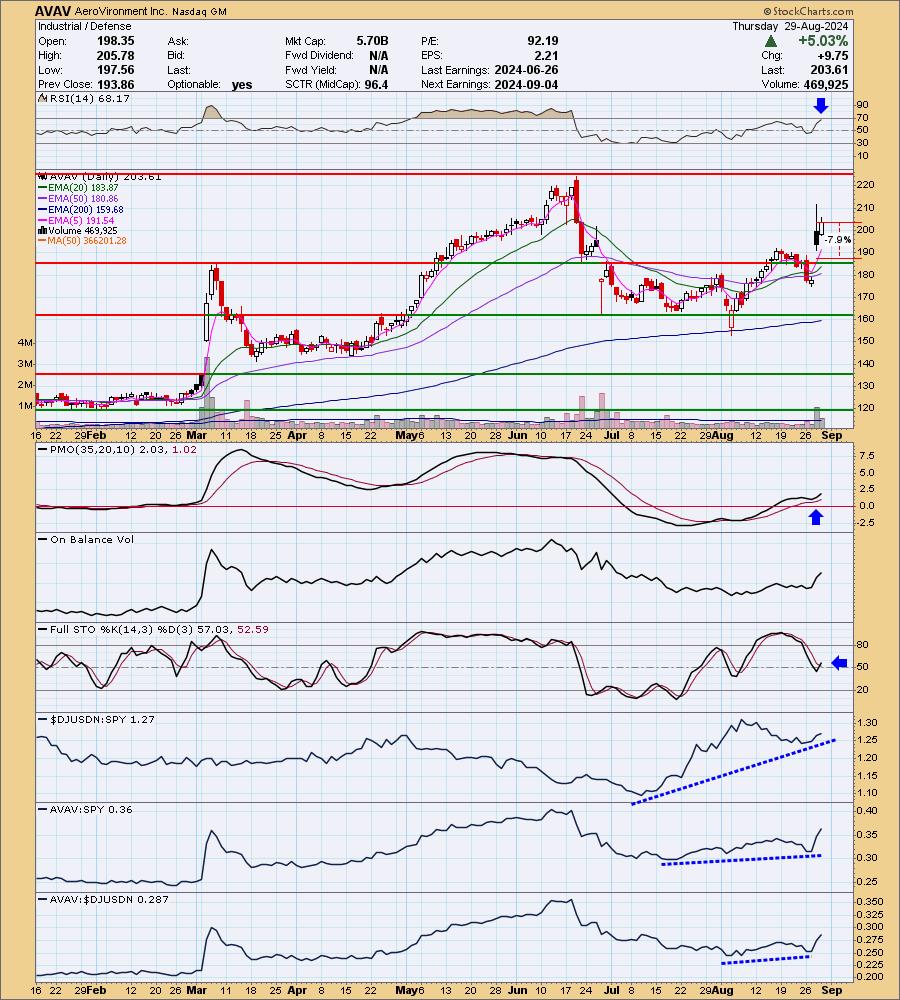
AVAV is unchanged in after hours trading. This one had a strong upside reversal. I liked that the bearish filled black candlestick didn't lead to a decline. The rally saw follow through instead. The other thing I really liked was the PMO Surge above the signal line. The RSI is getting a bit overbought, but looking at history on this chart, it can hold overbought conditions for some time. Stochastics have ticked back up on the rally. The group has been a pretty good relative performer over time. AVAV is showing good relative strength against the SPY and the group. It's even accelerated higher. The stop is set in the middle of the gap from yesterday at 7.9% or $187.52.
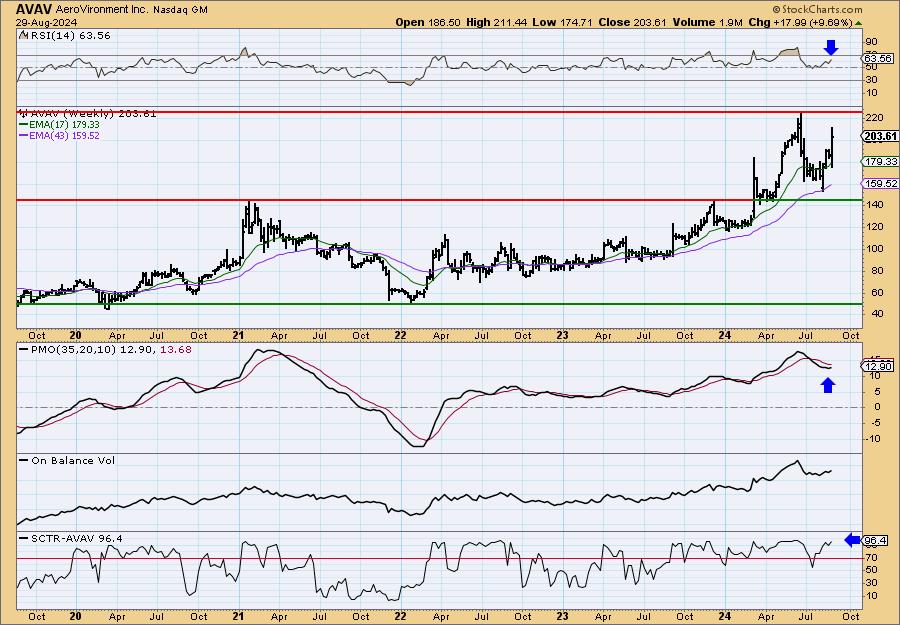
Price is headed back up to the all-time high after breaking from an original trading range. It's started a new range here but looks ready to breakout given the strong indicators. The weekly RSI is positive and not overbought. The weekly PMO is turning up well above the zero line. The SCTR is at the top of the hot zone above 70. Consider a 17% upside target to about $238.22.
Pilgrims Pride Corp. (PPC)
EARNINGS: 2024-10-30 (AMC)
Pilgrim's Pride Corp. engages in the production, processing, marketing, and distribution of fresh, frozen and value-added chicken and pork products to retailers, distributors, and foodservice operators. It operates through the following segments: U.S., U.K. and Europe, and Mexico. The company was founded by Lonnie A. Pilgrim and Aubrey Pilgrim on October 2, 1946, and is headquartered in Greeley, CO.
Predefined Scans Triggered: Moved Above Upper Bollinger Band, Moved Above Upper Price Channel, P&F Ascending Triple Top Breakout, P&F Double Top Breakout, Moved Above Upper Keltner Channel and New 52-week Highs.
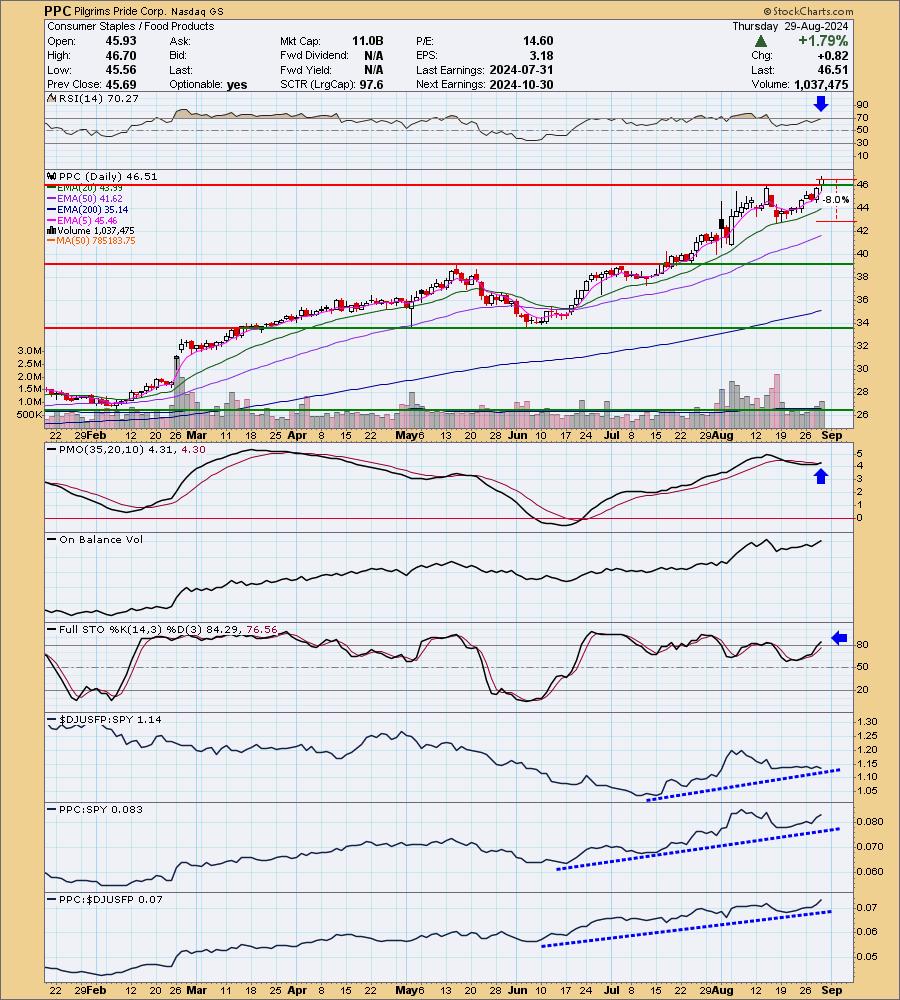
PPC is down -0.02% in after hours trading. The breakout sold me on this one along with the positive indicators. The rising trend is also very nice. It is overbought right now, but given it can hold these conditions for some time, I think it is a sign of strength in the move. There is a new PMO Crossover BUY Signal that occurred WELL above the zero line so there is pure strength here. Stochastics are now above 80 and I like those rising relative strength lines. I set the stop at support at about 8% or $42.78.
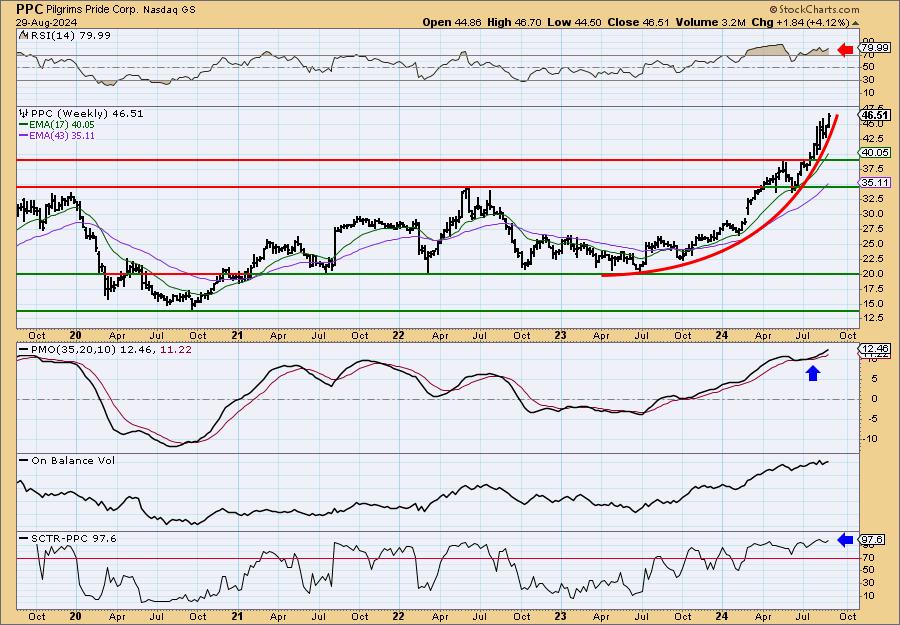
Here is a bit of a problem. We have a parabolic move upward and remember these beg for a correction or at least a softening of the rising trend. The weekly RSI is very overbought, but admittedly it has maintained it for some time. We just need to be concerned about overbought conditions on both the daily and weekly. The weekly PMO looks spectacular so far above the zero line. The SCTR is at the top of the hot zone so it does have a good outlook right now. Just be sure to set a stop in case the parabola breaks down. Consider a 17% upside target to about $54.42.
Don't forget, on Thursdays I look at reader-requested symbols, click HERE to send me an email. I read every email I receive and try to answer them all!
Current Market Outlook:
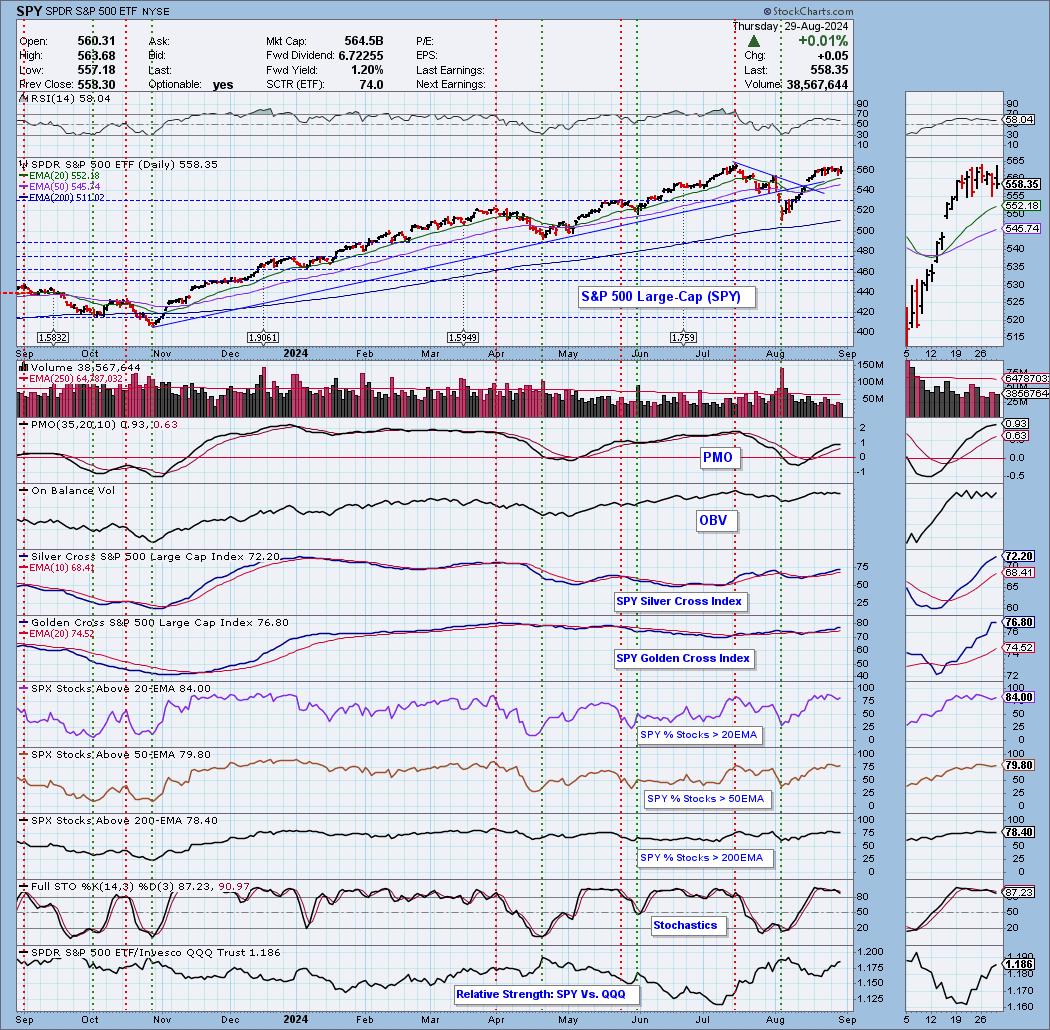
Market Environment: It is important to consider the odds for success by assessing the market tides. The following chart uses different methodologies for objectively showing the depth and trend of participation for intermediate- and long-term time frames.
- The Silver Cross Index (SCI) shows the percentage of SPX stocks on IT Trend Model BUY signals (20-EMA > 50-EMA)
- The Golden Cross Index (GCI) shows the percentage of SPX stocks on LT Trend Model BUY signals (50-EMA > 200-EMA)
Don't forget that as a "Diamonds" member, you have access to our "Under the Hood" curated ChartList on DecisionPoint.com. You'll find it under "Members Only" links on the left side on the Blogs and Links Page.
Here is the current chart:
Full Disclosure: I am 35% long, 0% short. I'll be on the lookout to make some additions tomorrow. Maybe we'll find some great candidates in the Diamond Mine.
I'm required to disclose if I currently own a stock I mention and/or may buy/short it within the next 72 hours.
"Technical Analysis is a windsock, not a crystal ball." - Carl Swenlin
(c) Copyright 2024 DecisionPoint.com
Watch the latest episode of DecisionPoint Trading Room with Carl & Erin Swenlin Mondays on the DecisionPoint YouTube channel here!
NOTE: The stocks reported herein are from mechanical trading model scans that are based upon moving average relationships, momentum and volume. DecisionPoint analysis is then applied to get five selections from the scans. The selections given should prompt readers to do a chart review using their own analysis process. This letter is not a call for a specific action to buy, sell or short any of the stocks provided. There are NO sure things or guaranteed returns on the daily selection of "Diamonds in the Rough."
Regarding BUY/SELL Signals: The signal status reported herein is based upon mechanical trading model signals and crossovers. They define the implied bias of the price index/stock based upon moving average relationships and momentum, but they do not necessarily call for a specific action. They are information flags that should prompt chart review. Further, they do not call for continuous buying or selling during the life of the signal. For example, a BUY signal will probably (but not necessarily) return the best results if action is taken soon after the signal is generated. Additional opportunities for buying may be found as price zigzags higher, but the trader must look for optimum entry points. Conversely, exit points to preserve gains (or minimize losses) may be evident before the model mechanically closes the signal.
Helpful DecisionPoint Links:
Price Momentum Oscillator (PMO)
Swenlin Trading Oscillators (STO-B and STO-V)
For more links, go to DecisionPoint.com