
It's a new week for "Diamonds in the Rough"! Scans produced quite a few results as our Scan Alert System members know! I noticed a them of Bank stocks, but I opted not to present them as nearly every one of them was beginning pullback mode. I don't have high hopes there.
I think today's picks are well rounded with a Consumer Staple and Real Estate represented in addition to Healthcare. I have a reversal candidate for you that could be considered "boom or bust" as upside potential is excellent if it can keep its rally going.
I still sense overall weakness in the market. Clearly investors are holding their breath regarding NVDA earnings after the bell tomorrow. I opted to sell my shares rather than hold through earnings. It really could go either way, but with Stochastics falling on NVDA it was the excuse I needed to get out. I will be sad if I miss out on a big gap up move, but I need peace of mind and with the market looking weak overall, it seemed best. At the same time, NVDA could kickstart the rally again. Tough decision to make.
Good Luck & Good Trading,
Erin
Today's "Diamonds in the Rough": LNTH, SBRA, SNCY and UNFI.
Runner-ups: UFPT, INCY, WTS, CUZ, ALEX, RWT and WT.

Diamond Mine Trading Room:
RECORDING & DOWNLOAD LINK (8/23/2024):
Topic: DecisionPoint Diamond Mine (8/23/2024) LIVE Trading Room
Recording & Download Link
Passcode: August#23
REGISTRATION for 8/30/2024:
When: August 30, 2024 09:00 AM Pacific Time (US and Canada)
Topic: DecisionPoint Diamond Mine LIVE Trading Room
Register in advance for this webinar HERE
After registering, you will receive a confirmation email containing information about joining the webinar.

Below is the latest free DecisionPoint Trading Room recording from 8/26. You'll find these recordings posted on Mondays to our DP YouTube Channel. Be sure and subscribe HERE.
Welcome to DecisionPoint Diamonds, wherein I highlight ten "Diamonds in the Rough" per week. These are selected from the results of my DecisionPoint Scans which search for stocks that could benefit from the trend and condition of the market. Remember, these are not recommendations to buy or sell, but are the most interesting of the stocks that surfaced in my scans. My objective is to save you the work of the initial, tedious culling process, but you need to apply your own analysis to see if these stocks pique your interest as well. There are no guaranteed winners here!
"Predefined Scans Triggered" are taken from StockCharts.com using the "Symbol Summary" option instead of a "SharpChart" on the workbench.
Stop levels are all rounded down.
Lantheus Holdings, Inc. (LNTH)
EARNINGS: 2024-10-31 (BMO)
Lantheus Holdings, Inc. engages in the provision of diagnostic imaging and nuclear medicine products. The firm develops products that help healthcare professionals in patient management and outcomes and assists clinicians with the detection of cardiovascular disease. It operates through the U.S. and International geographical segments. The U.S. segment produces and markets products, radiopharmacies, PMFs, integrated delivery networks, hospitals, clinics, and group practices throughout the United States. The International segment offers direct distribution in Canada and third-party distribution relationships in Europe, Canada, Australia, Asia-Pacific, Central America, and South America. The company was founded in 1956 and is headquartered in Bedford, MA.
Predefined Scans Triggered: Moved Above Upper Bollinger Band and P&F Double Top Breakout.
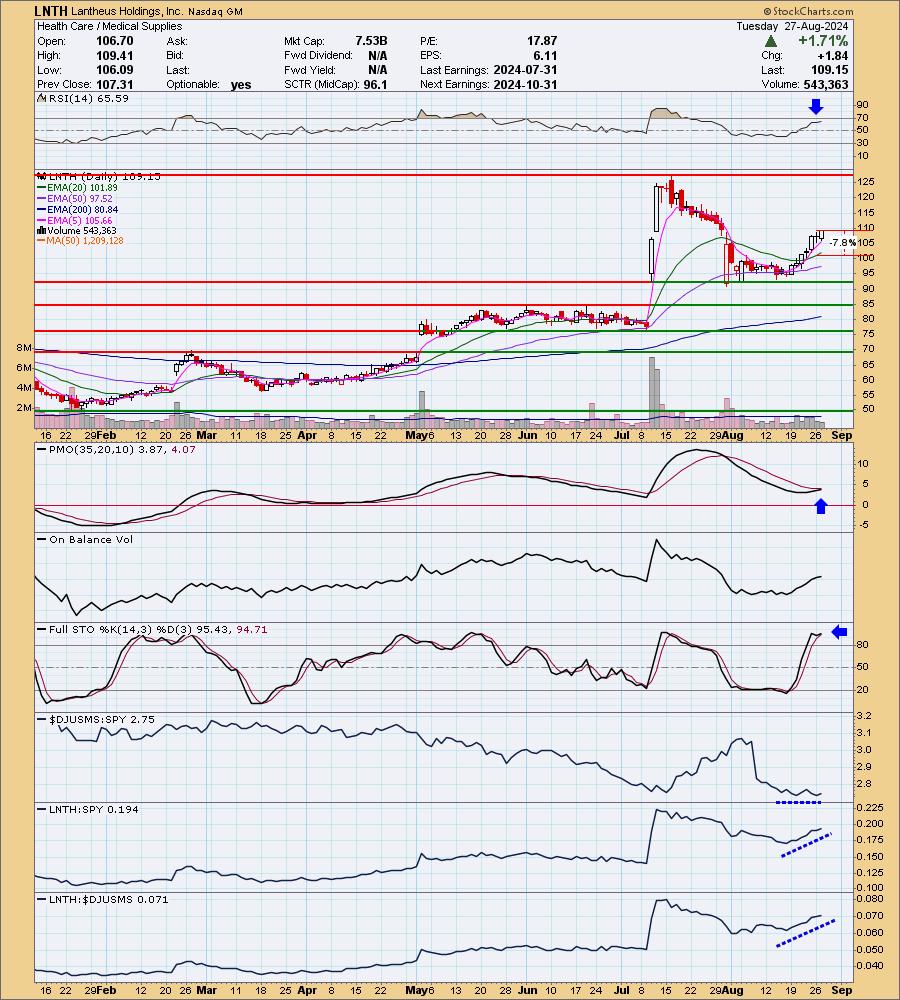
LNTH is unchanged in after hours trading. The company did poorly going into earnings, but it has turned it around after reversing on gap support. It has been up seven days in a row so it may be due for a pause, but indicators are very bullish and do suggest followthrough. The RSI is positive and not overbought. The PMO is going in for a Crossover BUY Signal. Stochastics are rising well above 80 suggesting internal strength. This PMO bottom is also coming above the zero line. The stop is set below the 20-day EMA at 7.8% or $100.63.
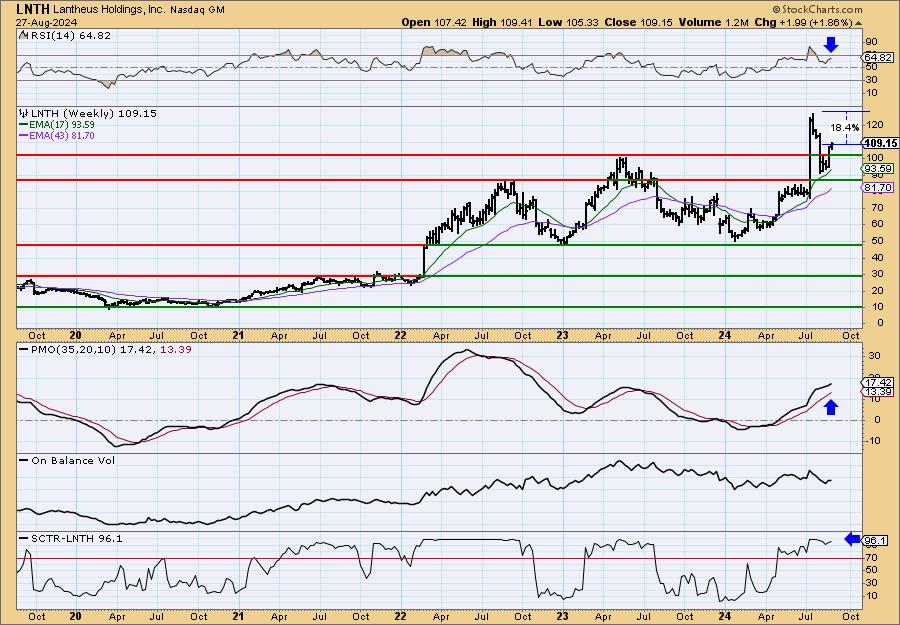
The weekly chart is decidedly bullish. We have a break above resistance at the top of the prior trading range. The weekly RSI is not overbought and is positive. The weekly PMO is accelerating higher. The StockCharts Technical Rank (SCTR) is at the top of the hot zone* above 70. If it can return to its all-time high it would be a tidy 18% gain.
*If a stock is in the "hot zone" above 70, it implies that it is stronger than 70% of its universe (large-, mid-, small-caps and ETFs) primarily in the intermediate to long terms.
Sabra Healthcare REIT Inc. (SBRA)
EARNINGS: 2024-11-11 (AMC)
Sabra Health Care REIT, Inc. engages in the business of acquiring, financing, and owning real estate property. The company was founded on May 10, 2010 and is headquartered in Tustin, CA.
Predefined Scans Triggered: Moved Above Upper Bollinger Band, Moved Above Upper Price Channel, P&F Double Top Breakout and New 52-week Highs.
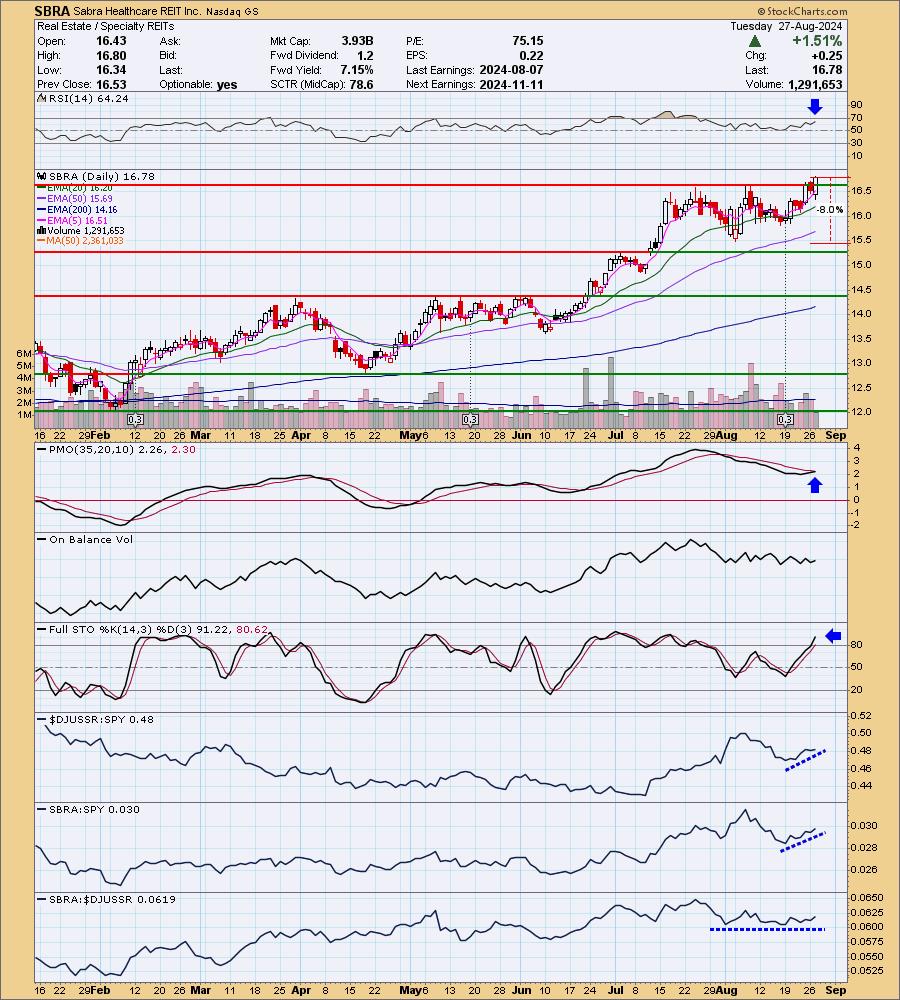
SBRA is unchanged in after hours trading. I liked today's breakout move combined with the bullish engulfing candlestick that implies follow through tomorrow. This breakout took it out of a prior trading range. The RSI is positive and not overbought yet. The PMO is nearing a Crossover BUY Signal. Stochastics are rising above 80 and while it isn't performing that well against its industry group, it is outperforming the SPY. I've set a stop beneath support at 8% or $15.43.
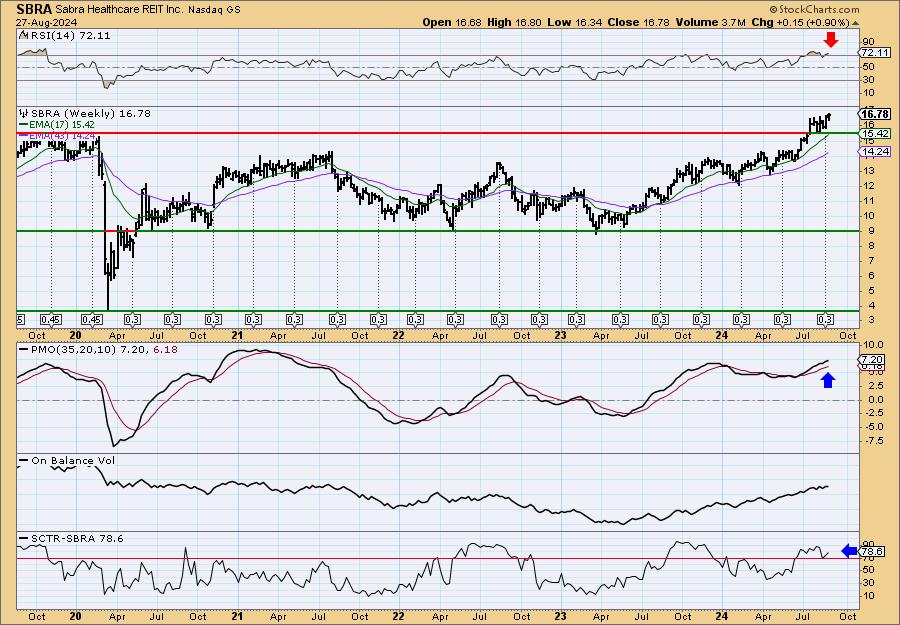
The weekly chart is strong except that the weekly RSI is overbought. That hasn't been a problem, but it could be. Price is making new 52-week highs and has broken from a long-term trading range. This breakout looks very good. The weekly PMO is on the rise well above the zero line and the SCTR is in the hot zone. Consider a 17% upside target to $19.63.
Sun Country Airlines Holdings Inc. (SNCY)
EARNINGS: 2024-11-07 (AMC)
Sun Country Airlines Holdings, Inc. engages in the provision of scheduled passenger service, charter air transportation and, cargo businesses. Its geographical segments include Domestic and Latin America segment. The company was founded on December 8, 2017 and is headquartered in Minneapolis, MN.
Predefined Scans Triggered: None.
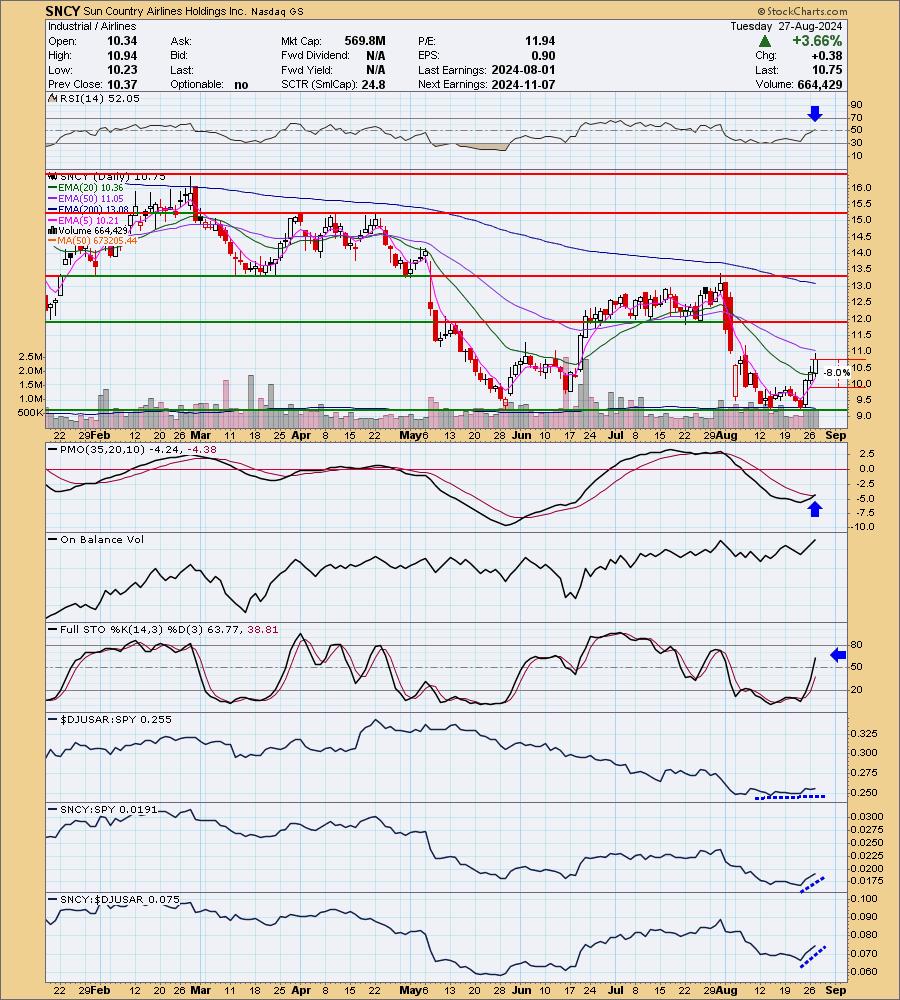
SNCY is down -1.86% in after hours trading so it is taking back some of the gains on the recent rally. This is your 'boom or bust' stock. It is a reversal candidate because price is below both the 50/200-day EMAs. This one will either soar or trigger its stop. The RSI just moved into positive territory. There is a new PMO Crossover BUY Signal. Stochastics are rising strongly in positive territory. Relative strength isn't much for the Airline group, but we do see that SNCY is beginning to outperform its brethren as well as the SPY. Oh! I also note rising bottoms on the OBV and flat bottoms on price; that's a positive divergence. I've set the stop at 8% or $9.89, the deepest I will generally go due to its 'boom or bust' characteristics.
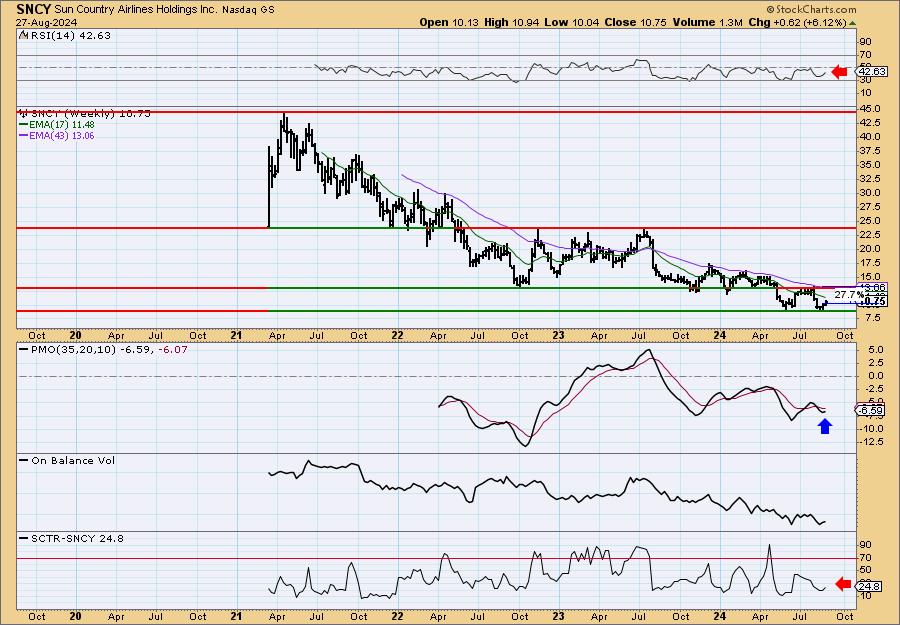
I like that we only need price to get up to the top of this trading range in order to see gains of over 25%. That seems doable. The weekly RSI is negative due to the overarching declining trend this stock has been in. The weekly PMO has turned up which is good. The SCTR is also well outside the hot zone. We are counting on a reversal, but it may be very short lived given the long-term declining trend.
United Natural Foods, Inc. (UNFI)
EARNINGS: 2024-09-24 (BMO)
United Natural Foods, Inc. engages in the distribution of natural, organic, and specialty foods and non-food products. The firm operates through the Wholesale and Retail segments. The Wholesale segment is engaged in the national distribution of natural, organic, specialty, produce, and conventional grocery and non-food products, and providing retail services in the United States and Canada. The Retail segment derives revenues from the sale of groceries and other products at retail locations operated by company. It offers food and non food, frozen, perishables, bulk, body care products, and supplements. The company was founded by Michael S. Funk and Norman A. Cloutier in July 1976 and is headquartered in Providence, RI.
Predefined Scans Triggered: Bullish 50/200-day SMA Crossovers.
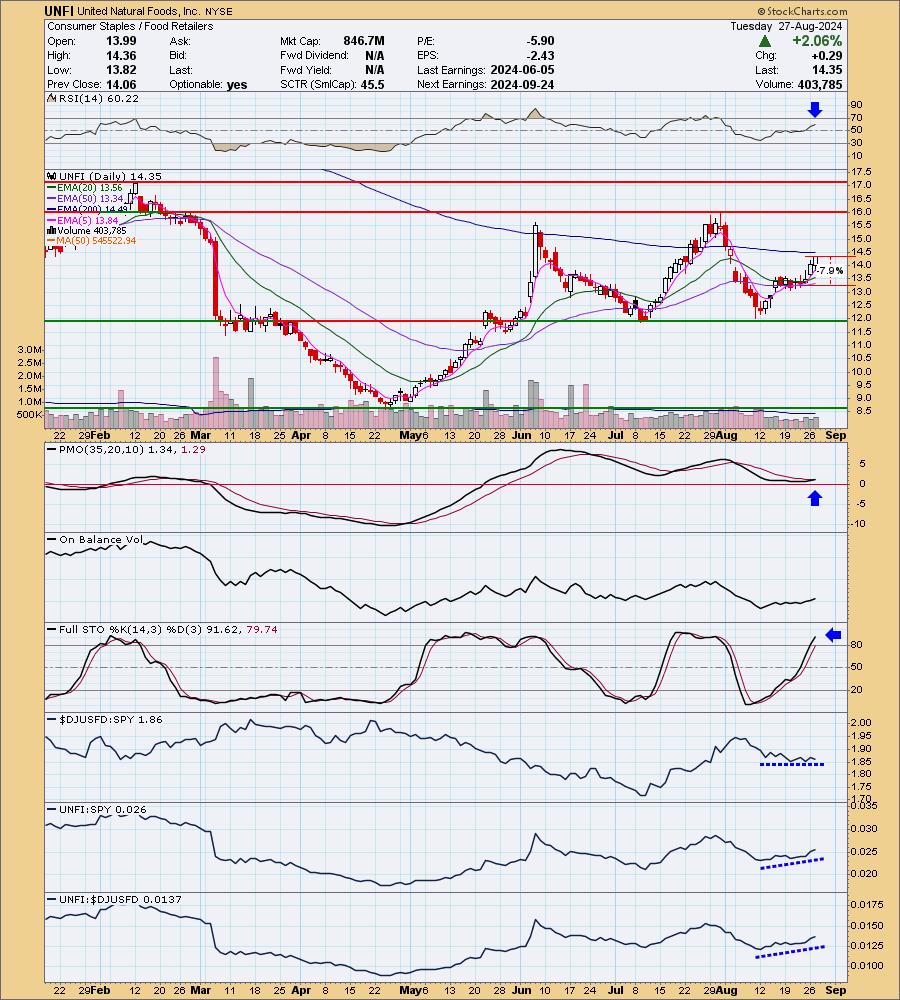
UNFI is down -1.74% in after hours trading so it is giving back much of today's gain so far. We'll see if it progresses into tomorrow. I like this rally off support that is about to take out the bearish double top pattern. Price does have a big test ahead at the 200-day EMA so it may stumble a bit first before breaking out. The RSI is positive and not overbought. The PMO is on a new Crossover BUY Signal and the OBV is rising. Stochastics are above 80 and rising. Relative strength is okay for the industry group, but UNFI is seeing outperformance of both the group and SPY. I like this area of the market given weak price action currently. The stop is set beneath the 50-day EMA at 7.9% or $13.21.
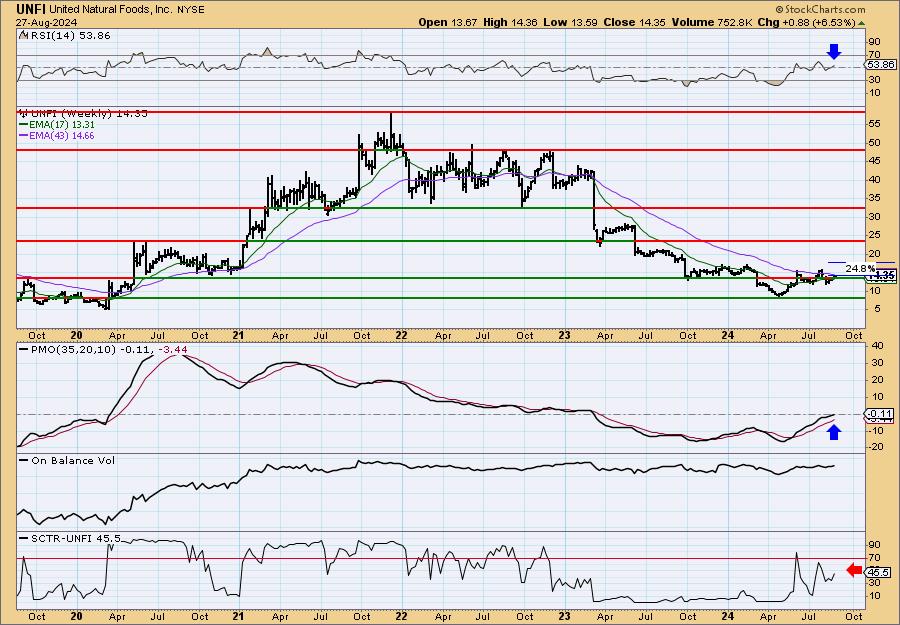
Price is currently below the 43-week EMA, but it does look like we are getting a constructive bottom this year. The weekly RSI is positive and the weekly PMO is rising on a Crossover BUY Signal. It is getting close to vaulting the zero line too. The SCTR does need some help given it is outside the hot zone. If price can reach the early 2024 highs it would be an excellent gain.
Don't forget, on Thursdays I look at reader-requested symbols, click HERE to send me an email. I read every email I receive and try to answer them all!
Current Market Outlook:
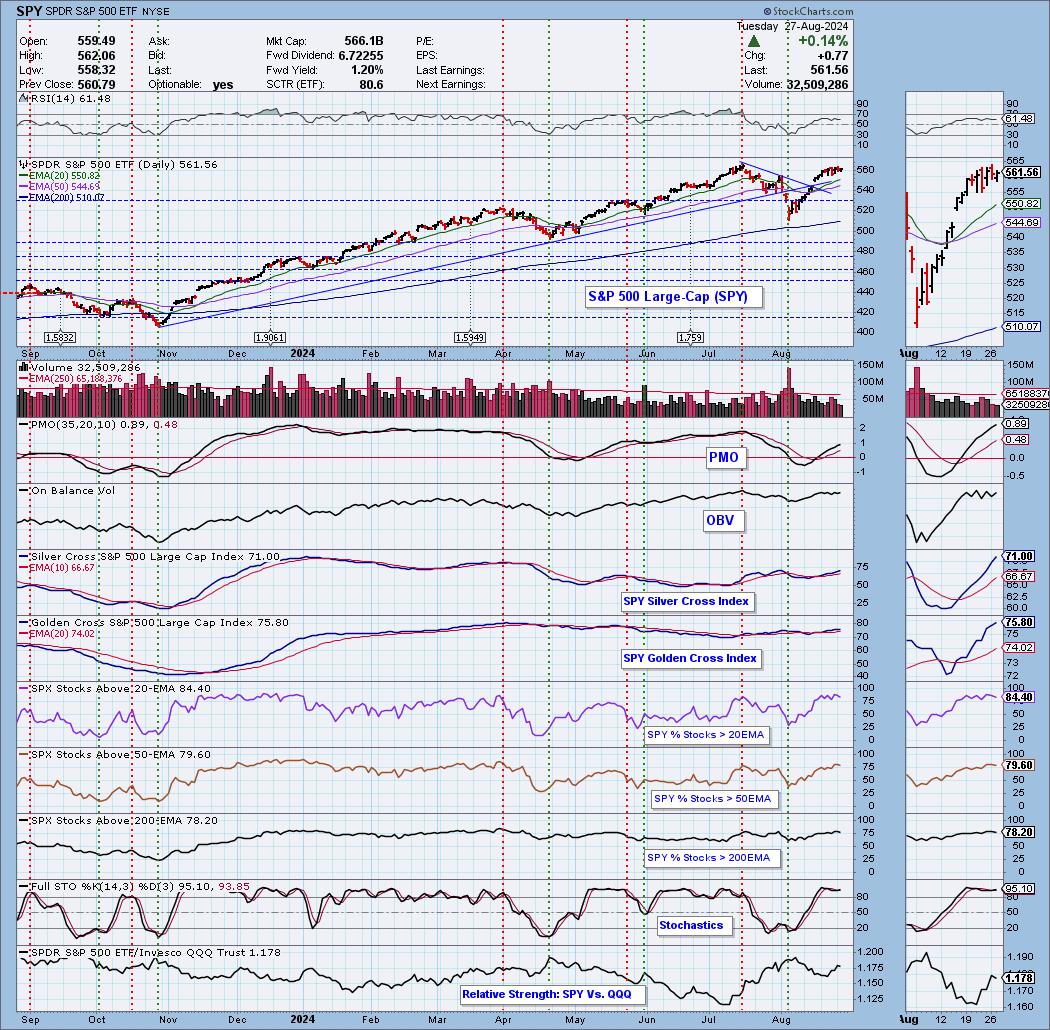
Market Environment: It is important to consider the odds for success by assessing the market tides. The following chart uses different methodologies for objectively showing the depth and trend of participation for intermediate- and long-term time frames.
- The Silver Cross Index (SCI) shows the percentage of SPX stocks on IT Trend Model BUY signals (20-EMA > 50-EMA)
- The Golden Cross Index (GCI) shows the percentage of SPX stocks on LT Trend Model BUY signals (50-EMA > 200-EMA)
Don't forget that as a "Diamonds" member, you have access to our "Under the Hood" curated ChartList on DecisionPoint.com. You'll find it under "Members Only" links on the left side on the Blogs and Links Page.
Here is the current chart:
Full Disclosure: I am 35% long, 0% short.
I'm required to disclose if I currently own a stock I mention and/or may buy/short it within the next 72 hours.
"Technical Analysis is a windsock, not a crystal ball." - Carl Swenlin
(c) Copyright 2024 DecisionPoint.com
Watch the latest episode of DecisionPoint Trading Room with Carl & Erin Swenlin Mondays on the DecisionPoint YouTube channel here!
NOTE: The stocks reported herein are from mechanical trading model scans that are based upon moving average relationships, momentum and volume. DecisionPoint analysis is then applied to get five selections from the scans. The selections given should prompt readers to do a chart review using their own analysis process. This letter is not a call for a specific action to buy, sell or short any of the stocks provided. There are NO sure things or guaranteed returns on the daily selection of "Diamonds in the Rough."
Regarding BUY/SELL Signals: The signal status reported herein is based upon mechanical trading model signals and crossovers. They define the implied bias of the price index/stock based upon moving average relationships and momentum, but they do not necessarily call for a specific action. They are information flags that should prompt chart review. Further, they do not call for continuous buying or selling during the life of the signal. For example, a BUY signal will probably (but not necessarily) return the best results if action is taken soon after the signal is generated. Additional opportunities for buying may be found as price zigzags higher, but the trader must look for optimum entry points. Conversely, exit points to preserve gains (or minimize losses) may be evident before the model mechanically closes the signal.
Helpful DecisionPoint Links:
Price Momentum Oscillator (PMO)
Swenlin Trading Oscillators (STO-B and STO-V)
For more links, go to DecisionPoint.com