
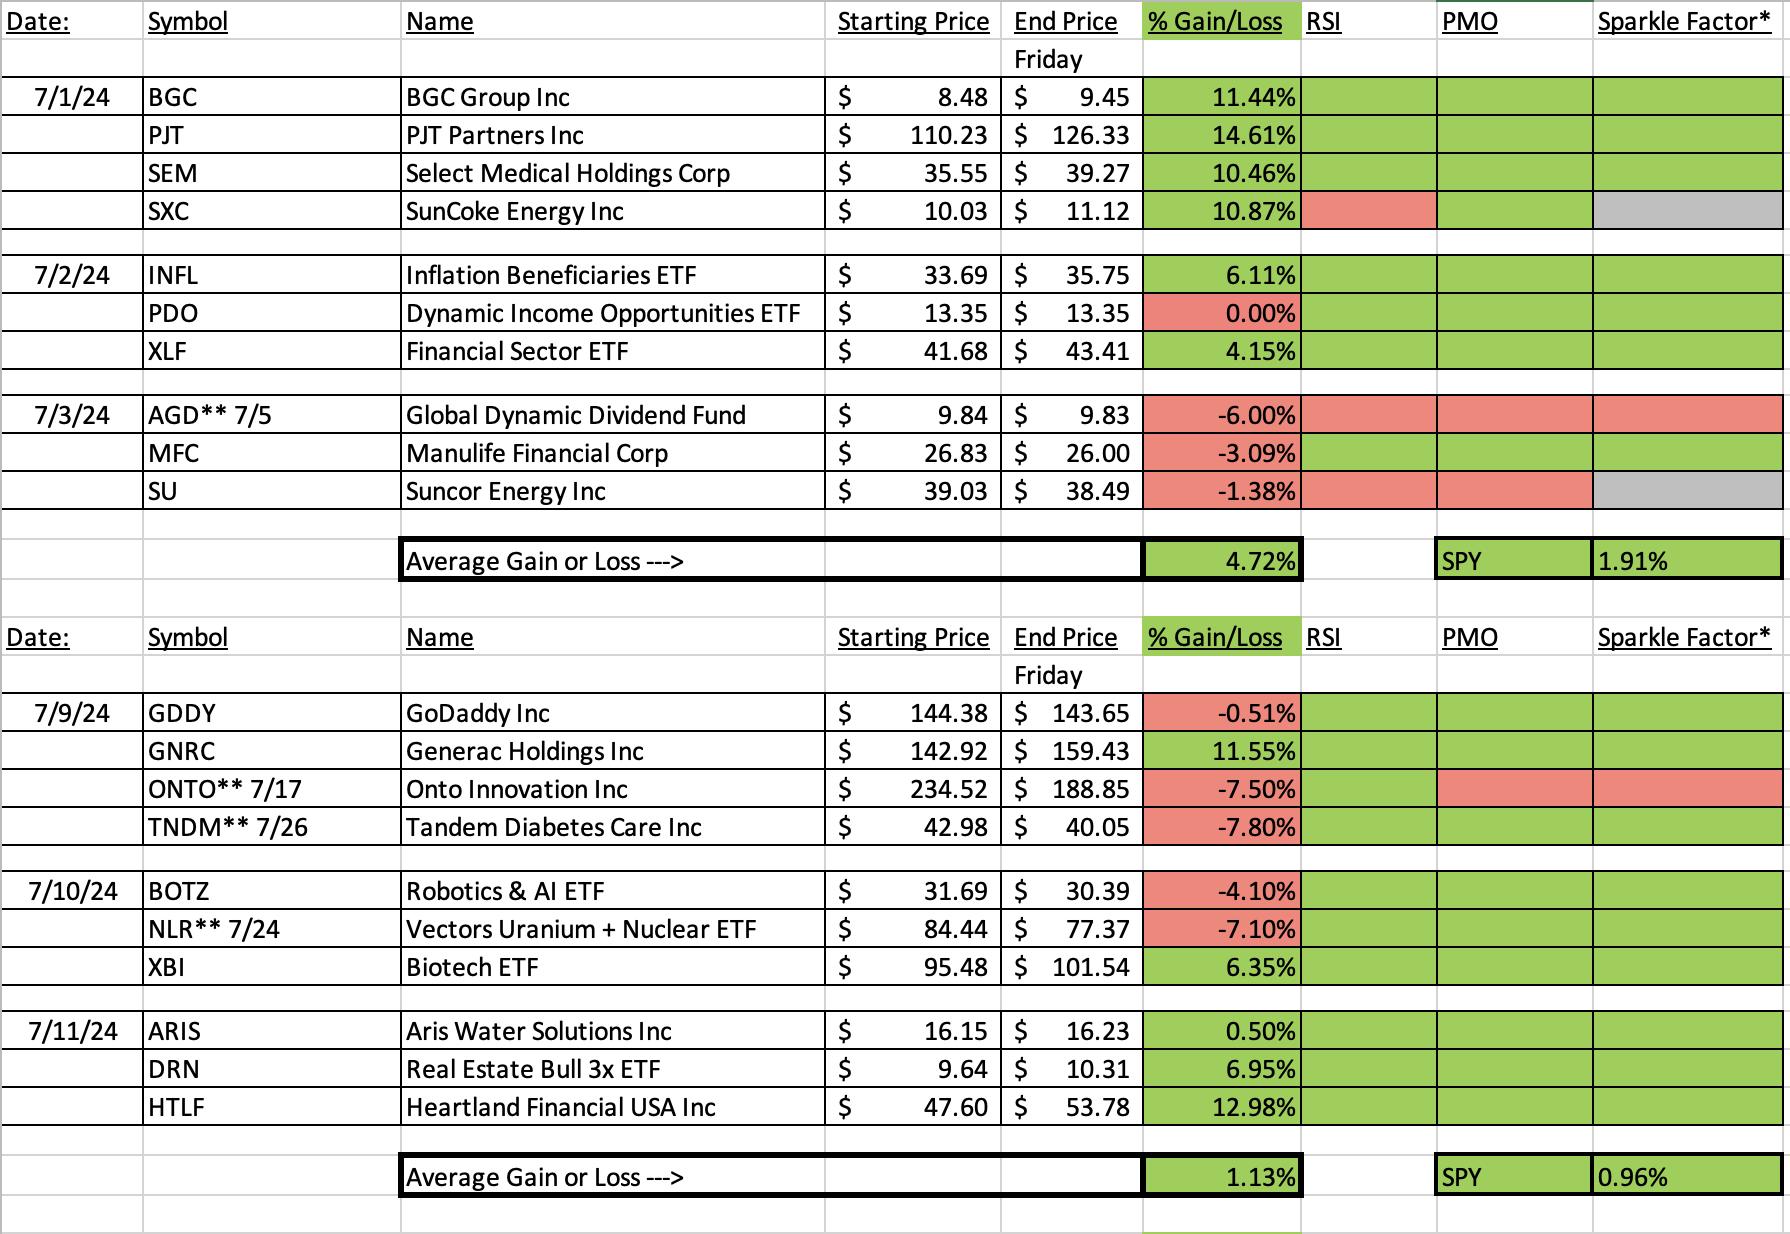
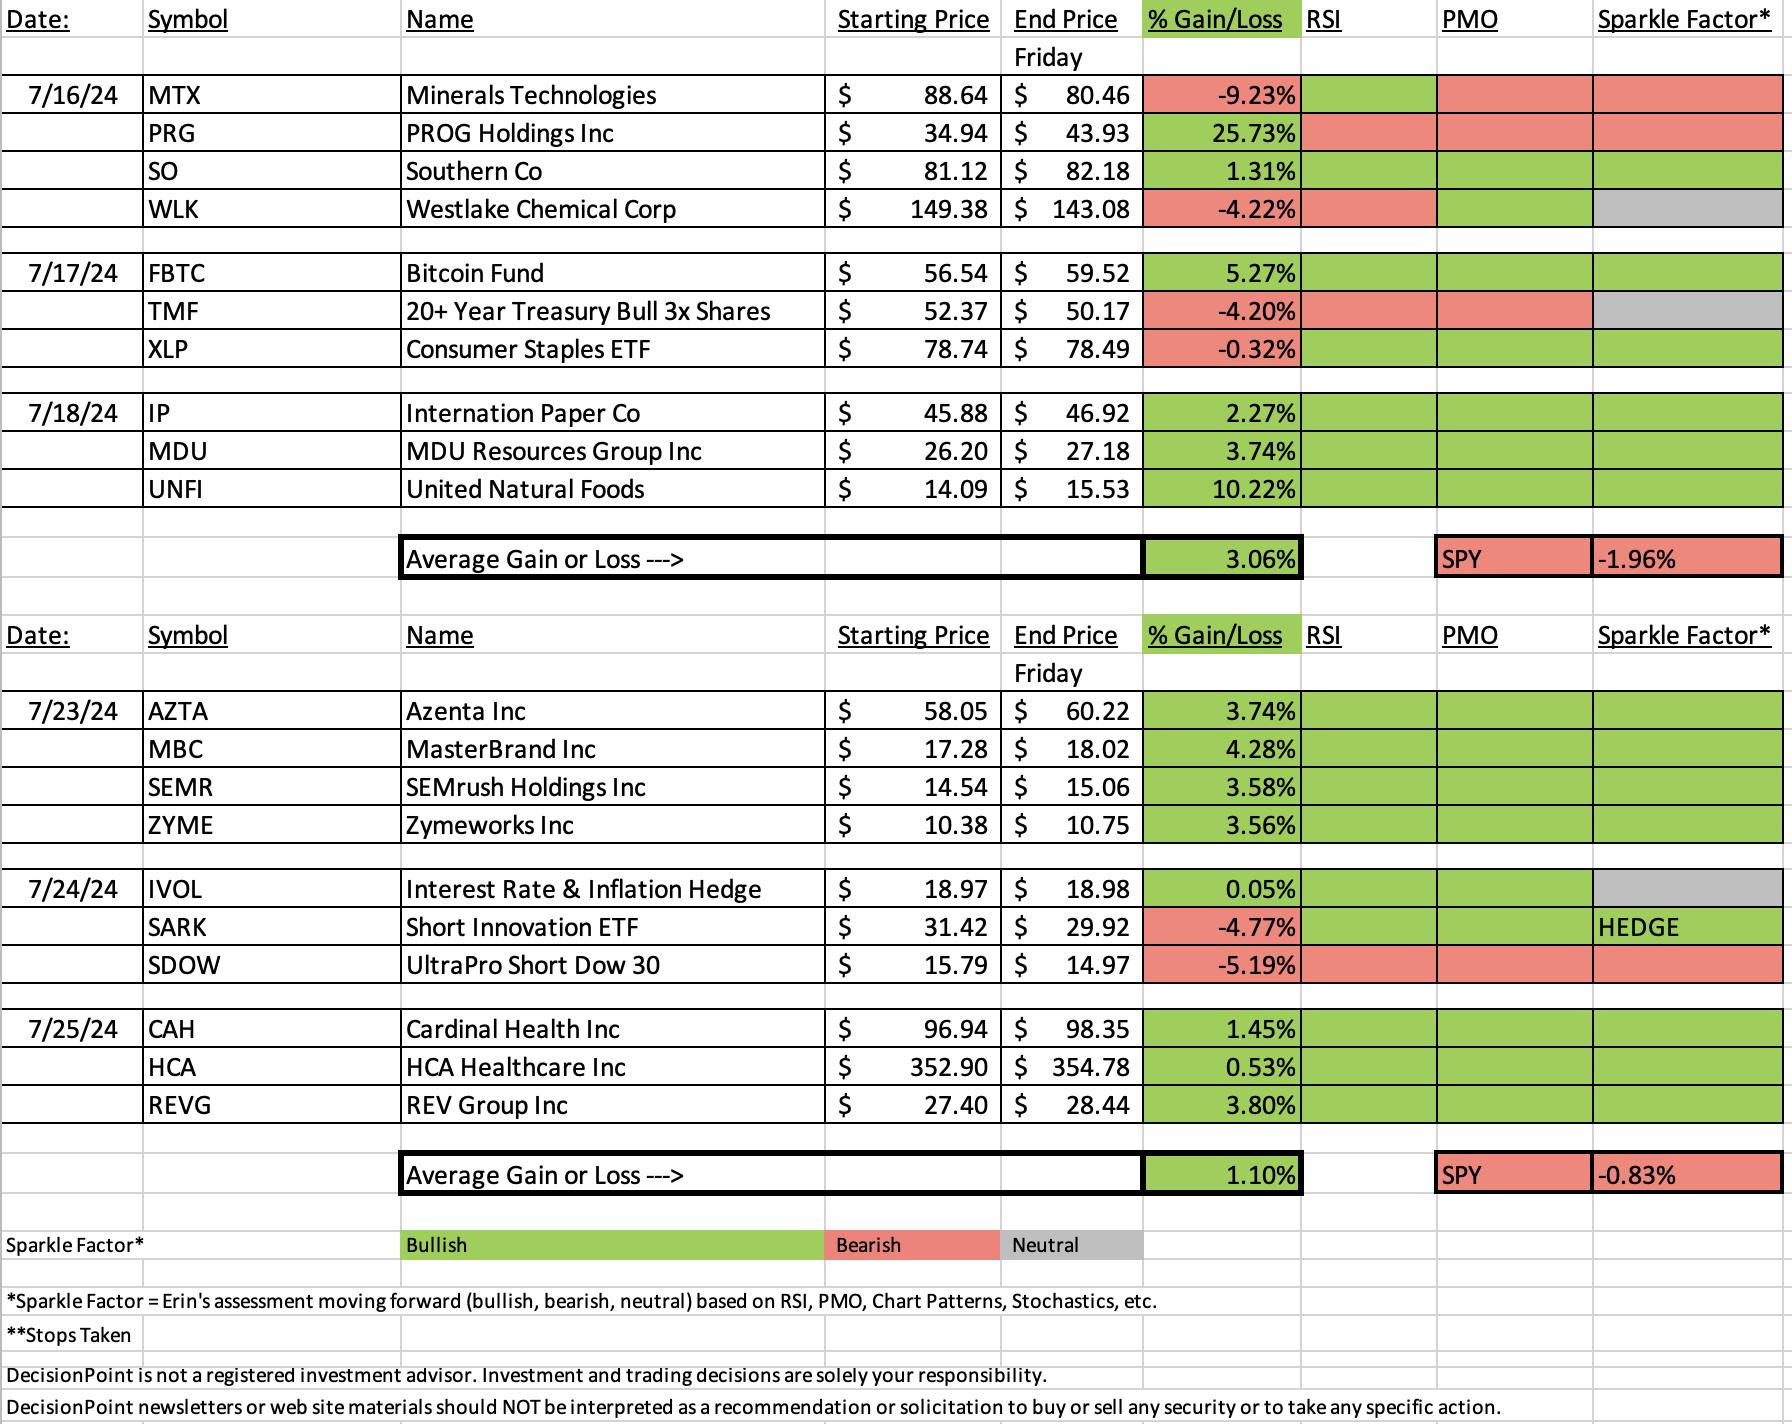
I suspect it would have been a completely winning week had we not included two hedge positions. But, I think hedges are not a bad idea given the continued weakness of mega-cap names. Many will be reporting next week and it is not a lock that they will all be received well. The Fed will make its rate announcement next week. Language that infers a September rate cut will likely see a positive move in the market, but I don't know that it will be enough. It will be an interesting week!
This week's Darling was up +4.28% and this week's Dud was down -5.19%, but remember it was a hedge.
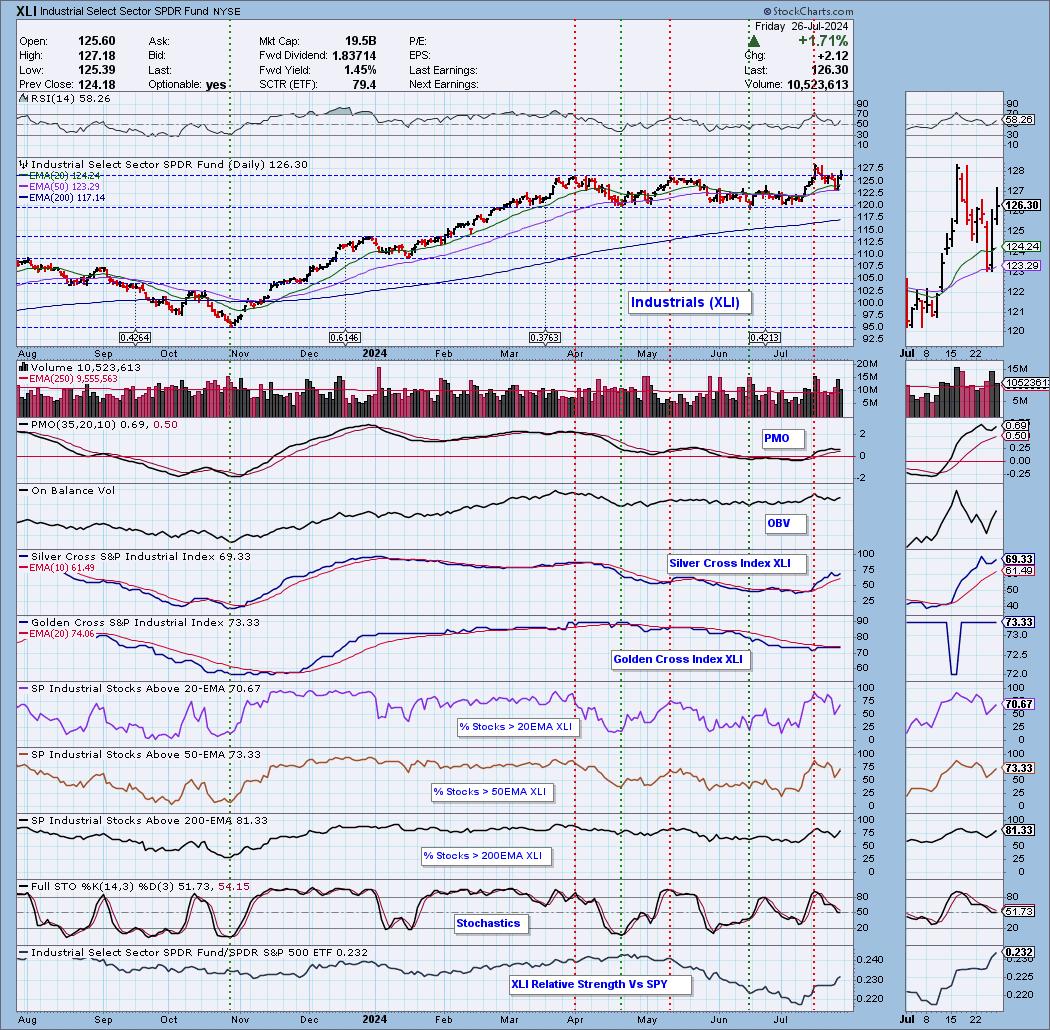
The Sector to Watch was narrowed down XLI and XLF. Both should do well on any rate cut discussion next week. I opted to go with XLI.
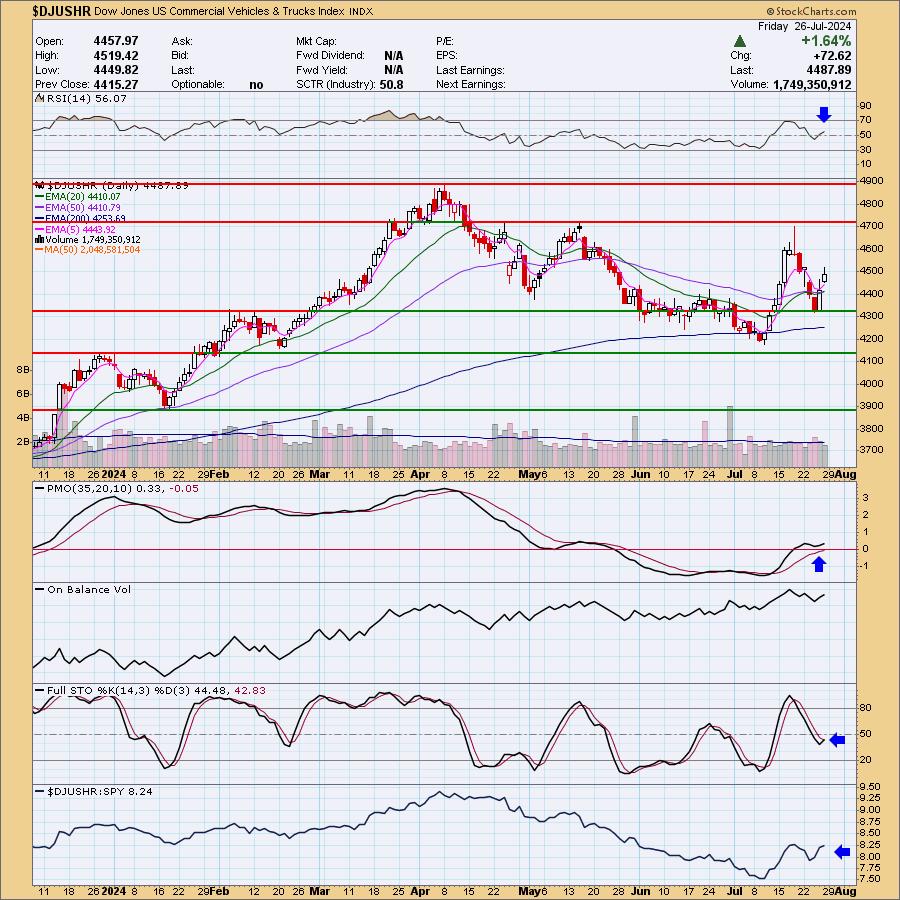
The Industry Group to Watch was Commercial Vehicles. The members of the group were getting a bit extended, but I did find some interesting symbols for your consideration: FSS, TNC, HY, TEX and ACA.
I ran quite a few scans at the end of today's trading room and managed to find quite a few symbols to watch next week: MCK, KNSL, RJF, AVAV, EXEL and GGG.
Have a great weekend! See you in the Monday trading room!
Good Luck & Good Trading,
Erin

Diamond Mine Trading Room:
RECORDING & DOWNLOAD LINK (7/26/2024):
Topic: DecisionPoint Diamond Mine (7/26/2024) LIVE Trading Room
Download & Recording Link HERE
Passcode: July#26th
REGISTRATION for 8/2/2024:
When: August 2, 2024 09:00 AM Pacific Time (US and Canada)
Topic: DecisionPoint Diamond Mine LIVE Trading Room
Register in advance for this webinar HERE
After registering, you will receive a confirmation email containing information about joining the webinar.

Below is the latest free DecisionPoint Trading Room recording from 7/22. You'll find these recordings posted on Mondays to our DP YouTube Channel. Be sure and subscribe HERE.
A few items about the spreadsheet: I've put on the spreadsheet whether the RSI is positive (green) or negative (red). The PMO column tells you if it is rising (green) or falling (red). Finally I've added my own "Sparkle Factor" that gives you my assessment going forward, bullish (green), bearish (red) or neutral (gray). The Sparkle Factor is basically my thoughts on whether I expect it to rise or fall. A neutral means it could really go either way so it could be added to a watch list. If you're in a stock I consider "neutral" going forward, the ball is in your court.
Darling:
MasterBrand, Inc. (MBC)
EARNINGS: 2024-08-06 (AMC)
MasterBrand, Inc. engages in the business of manufacturing residential cabinets. Its product portfolio includes residential cabinetry products for the kitchen, bathroom, and other parts of the home. The company was founded in June 1954 and is headquartered in Beachwood, OH.
Predefined Scans Triggered: Moved Above Upper Keltner Channel, Moved Above Ichimoku Cloud.
Below are the commentary and chart from Tuesday, 7/23:
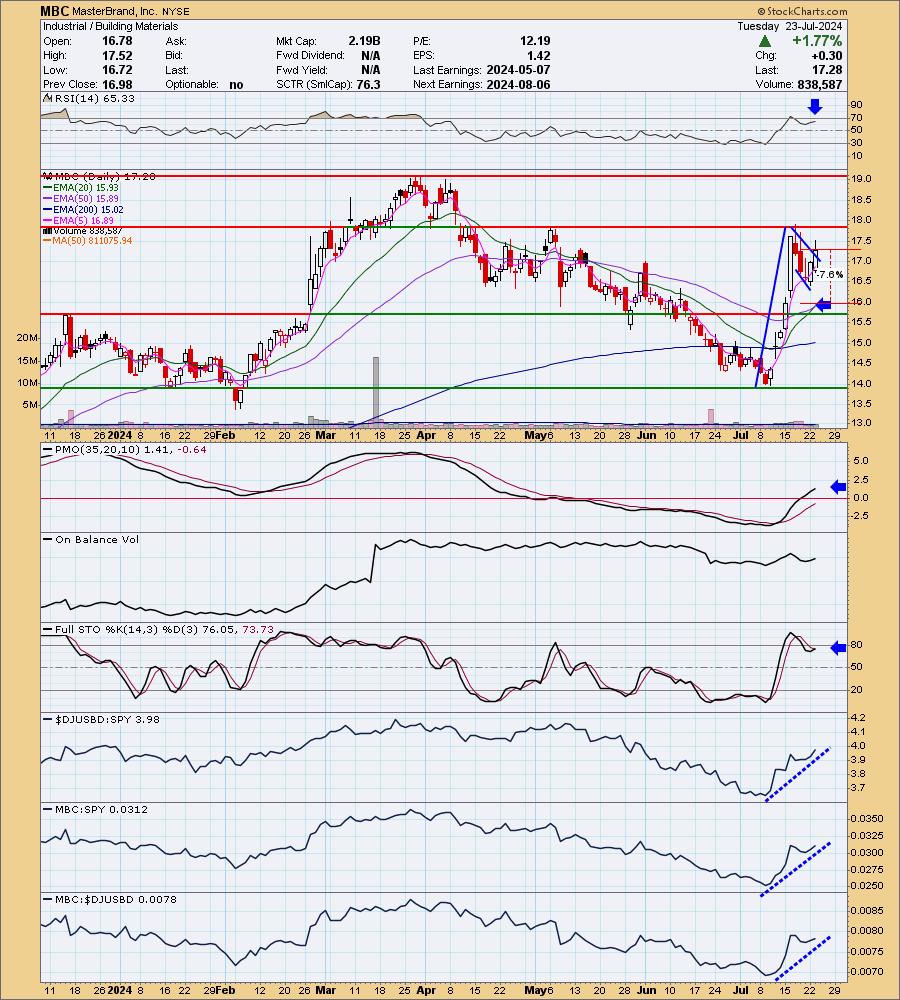
"MBC is unchanged in after hours trading. Here we have another Silver Cross IT Trend Model BUY Signal. I very much like the bull flag formation that has been confirmed with a breakout today. The RSI is not overbought and the PMO is rising above the zero line. Stochastics have also tipped back up. Relative strength is excellent across the board. The stop is set beneath the flag toward the 20/50-day EMAs at 7.6% or $15.96."
Here is today's chart:
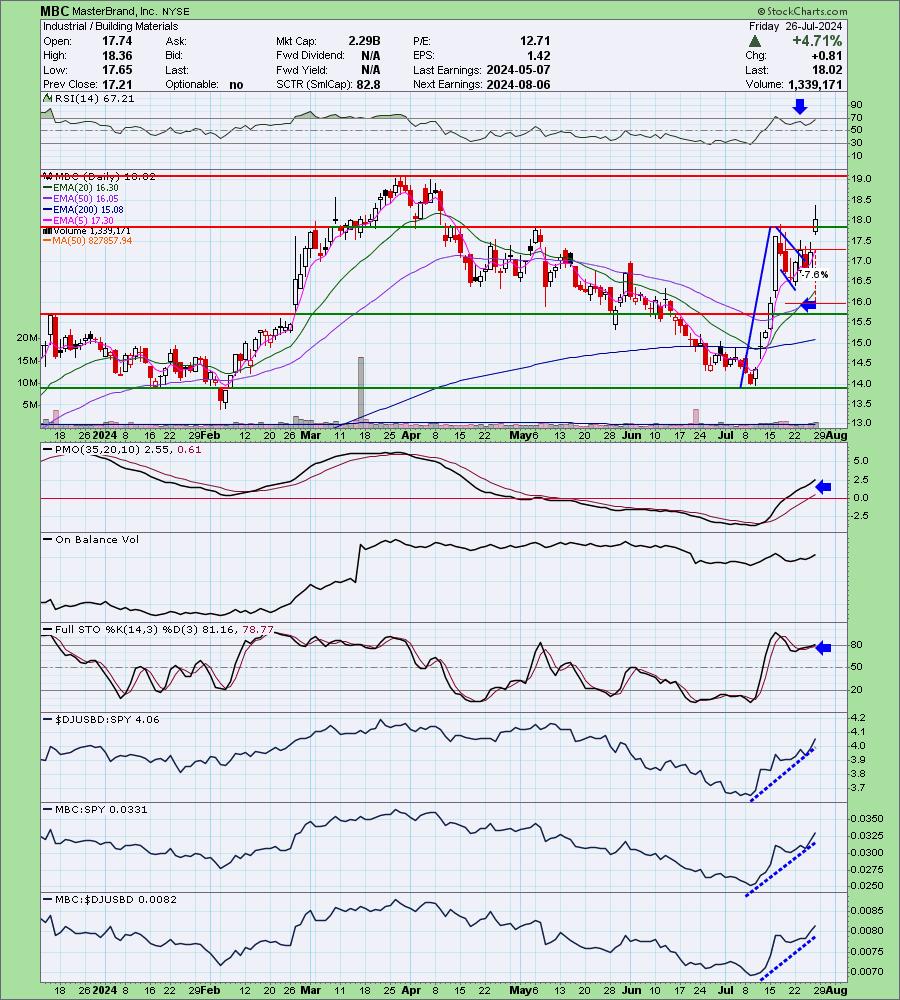
Today saw a beautiful breakaway gap that suggests MBC has further to fly. The minimum upside target of the bull flag would be almost $22 so this certainly has room to run higher. What went right? The bull flag executed as expected. Chart patterns are very helpful and very often tell us where we can expect price to go. This was a good example. I will also say that this industry group looks very bullish.
Don't forget, on Thursdays I look at reader-requested symbols, so shoot me an email at erin@decisionpoint.com. I read every email I receive and try to answer them all!
Dud:
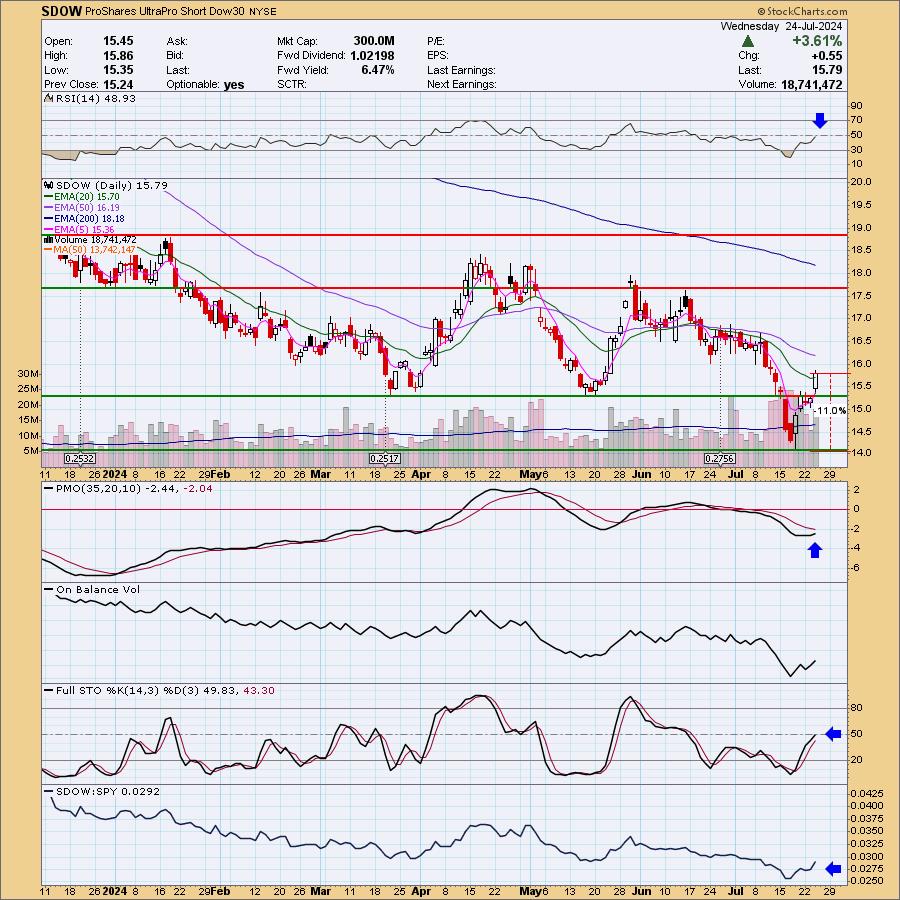
ProShares UltraPro Short Dow30 (SDOW)
EARNINGS: N/A
SDOW provides 3x inverse exposure to the price-weighted Dow Jones Industrial Average, which includes 30 of the largest US companies.
Predefined Scans Triggered: P&F Double Bottom Breakdown, Elder Bar Turned Green, Parabolic SAR Buy Signals and P&F Triple Bottom Breakdown.
Below are the commentary and chart from Wednesday, 7/24:
"SDOW is down -0.51% in after hours trading. We have a nice breakout above overhead resistance today. As mentioned above, we could see some buying tomorrow, but this is a good place to consider a hedge. Smaller-caps have mostly held up and these are the mega-caps that are weakening. The RSI is about to enter positive territory. The PMO is turning back up toward a Crossover BUY Signal. Stochastics are almost in positive territory as well. With the weak market this one is showing very good relative strength. The stop has to be set deeply given this is leveraged 3x. I've listed it at 11% or $14.05."
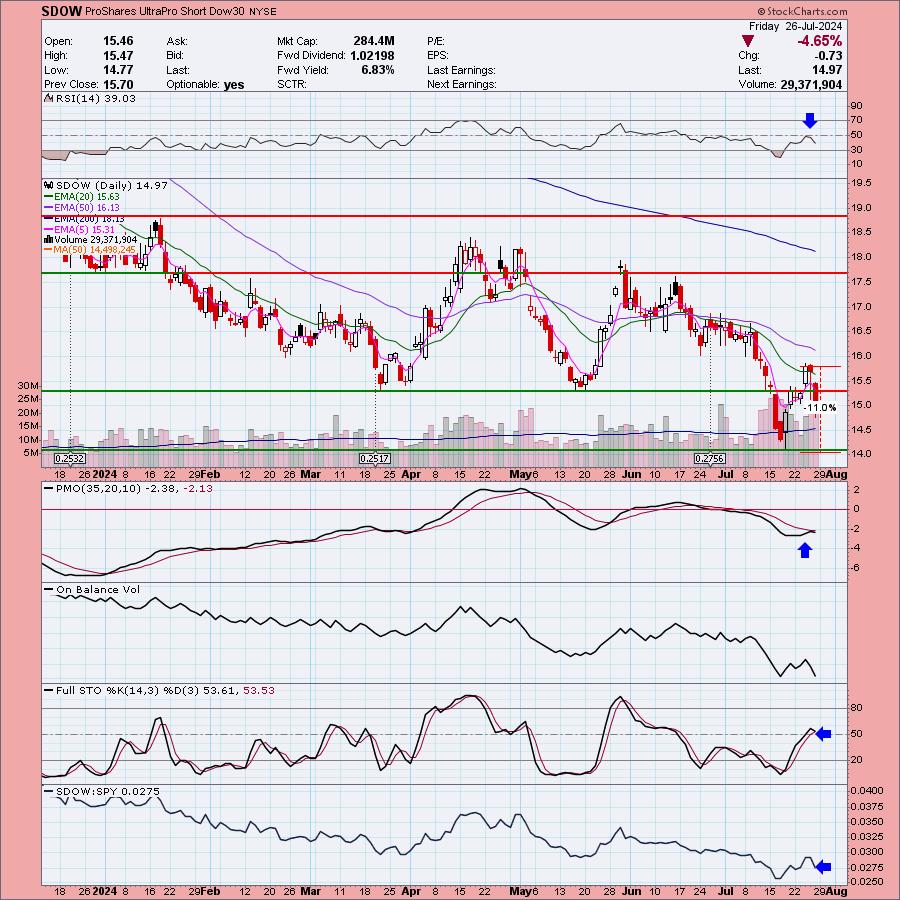
Here is today's chart:
What went wrong here. The market decided to snap back after the deep decline on Wednesday. I still think hedging isn't a bad idea, but this hedge is likely not a good choice, particularly given the Industrials sector (XLI) is looking so bullish. The PMO has topped beneath the signal line whereas our other hedge, SARK, still has a rising PMO.
THIS WEEK's Performance: 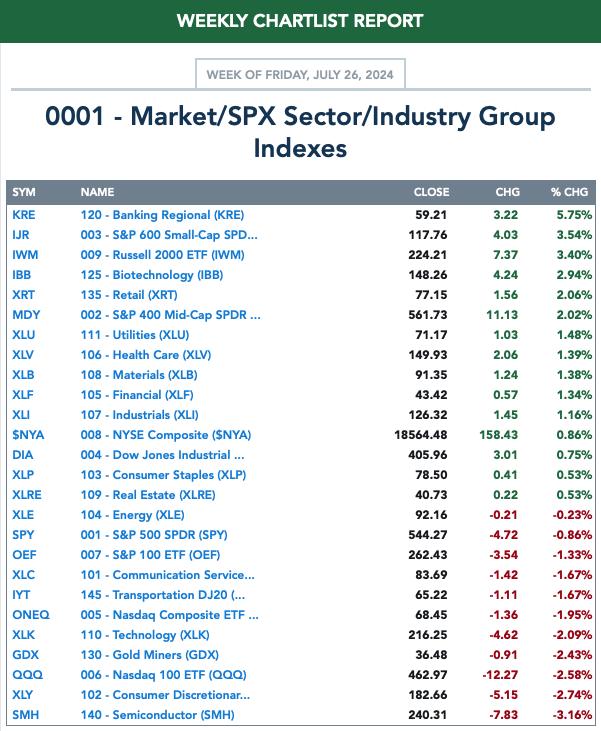
DecisionPoint Market Scoreboard (Mechanical Trend Model Signals): 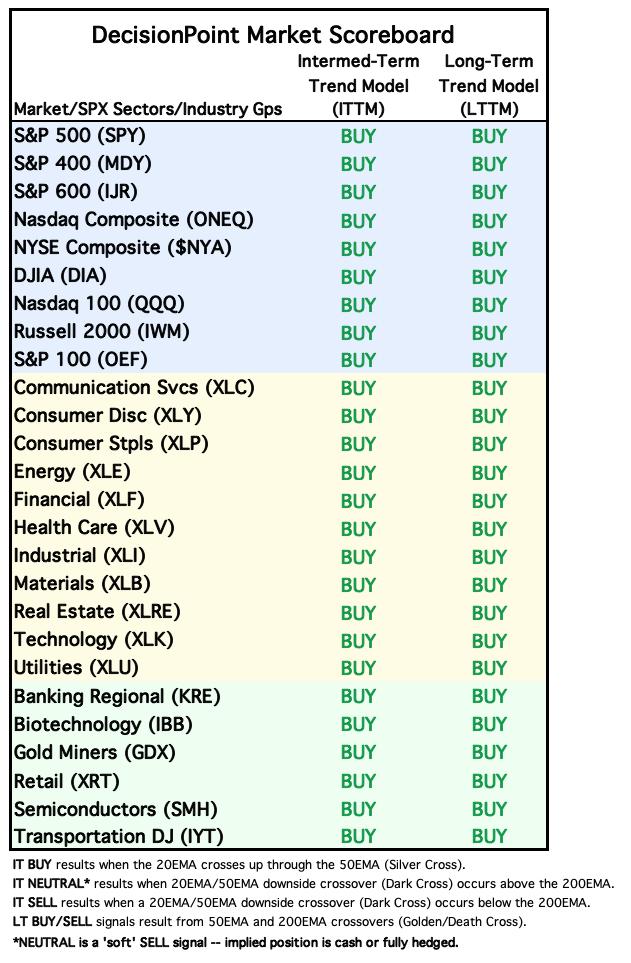
Friday signal changes are outlined in purple.
Click Here to view Carl's annotated "Under the Hood" ChartList!
Sector to Watch: Industrials (XLI)
I picked XLI partly because I noted that it had an opportunity to expand participation. And after the close it did expand. We have a PMO that is surging above the signal line and a positive RSI. The Silver Cross Index has turned back up. Stochastics are underwhelming right now, but relative strength looks very good. This breakout from the very short-term declining trend looks credible.
Industry Group to Watch: Commercial Vehicles ($DJUSCX)
I liked the breakout from the steep declining trend and the bounce off support. The RSI is not overbought and the PMO has surged above the signal line. Stochastics have just turned up. As I noted in the opening many of the stocks in this group were on the overbought side, but I did find some that weren't: FSS, TNC, HY, TEX and ACA.
Go to our Under the Hood ChartList on DecisionPoint.com to get an in-depth view of all the sectors. On StockCharts.com you can find the Industry Summary.
Good Luck & Good Trading!
- Erin
erin@decisionpoint.com
Full Disclosure: I'm 45% long, 3% short.
Watch the latest episode of the DecisionPoint Trading Room with Carl & Erin Swenlin on Mondays 3:00p EST!
Technical Analysis is a windsock, not a crystal ball. --Carl Swenlin
NOTE: The stocks reported herein are from mechanical trading model scans that are based upon moving average relationships, momentum and volume. DecisionPoint analysis is then applied to get selections from the scans. The selections given should prompt readers to do a chart review using their own analysis process. This letter is not a call for a specific action to buy, sell or short any of the stocks provided. There are NO sure things or guaranteed returns on the selection of "diamonds in the rough."
Helpful DecisionPoint Links:
DecisionPoint Shared ChartList and DecisionPoint Chart Gallery
Price Momentum Oscillator (PMO)
Swenlin Trading Oscillators (STO-B and STO-V)
(c) Copyright 2024 DecisionPoint.com