
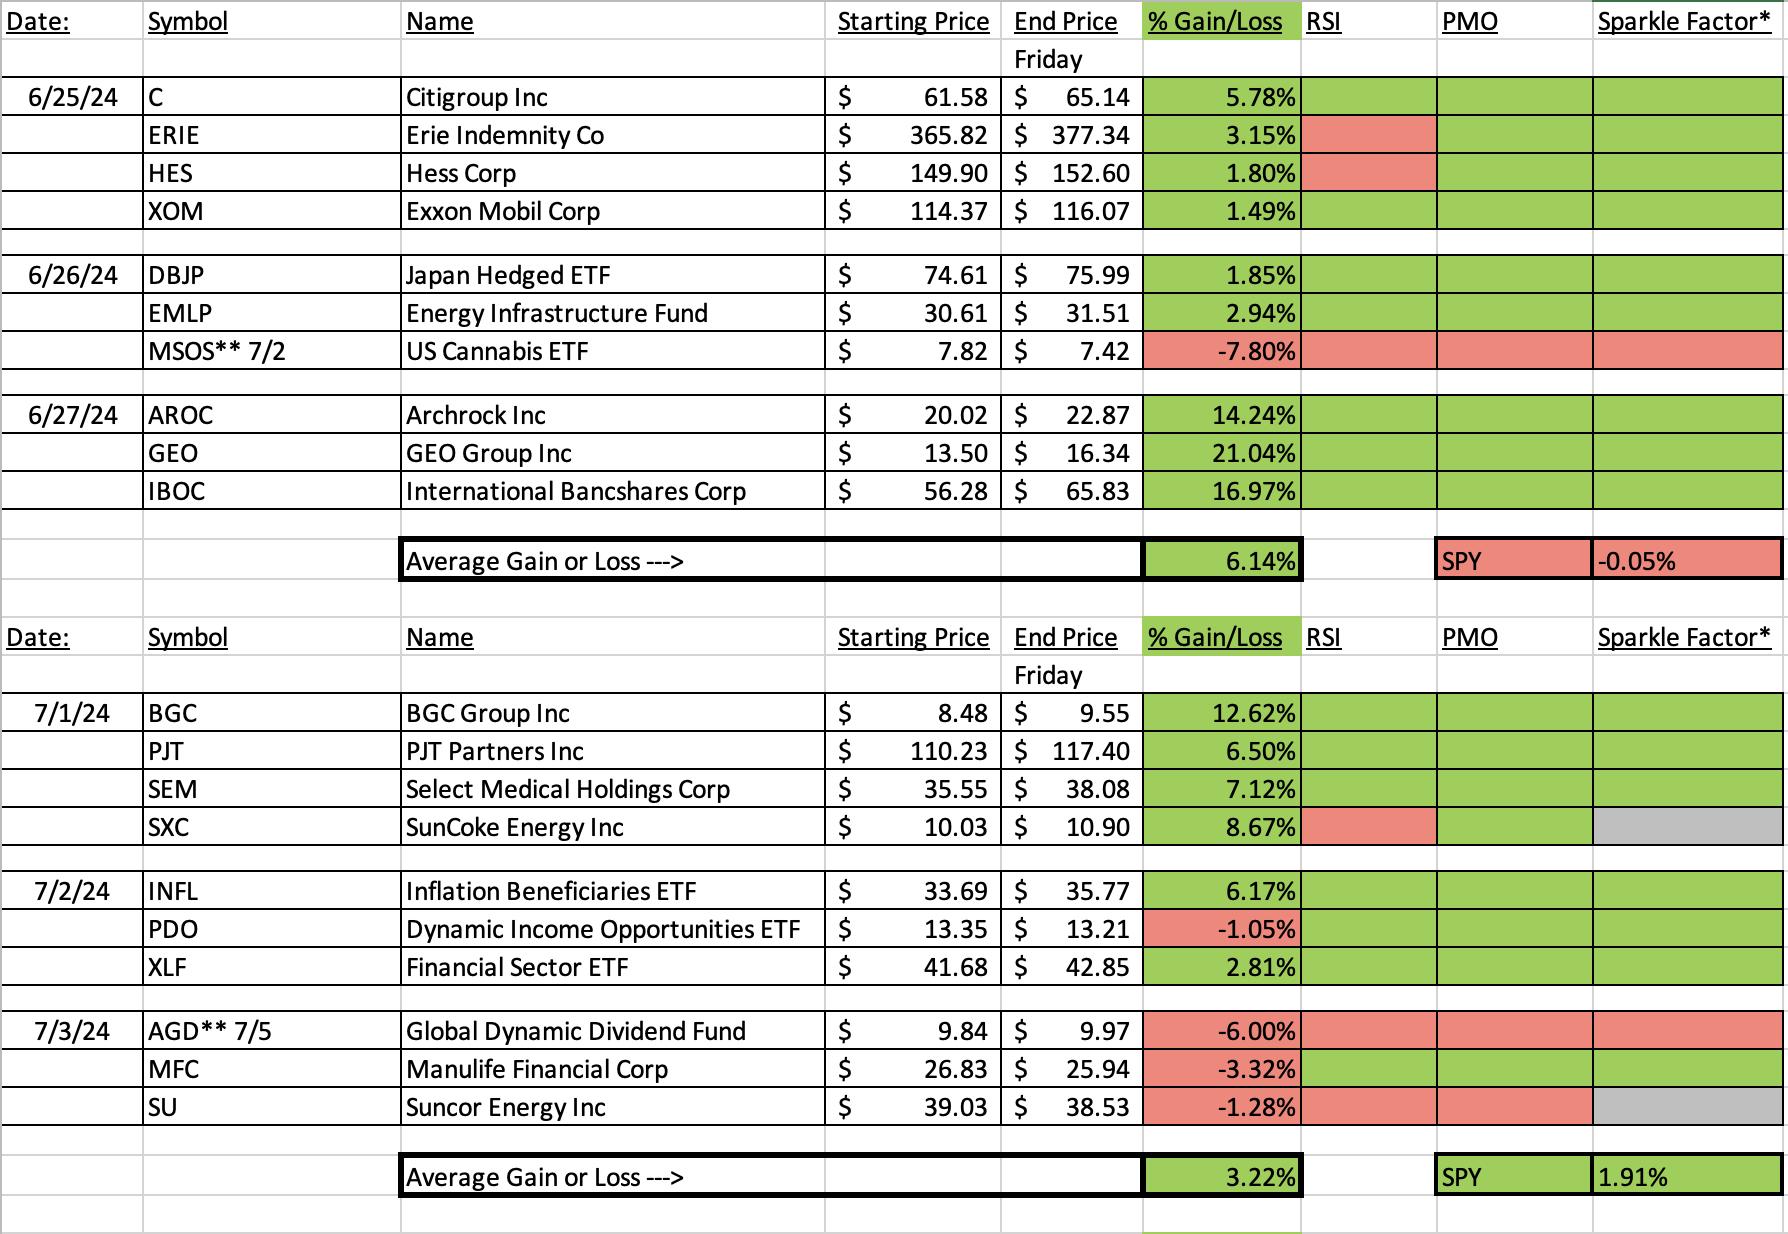
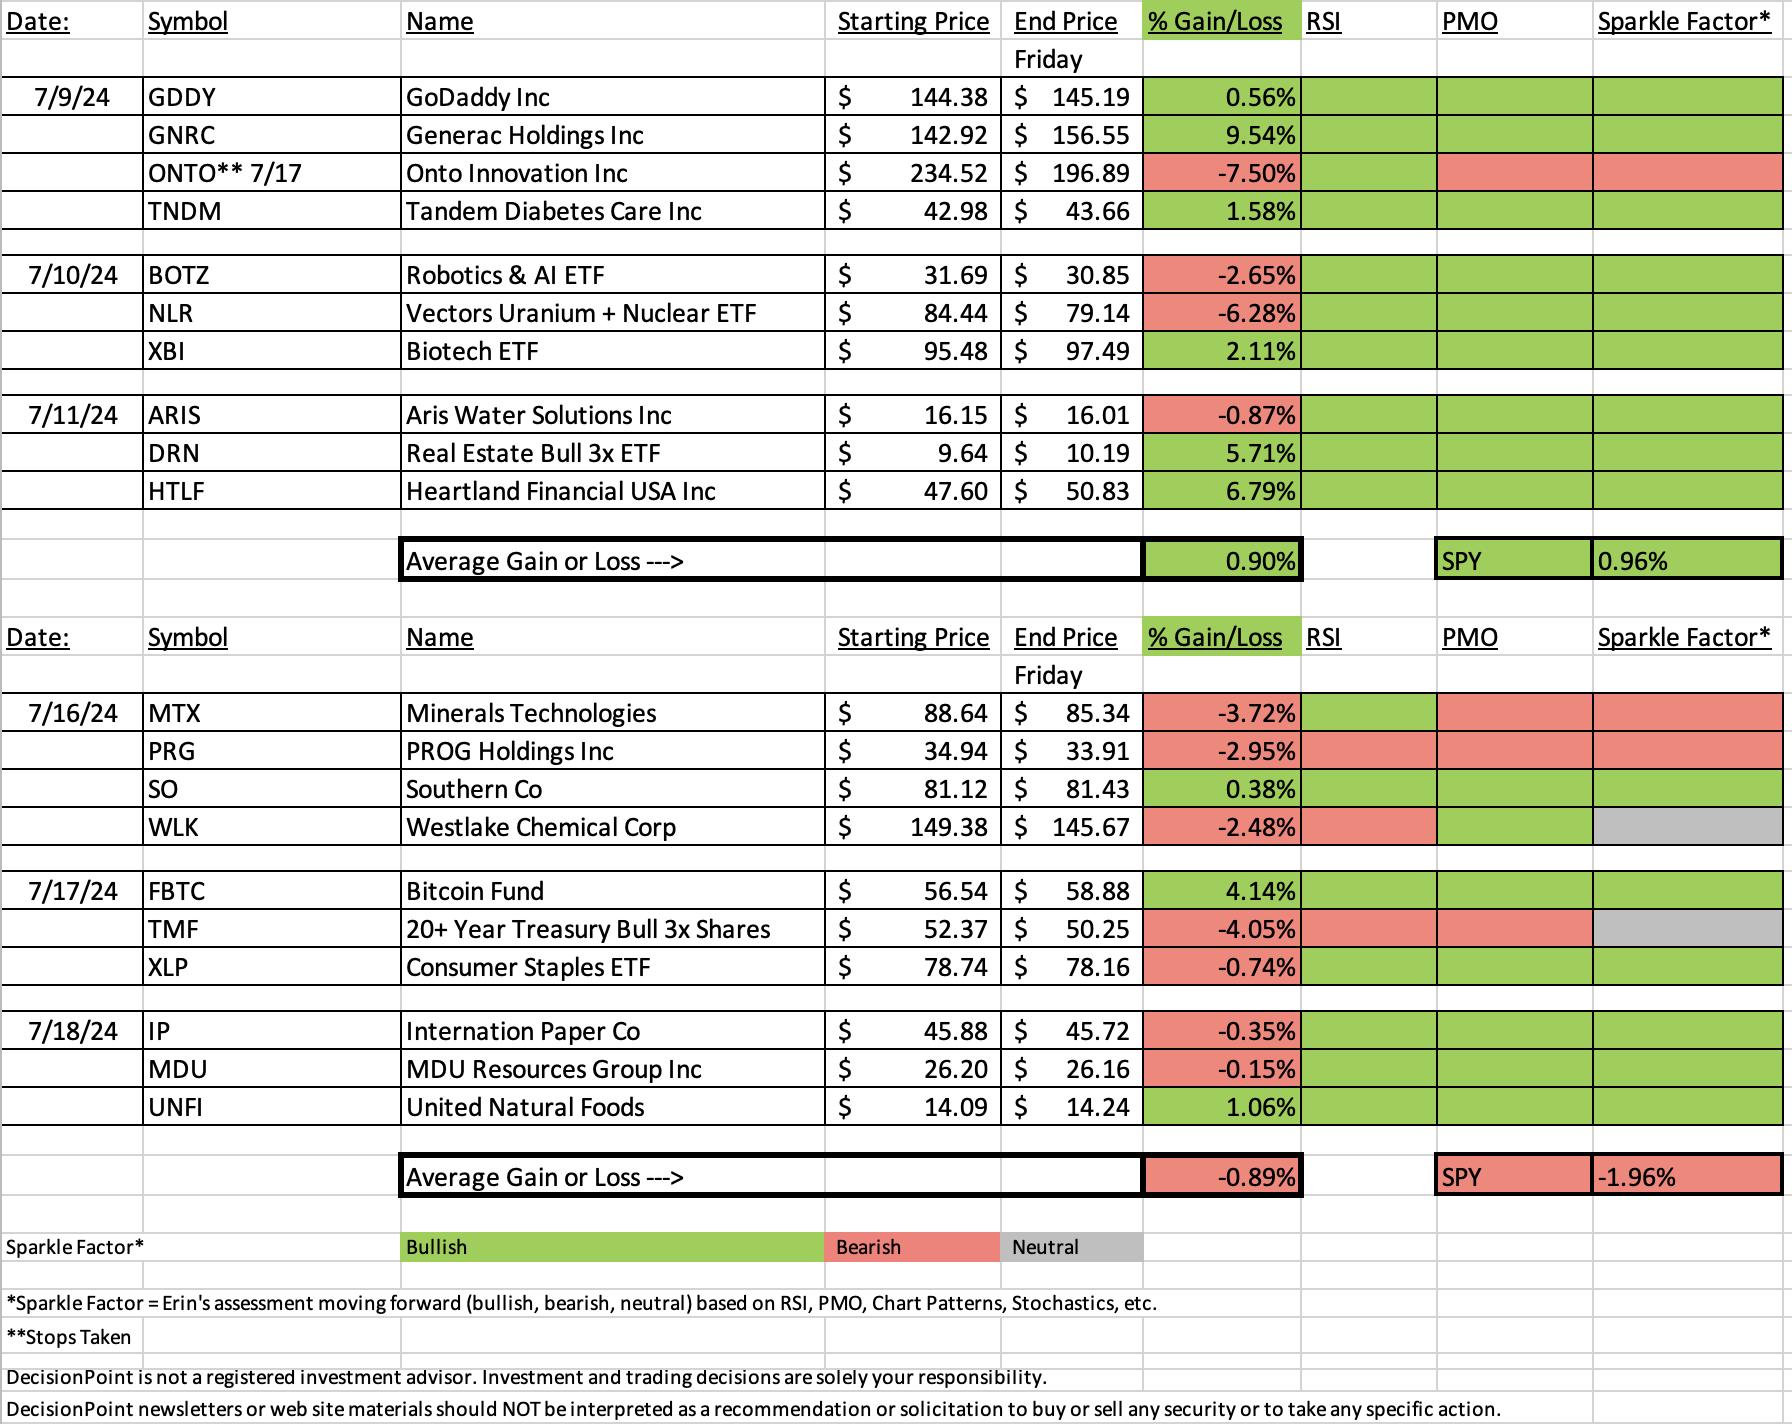
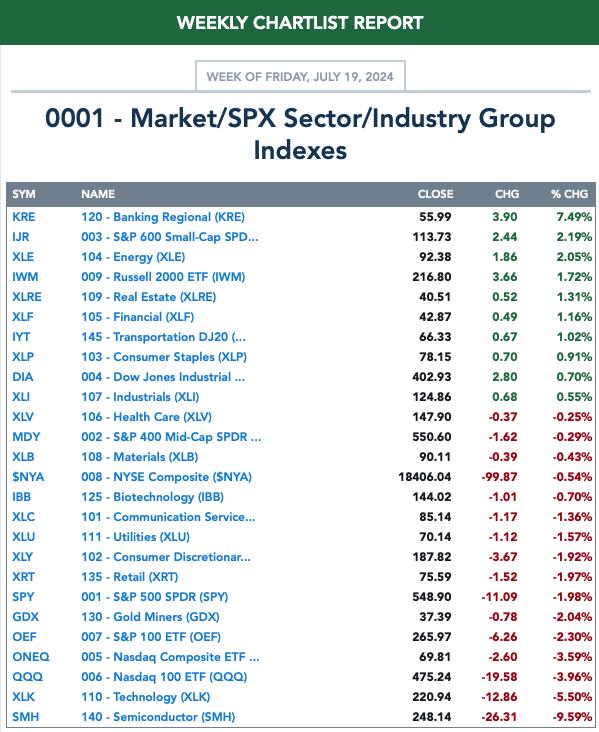
I'm not thrilled with the performance of "Diamonds in the Rough" this week, but at least we can say that we beat the benchmark by over 1%. Unfortunately, we averaged lower on the week too.
What went wrong? Chemical companies did not perform as I thought they would and I had two of them on Tuesday. Interest rates flipped on us making the Bond fund this week's "Dud". The rest of the choices weren't that bad, but I'm not happy with the red on the spreadsheet. That could firm up as we move forward, but given market weakness overall, we may not see the type of returns we want. I'm keeping exposure low.
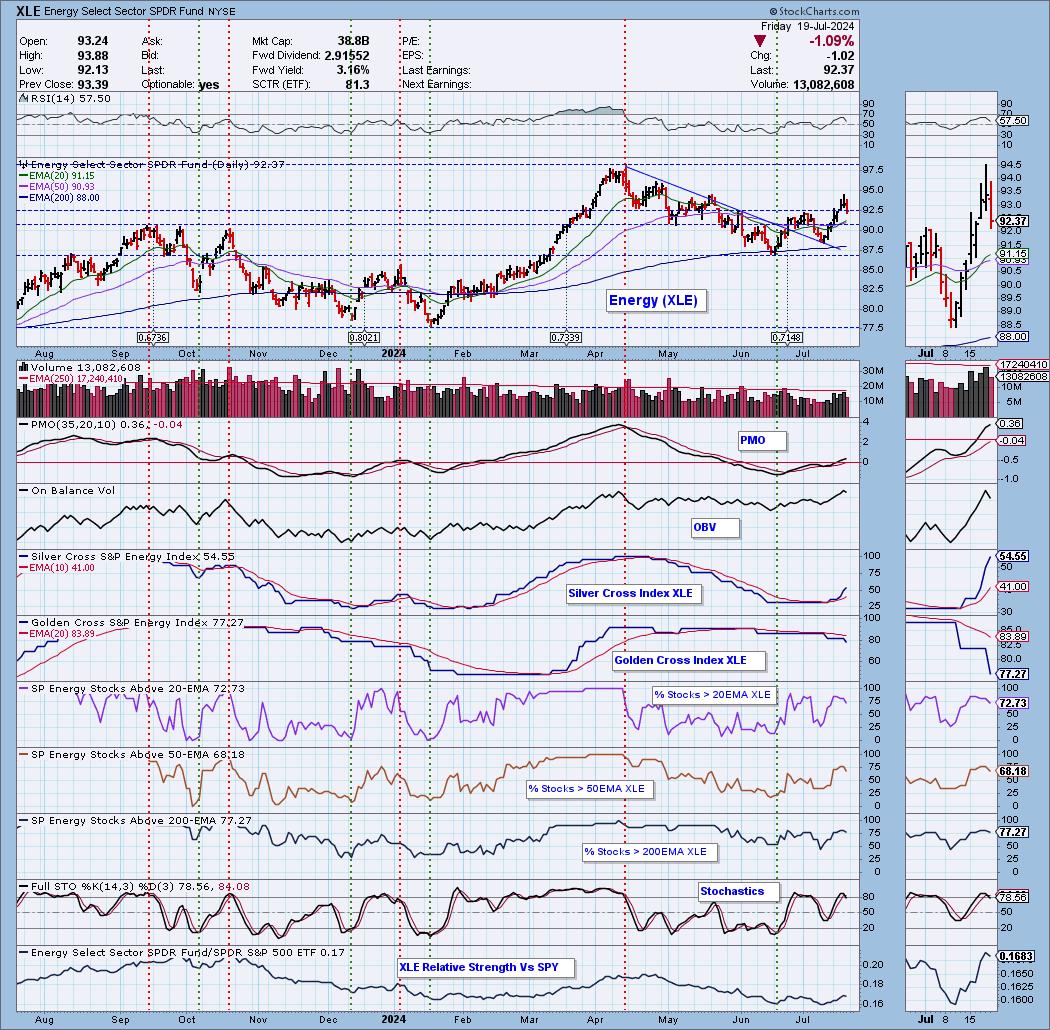
The Sector to Watch was a toss up between Energy (XLE) and Real Estate (XLRE). Either could've been chosen, but I ultimately went with Energy as it had a higher StockCharts Technical Rank (SCTR). There is room for improvement on XLE while XLRE has already been clicking. I'm looking for the Crude Oil trade to firm up and that will likely help Energy.
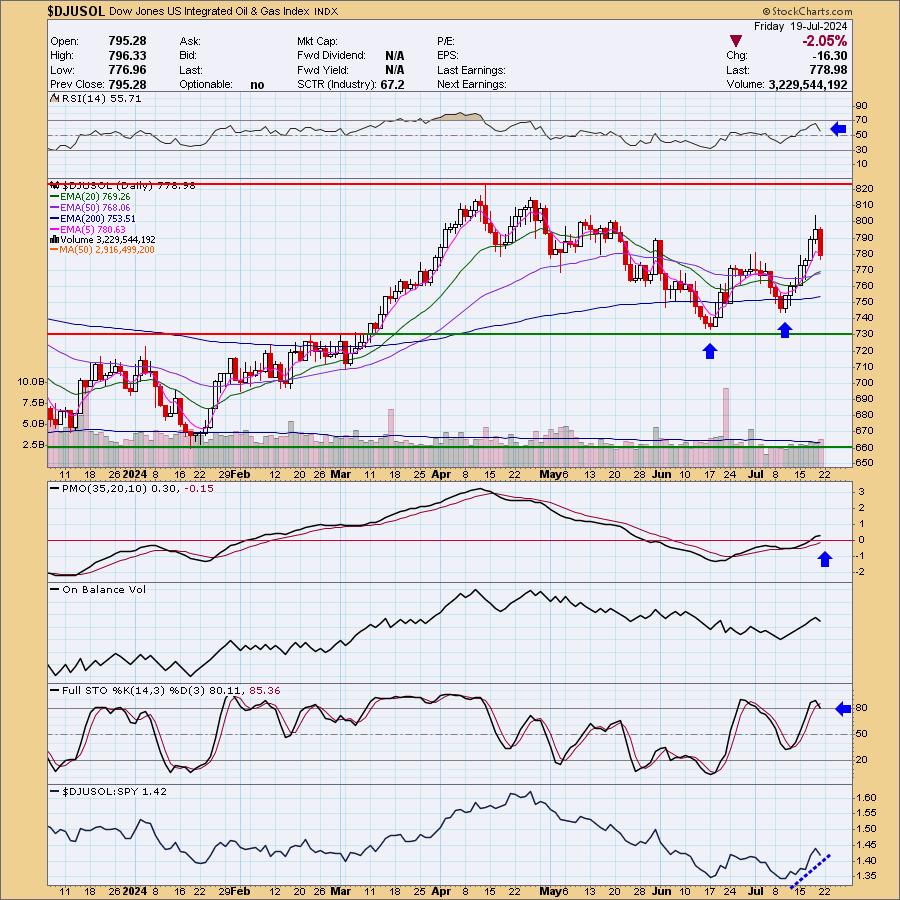
The Industry Group to Watch was Integrated Oil & Gas. This will hinge somewhat on Oil prices, but the double bottom setup was hard to resist. Symbols of interest in this area are: EE, SU, XOM, HES and CVX.
I had time to run scans at the end of the program. I had run them yesterday and scans don't update until the end of the trading day. I already gave you some runner-up symbols yesterday but today in particular I liked: HCA, CLW, AVB, ESS and KD.
Have a great weekend! See you in the Monday trading room!
Good Luck & Good Trading,
Erin

Diamond Mine Trading Room:
RECORDING & DOWNLOAD LINK (7/19/2024):
Topic: DecisionPoint Diamond Mine (7/19/2024) LIVE Trading Room
Download & Recording Link HERE
Passcode: July#19th
REGISTRATION for 7/26/2024:
When: July 26, 2024 09:00 AM Pacific Time (US and Canada)
Topic: DecisionPoint Diamond Mine LIVE Trading Room
Register in advance for this webinar HERE
After registering, you will receive a confirmation email containing information about joining the webinar.

Below is the latest free DecisionPoint Trading Room recording from 7/15. You'll find these recordings posted on Mondays to our DP YouTube Channel. Be sure and subscribe HERE.
A few items about the spreadsheet: I've put on the spreadsheet whether the RSI is positive (green) or negative (red). The PMO column tells you if it is rising (green) or falling (red). Finally I've added my own "Sparkle Factor" that gives you my assessment going forward, bullish (green), bearish (red) or neutral (gray). The Sparkle Factor is basically my thoughts on whether I expect it to rise or fall. A neutral means it could really go either way so it could be added to a watch list. If you're in a stock I consider "neutral" going forward, the ball is in your court.
Darling:
Fidelity Wise Origin Bitcoin Fund (FBTC)
EARNINGS: N/A
This product is for investors with a high risk tolerance. It invests in a single asset, bitcoin, which is highly volatile and can become illiquid at any time. Click HERE for more information.
Predefined Scans Triggered: P&F Bearish Signal Reversal and P&F Double Top Breakout.
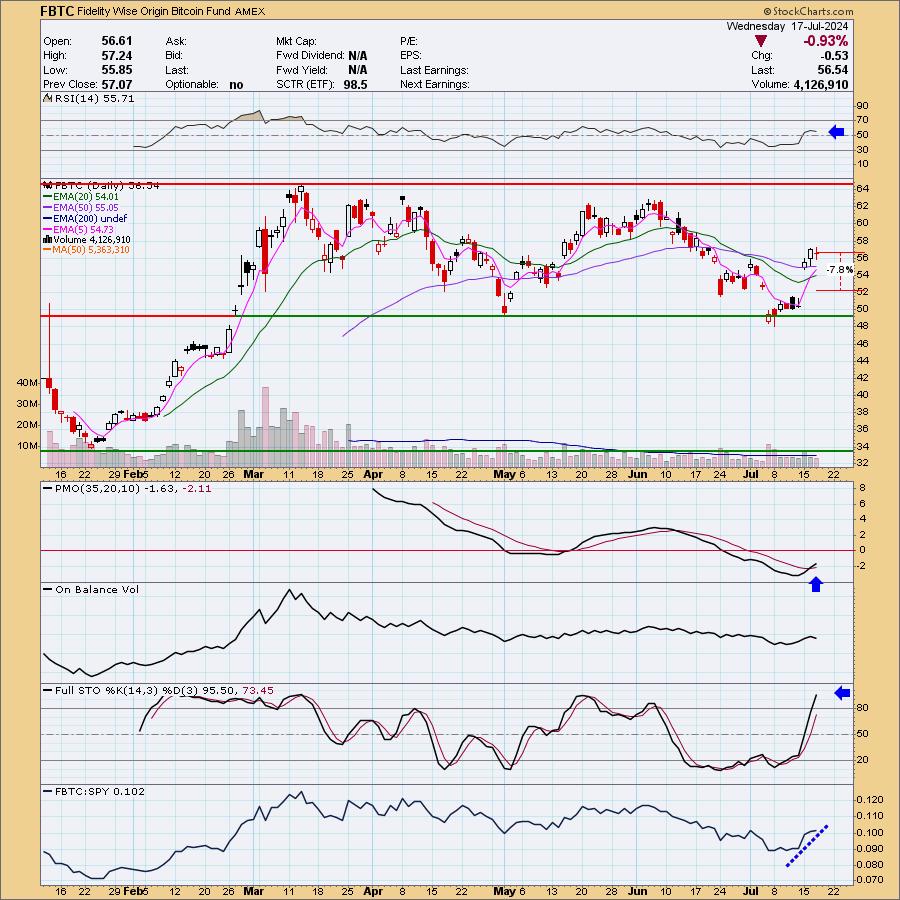
Below are the commentary and chart from Wednesday, 7/17:
"FBTC is down -0.69% in after hours trading. Bitcoin looks ready to make another run at all-time highs. The breakout from the declining trend on a gap up was very bullish. The RSI is in positive territory and is not overbought. The PMO is on a new Crossover BUY Signal. Stochastics are rising well above 80. Bitcoin is currently outperforming the market. I wanted to set the stop below gap support, but it came out too deep so I got as close as I could at 7.8% or $52.12."
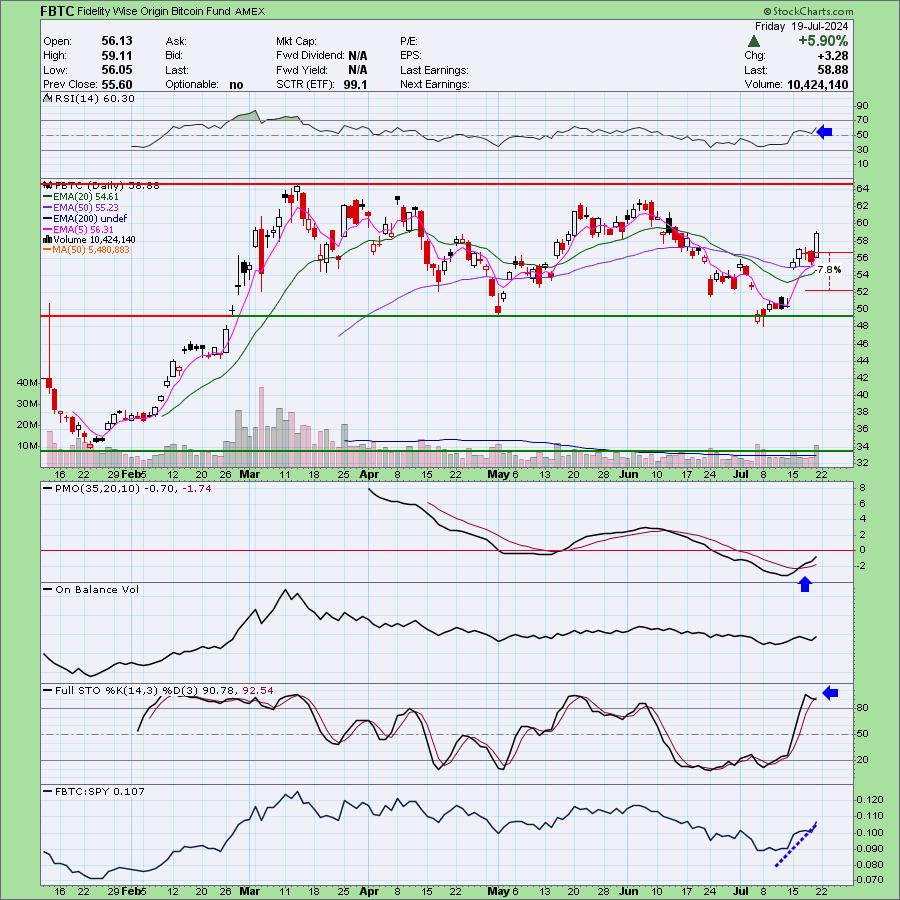
Here is today's chart:
Given I had multiple Bitcoin ETFs to choose from on Wednesday, I had to include one and this one performed admirably today. I would look for price to test all-time highs given the very positive indicators. Best of all, the RSI is still not overbought.
Don't forget, on Thursdays I look at reader-requested symbols, so shoot me an email at erin@decisionpoint.com. I read every email I receive and try to answer them all!
Dud:
Direxion Daily 20+ Year Treasury Bull 3x Shares (TMF)
EARNINGS: N/A
TMF provides 3x daily exposure to a market-value-weighted index of US Treasury Bonds with over 20 years to maturity. Click HERE for more information.
Predefined Scans Triggered: None.
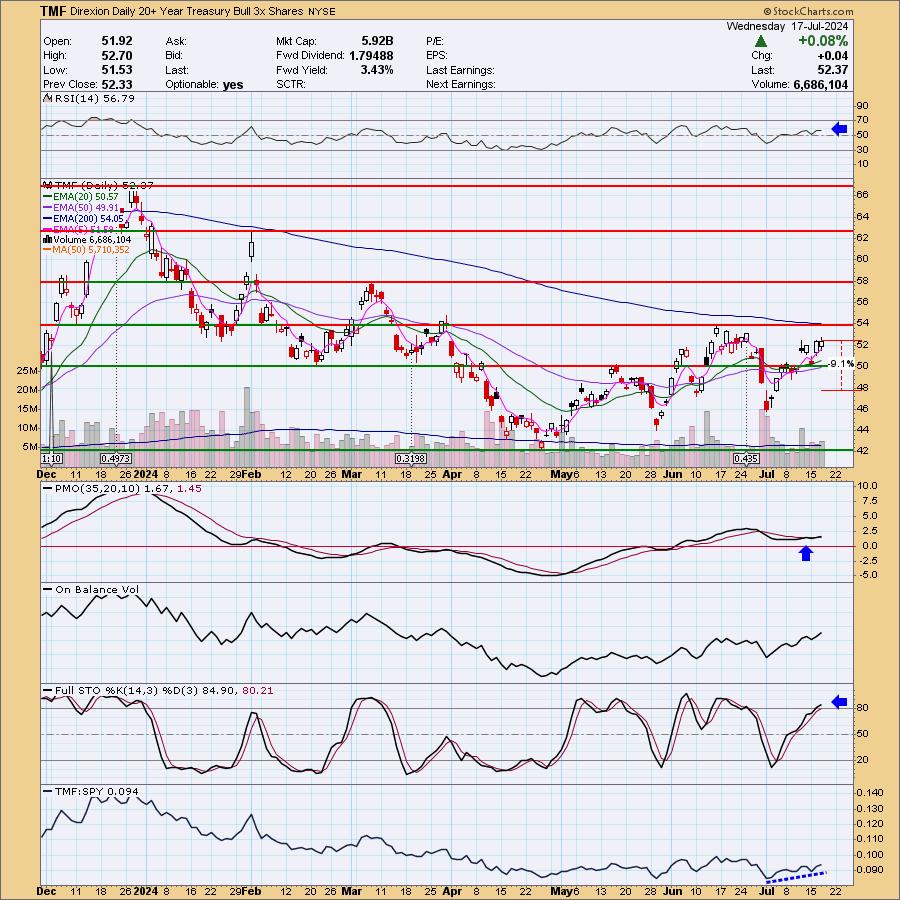
Below are the commentary and chart from Wednesday, 7/17:
"TMF is down -0.32% in after hours trading. As noted in the opening I am a fan of bond funds right now given my bearish outlook on yields. We don't have a breakout yet, but I'm expecting one. The RSI is positive and not overbought. The PMO is on a Crossover BUY Signal and notice the rising OBV. Stochastics are healthy above 80 and relative strength is rising. This is a leveraged ETF so we have to set a deep stop. I opted for 9.1% or $47.60."
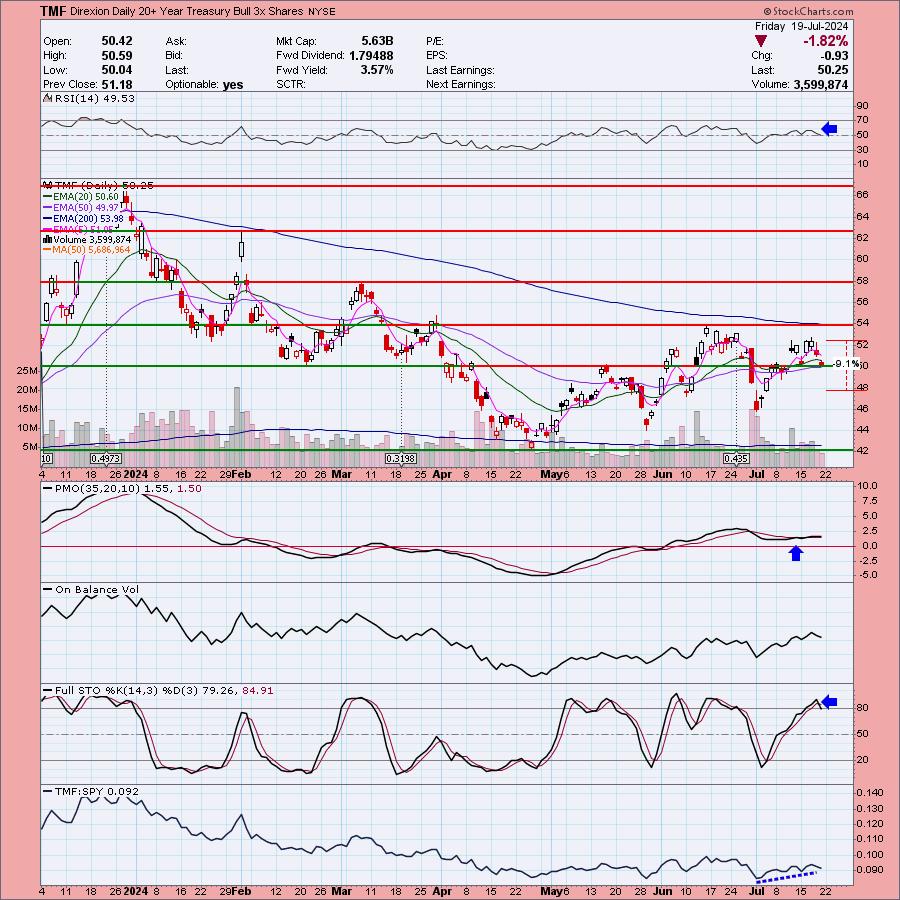
Here is today's chart:
This one is the Dud primarily because it is a leveraged fund. These are hit and miss and when they miss it can be painful. After reviewing the yield and bond charts this morning, I feel less enthusiastic about this fund. I am still listing this one with a "Neutral" Sparkle Factor as it is now sitting on very strong support and could reverse from here. The PMO has since topped and the RSI is below 50 now. If it loses support, I'd consider shedding it.
THIS WEEK's Performance:
DecisionPoint Market Scoreboard (Mechanical Trend Model Signals):
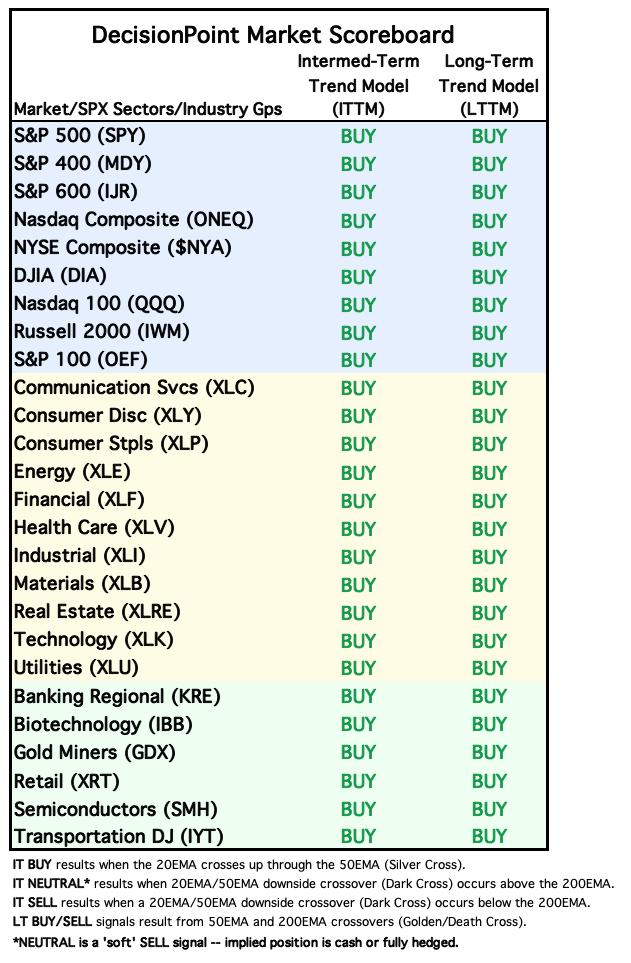
Friday signal changes are outlined in purple.
Click Here to view Carl's annotated "Under the Hood" ChartList!
Sector to Watch: Energy (XLE)
It wasn't a good day for Energy and thus it did lose some participation, but ultimately readings are strong enough to look for a continuation of the rally. We have double bottom pattern. The Silver Cross Index is improving quickly although we did lose some ground on the Golden Cross Index. The PMO is still rising. The chart isn't spectacular but this is why it is a Sector to "Watch", I think that it will see improvement next week barring a bad decline in the market as a whole (which it is vulnerable to). A breakout in Crude Oil would likely go a long way.
Industry Group to Watch: Integrated Oil & Gas ($DJUSCX)
This group saw a big pullback today that wasn't really visible this morning. I'm keeping this as the Industry Group to Watch as this pullback may offer an opportunity for entry on some of these stocks. The RSI is positive and not overbought and we have a double bottom pattern on the chart that implies more upside. The PMO is still on the rise despite today's decline. Stochastics have topped but remain above 80. A few symbols you may want to explore: EE, SU, XOM, HES and CVX.
Go to our Under the Hood ChartList on DecisionPoint.com to get an in-depth view of all the sectors. On StockCharts.com you can find the Industry Summary.
Good Luck & Good Trading!
- Erin
erin@decisionpoint.com
Full Disclosure: I'm 40% long, 0% short.
Watch the latest episode of the DecisionPoint Trading Room with Carl & Erin Swenlin on Mondays 3:00p EST!
Technical Analysis is a windsock, not a crystal ball. --Carl Swenlin
NOTE: The stocks reported herein are from mechanical trading model scans that are based upon moving average relationships, momentum and volume. DecisionPoint analysis is then applied to get selections from the scans. The selections given should prompt readers to do a chart review using their own analysis process. This letter is not a call for a specific action to buy, sell or short any of the stocks provided. There are NO sure things or guaranteed returns on the selection of "diamonds in the rough."
Helpful DecisionPoint Links:
DecisionPoint Shared ChartList and DecisionPoint Chart Gallery
Price Momentum Oscillator (PMO)
Swenlin Trading Oscillators (STO-B and STO-V)
(c) Copyright 2024 DecisionPoint.com