
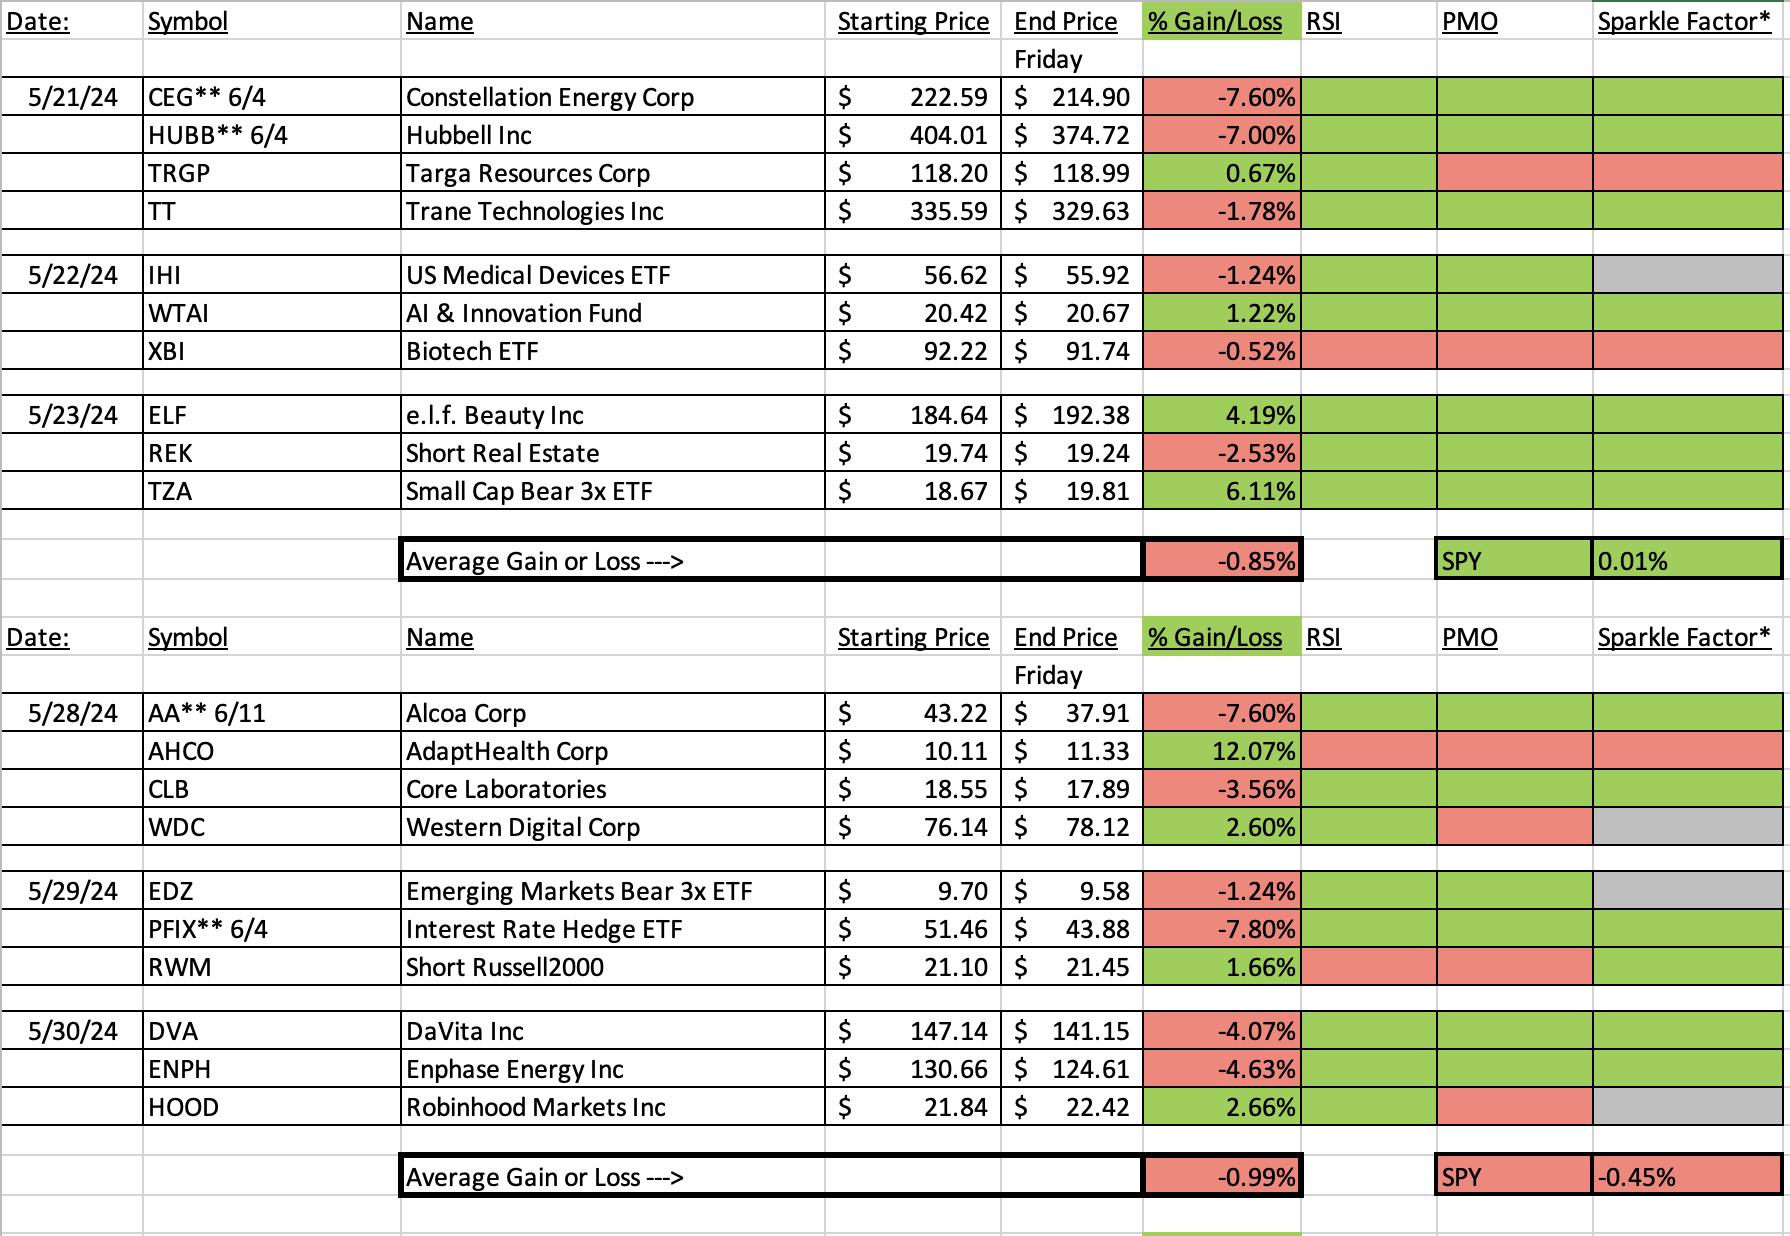
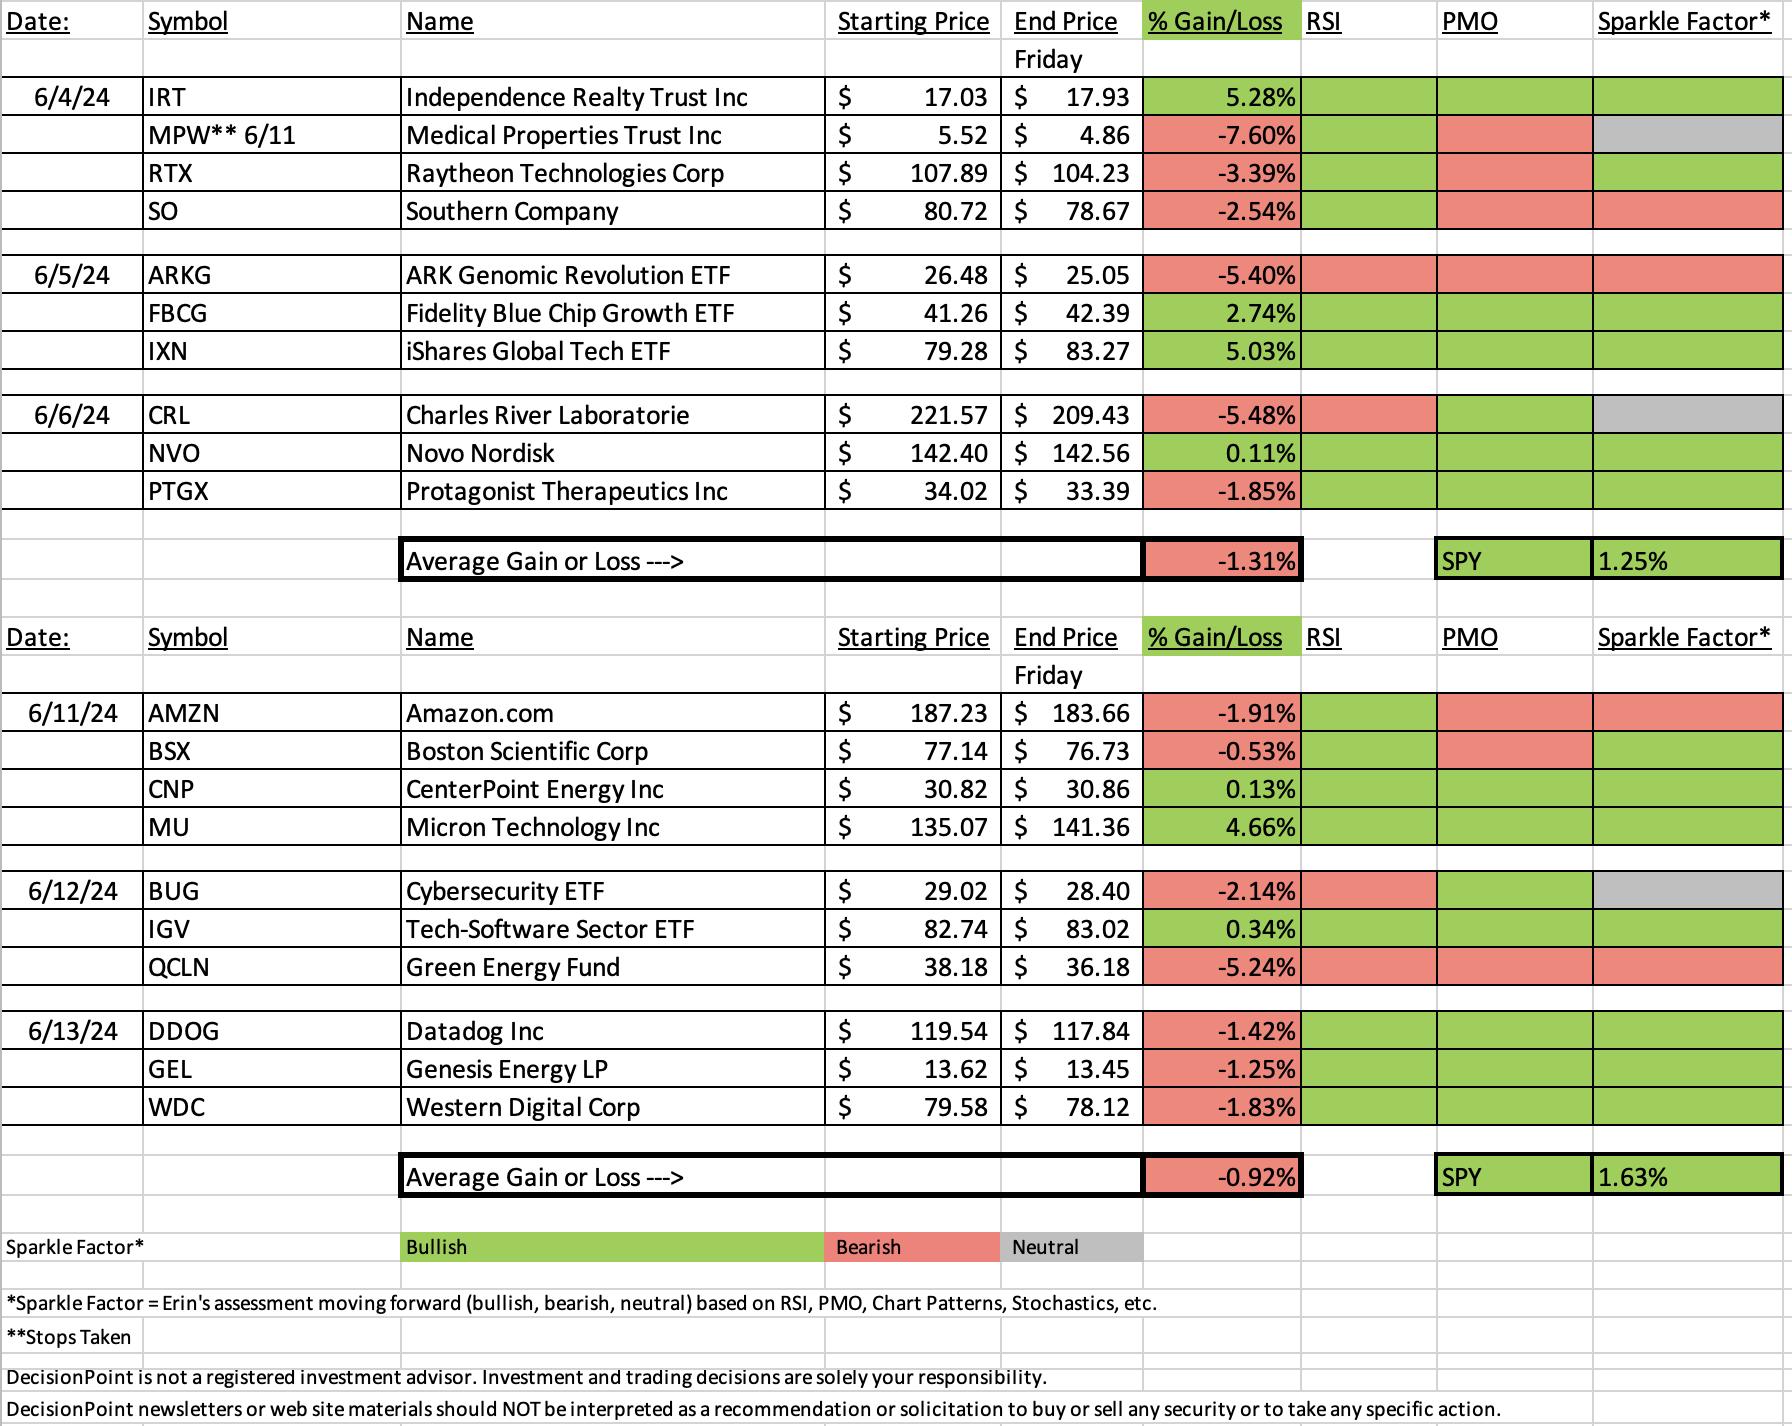
Mega-caps continue to lead the charge and the broad market is far from healthy right now. The SPX may be up, but there aren't that many stocks other than stocks like NVDA and AAPL that are pushing its price higher. We have less than 50% of the index showing Silver Crosses (20-day EMA > 50-day EMA) and less than 50% with price above their 20/50-day EMAs. The index may be going up but minus capitalization, it would be going down. Stock picking is definitely a challenge as the spreadsheet this week will attest.
This week's "Darling" was Micron (MU), a large-cap within the strong Semiconductors group. This week's "Dud" was the Clean Energy ETF. The Solar trade has gone south and that has put downside pressure on that ETF.
Reader requests struggled today as well with all of them down over 1%. Amazon a mega-cap for sure did not pan out this week and I would say it doesn't look good moving forward. I could see a reversal here, but the large bearish triple top has me out of AMZN.
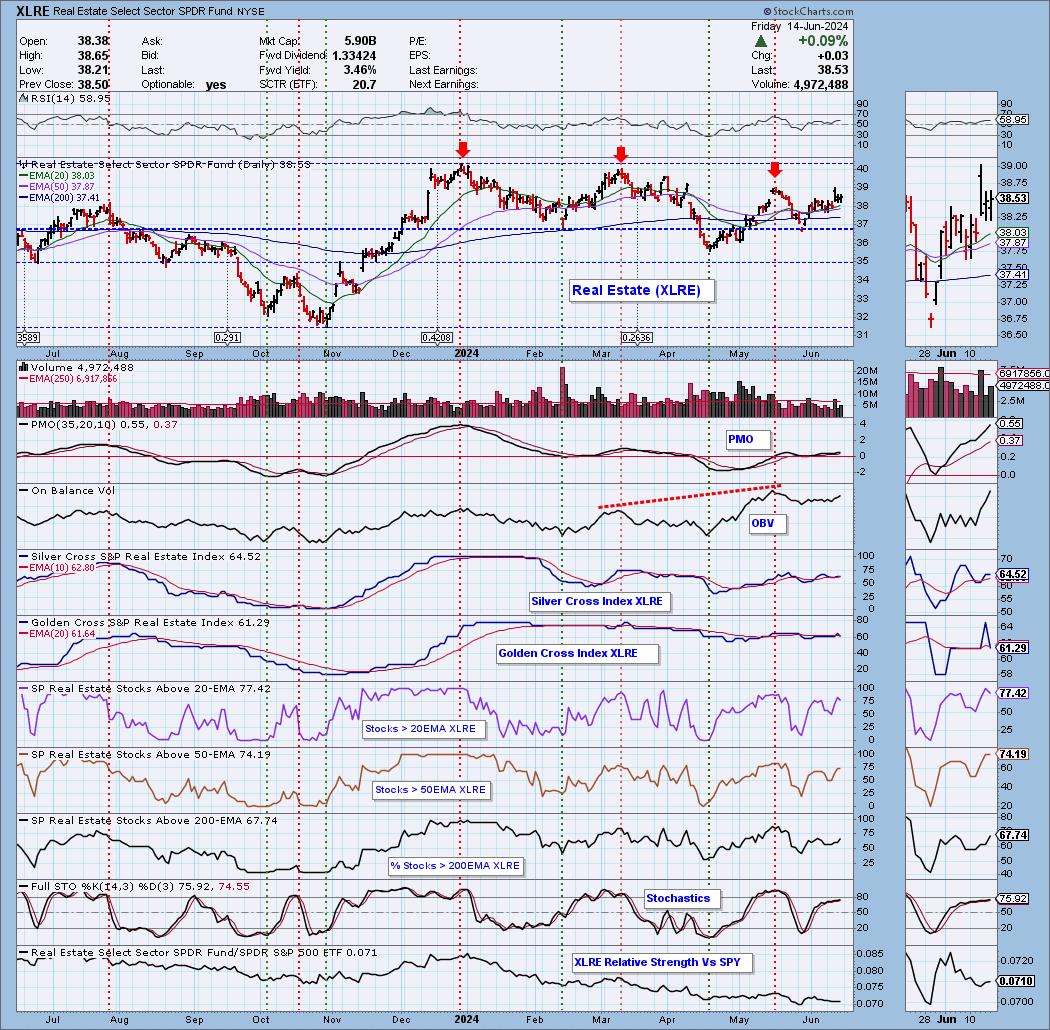
The Sector to Watch came down to Technology (XLK) and Real Estate (XLRE). I opted to go with XLRE primarily because there was better participation under the hood and declining interest rates will also help. XLK doesn't have the participation. It seems centered around Semiconductors and Computer Hardware (thank you NVDA and AAPL).
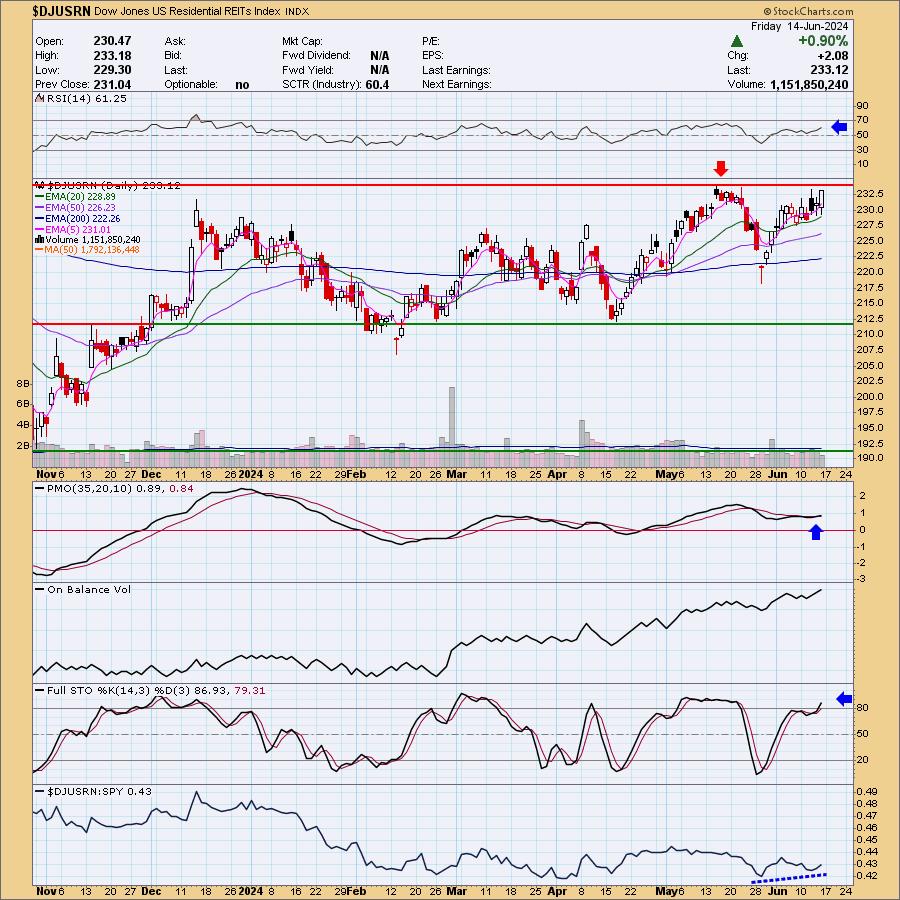
The Industry Group to Watch was Residential REITS. We did find four symbols within that looked promising: ESS, AVB, UDR and EQR.
I had time to run some Diamond scans at the end and came up with these symbols of interest: FICO, UTHR, AMT, NFLX and WSR.
See you in the Monday trading room!
Good Luck & Good Trading,
Erin

RECORDING & DOWNLOAD LINK (6/14/2024):
Topic: DecisionPoint Diamond Mine (6/14/2024) LIVE Trading Room
Download & Recording LINK
Passcode: June#14th
REGISTRATION for 6/21/2024:
When: Jun 21, 2024 09:00 AM Pacific Time (US and Canada)
Topic: DecisionPoint Diamond Mine (6/21/2024) LIVE Trading Room
Register in advance for this webinar HERE.
After registering, you will receive a confirmation email containing information about joining the webinar.

Below is the latest free DecisionPoint Trading Room recording from 6/10. You'll find these recordings posted on Mondays to our DP YouTube Channel. Be sure and subscribe HERE.
A few items about the spreadsheet: I've put on the spreadsheet whether the RSI is positive (green) or negative (red). The PMO column tells you if it is rising (green) or falling (red). Finally I've added my own "Sparkle Factor" that gives you my assessment going forward, bullish (green), bearish (red) or neutral (gray). The Sparkle Factor is basically my thoughts on whether I expect it to rise or fall. A neutral means it could really go either way so it could be added to a watch list. If you're in a stock I consider "neutral" going forward, the ball is in your court.
Darling:
Micron Technology, Inc. (MU)
EARNINGS: 06/26/2024 (AMC)
Micron Technology, Inc. engages in the provision of innovative memory and storage solutions. It operates through the following segments: Compute and Networking Business Unit (CNBU), Mobile Business Unit (MBU), Embedded Business Unit (EBU), and Storage Business Unit (SBU). The CNBU segment includes memory products and solutions sold into client, cloud server, enterprise, graphics, and networking markets. The MBU segment is involved in memory and storage products sold into smartphone and other mobile-device markets. The EBU segment focuses on memory and storage products sold into automotive, industrial, and consumer Markets. The SBU segment consists of SSDs and component-level solutions sold into enterprise and cloud, client, and consumer storage markets. The company was founded by Ward D. Parkinson, Joseph Leon Parkinson, Dennis Wilson, and Doug Pitman on October 5, 1978 and is headquartered in Boise, ID.
Predefined Scans Triggered: New 52-week Highs, Filled Black Candles and P&F Double Top Breakout.
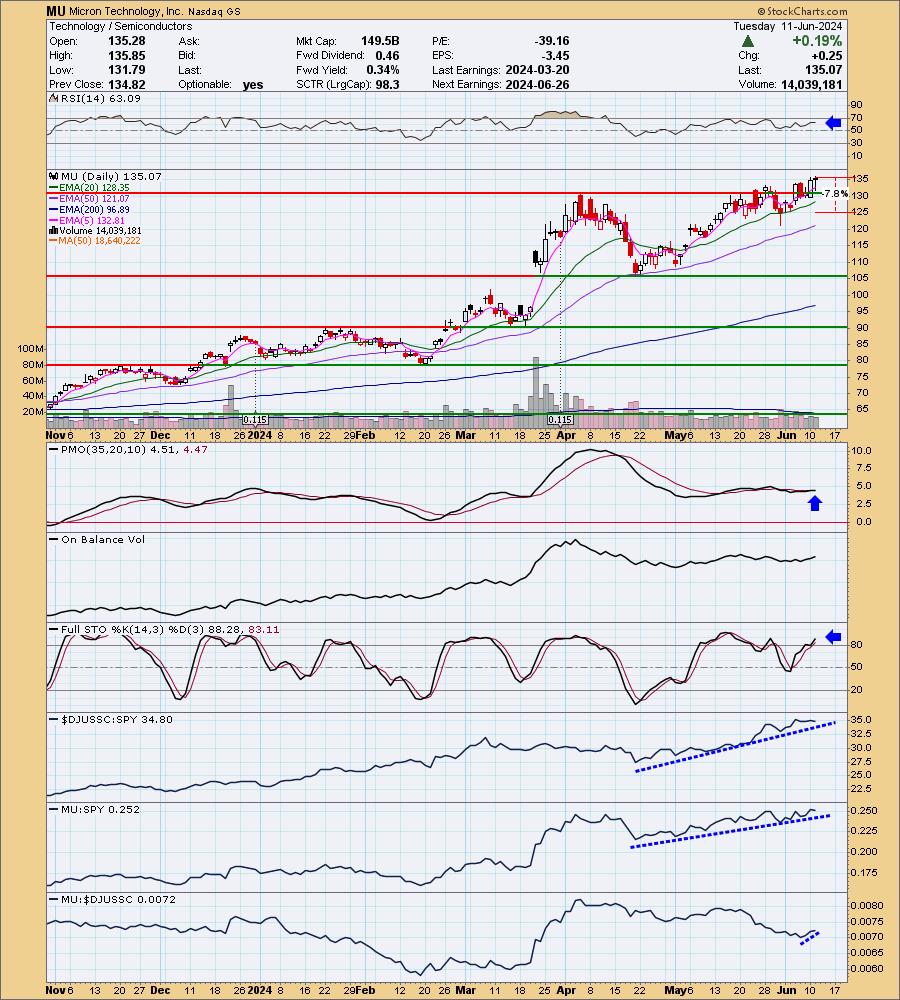
Below are the commentary & chart from Tuesday, 6/11:
"MU is up +0.06% in after hours trading. Technically it saw a bearish filled black candlestick today, but it was pretty skinny. Ultimately we got a new 52-week high. I like this breakout and steady rally out of the April low. The RSI is positive and not yet overbought. The PMO is flat above the zero line indicating pure strength. It also just saw a Crossover BUY Signal. Stochastics are now above 80. The group is doing quite well with the help of NVDA, but not all Semiconductors are bullish like MU. It hasn't been performing well within the group, but that is changing and overall it is outperforming the SPY. The stop is set between the 20/50-day EMAs at 7.8% or $124.53."
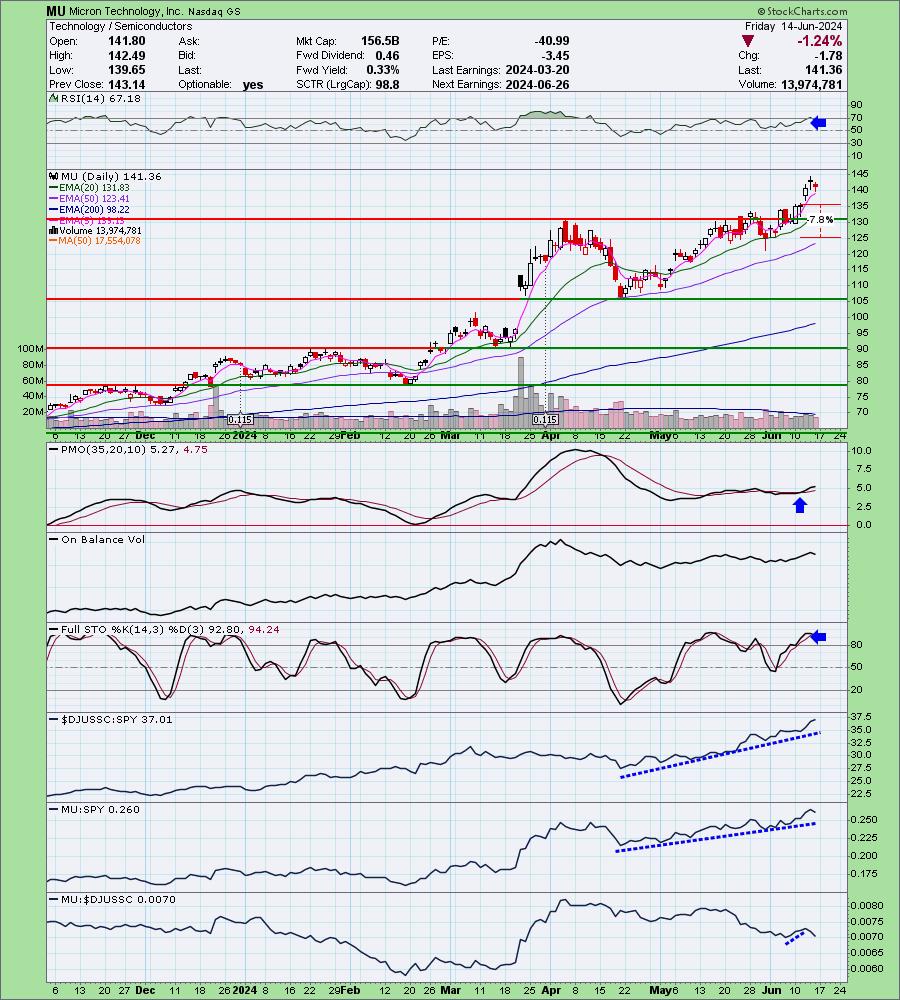
Here is today's chart:
MU pulled back today but it did not come close to compromising the rising trend. The RSI is now out of overbought territory after today's decline and the PMO is still rising. Stochastics are comfortably above 80 so I see a bit more upside available for Micron. I'm still leery of the group and Technology as a whole because eventually these big guys will need to correct. At least MU isn't overbought now.
Don't forget, on Thursdays I look at reader-requested symbols, so shoot me an email at erin@decisionpoint.com. I read every email I receive and try to answer them all!
Dud:
First Trust NASDAQ Clean Edge Green Energy Fund (QCLN)
EARNINGS: N/A
QCLN tracks a market-cap-weighted index of US-listed firms involved in clean energy. Click HERE for more information.

Predefined Scans Triggered: Elder Bar Turned Green, New CCI Buy Signals, Filled Black Candles, Parabolic SAR Buy Signals and P&F Double Top Breakout.
Below are the commentary & chart from Wednesday, 6/12:
"QCLN is down -0.45% in after hours trading. We have a possible bull flag formation that was confirmed with today's breakout. It was a bearish filled black candlestick so we could see a decline tomorrow. The RSI is positive and not overbought. The PMO has surged above the signal line well above the zero line. Stochastics are angling lower, but have currently turned back up. This ETF has been outperforming the SPY since the April low. Primarily due to the recent rally in solar. The stop is set beneath the 50-day EMA at 7.7% or $35.24."
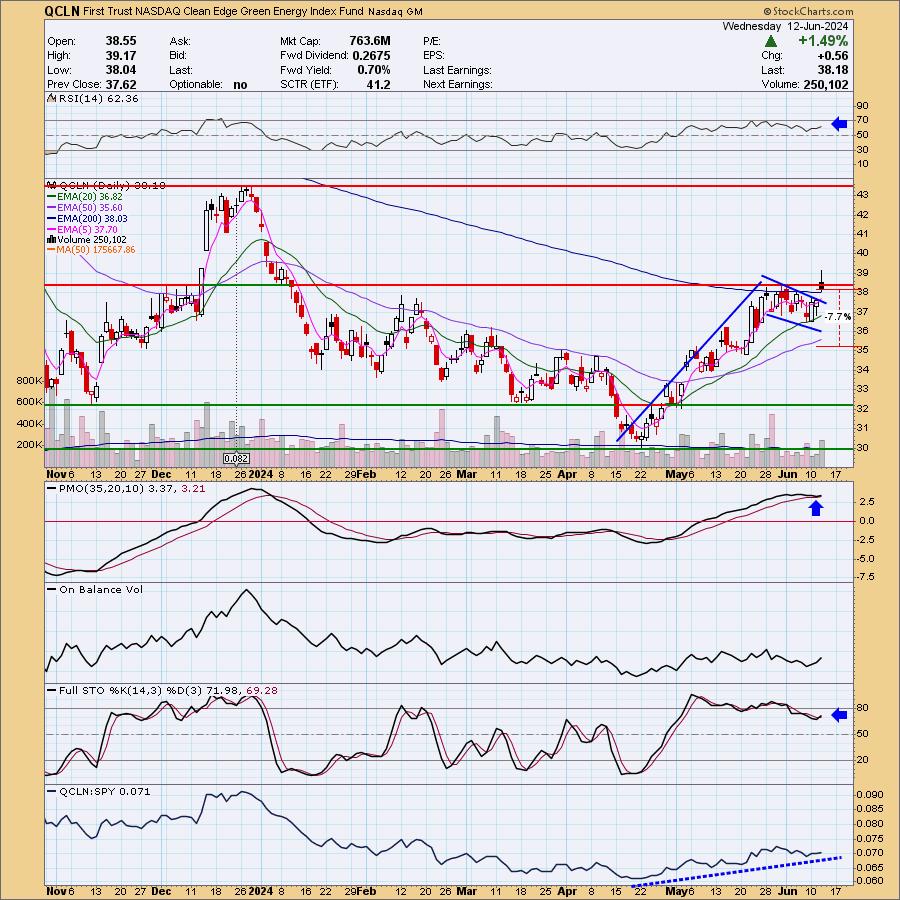
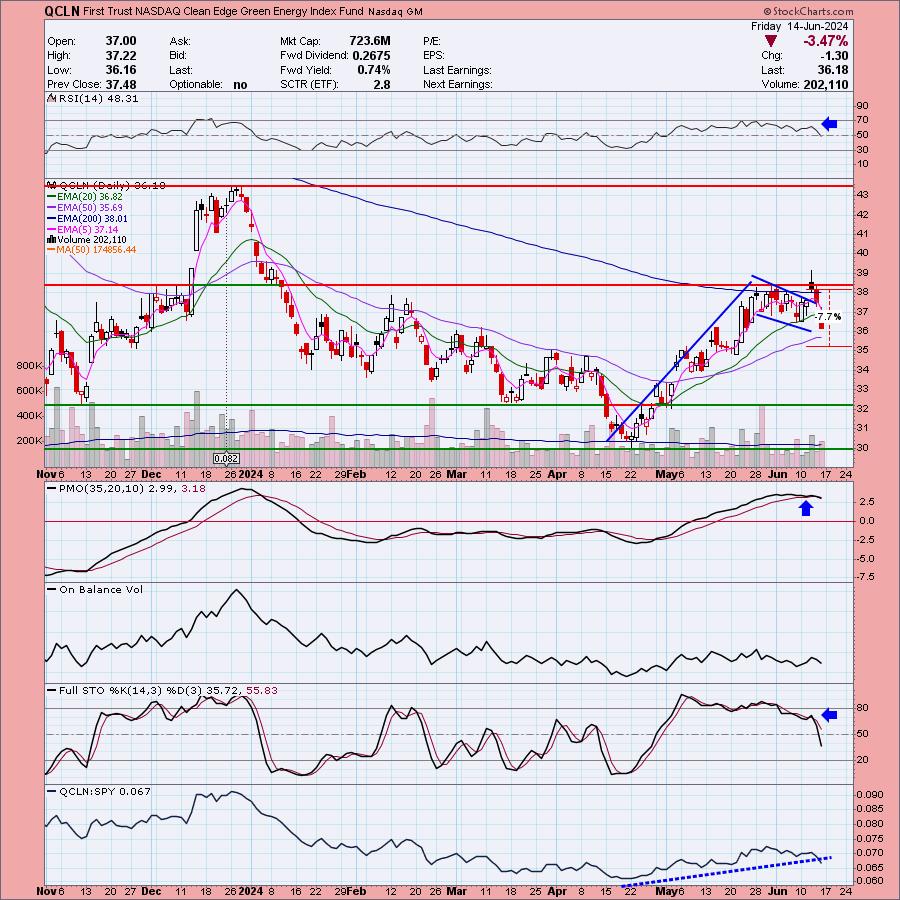
Here is today's chart:
Where did this one go wrong? The breakout looked good but it did come on a bearish filled black candlestick that may have proved warning. Price is now back inside the flag and the PMO is on a Crossover SELL Signal. The RSI just dropped in negative territory. As noted in the opening, the Solar group began to fail and that tore this one down. Clearly there is no need to wait for the stop to be hit.
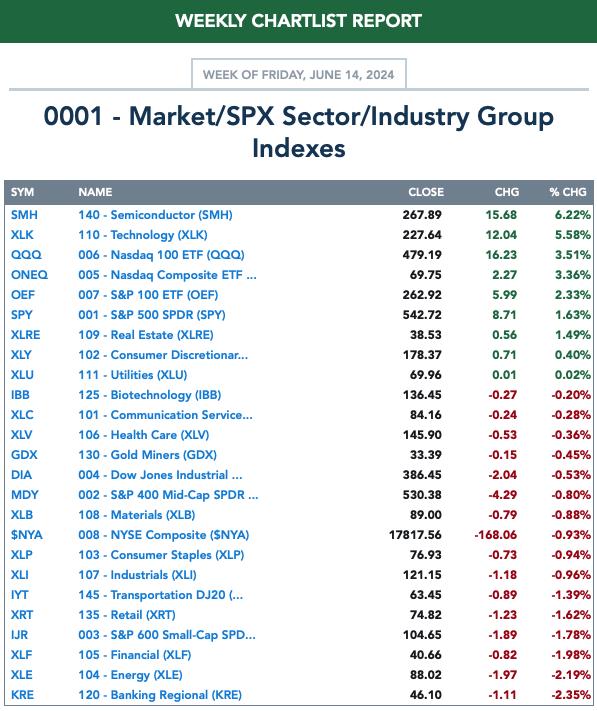
THIS WEEK's Performance:
DecisionPoint Market Scoreboard (Mechanical Trend Model Signals):
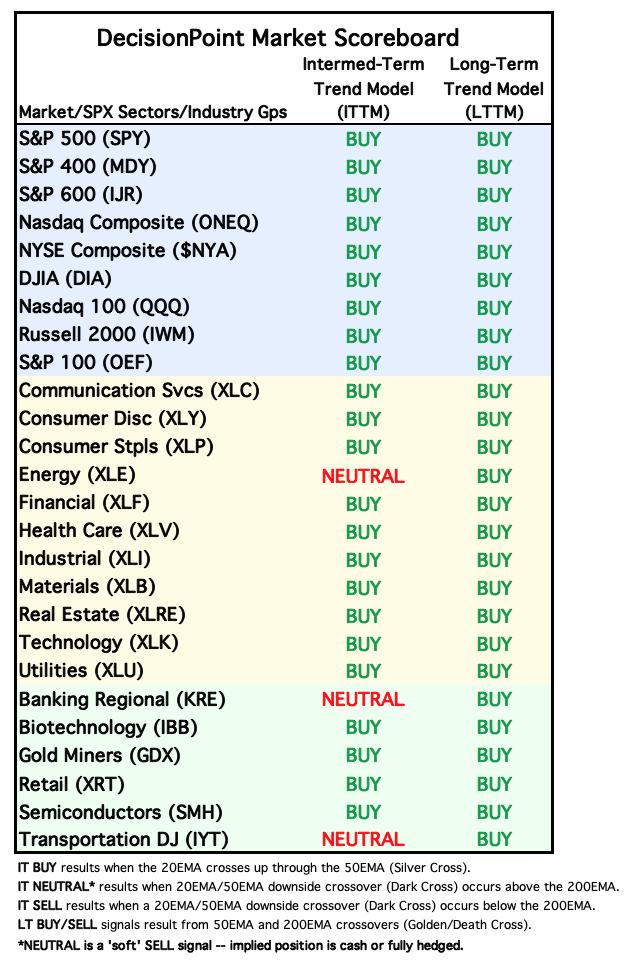
Friday signal changes are outlined in purple.
Click Here to view Carl's annotated "Under the Hood" ChartList!
Sector to Watch: Real Estate (XLRE)
I do note that participation of stocks above their 20-day EMA ticked down on a rally, but percentages are far healthier than Technology's. The Silver Cross Index is holding at an acceptable level. Stochastics are less than enthusiastic. It's not the best chart, but Tech is overdue for a pullback and XLRE should benefit from lowering interest rates. It is also somewhat defensive so if the market does turn, this area may still hold up. Keep an eye on it!
Industry Group to Watch: Residential REITS (IHI)
This isn't the best chart ever, but it does have merit as well as stocks within that look good. We had picked a different industry group in the Diamond Mine today, but it didn't produce any good charts within so we switched. This is a group to "watch" as it could turn south here and form a bearish double top. If that happens, you'll want to steer clear. At this point the RSI is positive and the PMO is rising on a new Crossover BUY Signal. Stochastics are now above 80. It should break out. Here are the stock symbols we found this morning: ESS, AVB, UDR and EQR.
Go to our Under the Hood ChartList on DecisionPoint.com to get an in-depth view of all the sectors. On StockCharts.com you can find the Industry Summary.
Good Luck & Good Trading!
- Erin
erin@decisionpoint.com
Full Disclosure: I'm 45% long, 0% short.
Watch the latest episode of the DecisionPoint Trading Room with Carl & Erin Swenlin on Mondays 3:00p EST!
Technical Analysis is a windsock, not a crystal ball. --Carl Swenlin
NOTE: The stocks reported herein are from mechanical trading model scans that are based upon moving average relationships, momentum and volume. DecisionPoint analysis is then applied to get selections from the scans. The selections given should prompt readers to do a chart review using their own analysis process. This letter is not a call for a specific action to buy, sell or short any of the stocks provided. There are NO sure things or guaranteed returns on the selection of "diamonds in the rough."
Helpful DecisionPoint Links:
DecisionPoint Shared ChartList and DecisionPoint Chart Gallery
Price Momentum Oscillator (PMO)
Swenlin Trading Oscillators (STO-B and STO-V)
(c) Copyright 2024 DecisionPoint.com