
I was thoroughly unimpressed with the results of my scans today. There weren't very many results and there weren't many quality choices. I did find some mega-cap names for you as they are still keeping the market together. However, overall I don't like what I'm seeing within the market and would therefore not be expanding my portfolio. They can't go up forever and when they do turn south, the market as a whole will come crashing down in my opinion. I wouldn't want to be overly exposed when that does happen. Stay cautious and consider using stops on any new positions.
Good Luck & Good Trading,
Erin
Today's "Diamonds in the Rough": AMZN, BSX, CNP and MU.

RECORDING & DOWNLOAD LINK (6/7/2024):
Topic: DecisionPoint Diamond Mine (6/7/2024) LIVE Trading Room
Download & Recording LINK
Passcode: June#7th
REGISTRATION for 6/14/2024:
When: Jun 14, 2024 09:00 AM Pacific Time (US and Canada)
Topic: DecisionPoint Diamond Mine (6/14/2024) LIVE Trading Room
Register in advance for this webinar HERE.
After registering, you will receive a confirmation email containing information about joining the webinar.

Here is the latest recording from 6/10. Click HERE to subscribe to the DecisionPoint YouTube Channel to be notified when new content is available.
Welcome to DecisionPoint Diamonds, wherein I highlight ten "Diamonds in the Rough" per week. These are selected from the results of my DecisionPoint Scans which search for stocks that could benefit from the trend and condition of the market. Remember, these are not recommendations to buy or sell, but are the most interesting of the stocks that surfaced in my scans. My objective is to save you the work of the initial, tedious culling process, but you need to apply your own analysis to see if these stocks pique your interest as well. There are no guaranteed winners here!
"Predefined Scans Triggered" are taken from StockCharts.com using the "Symbol Summary" option instead of a "SharpChart" on the workbench.
Stop levels are all rounded down.
Amazon.com, Inc. (AMZN)
EARNINGS: 08/01/2024 (AMC)
Amazon.com, Inc. is a multinational technology company, which engages in providing online retail shopping services. It operates through the following segments: North America, International, and Amazon Web Services (AWS). The North America segment is involved in the retail sales of consumer products including from sellers and subscriptions through North America-focused online and physical stores. The International segment focuses on the amounts earned from retail sales of consumer products including from sellers and subscriptions through internationally focused online stores. The AWS segment includes global sales of computer, storage, database, and other services for start-ups, enterprises, government agencies, and academic institutions. The company was founded by Jeffrey P. Bezos in July 1994 and is headquartered in Seattle, WA.
Predefined Scans Triggered: Improving Chaikin Money Flow and New CCI Buy Signals.
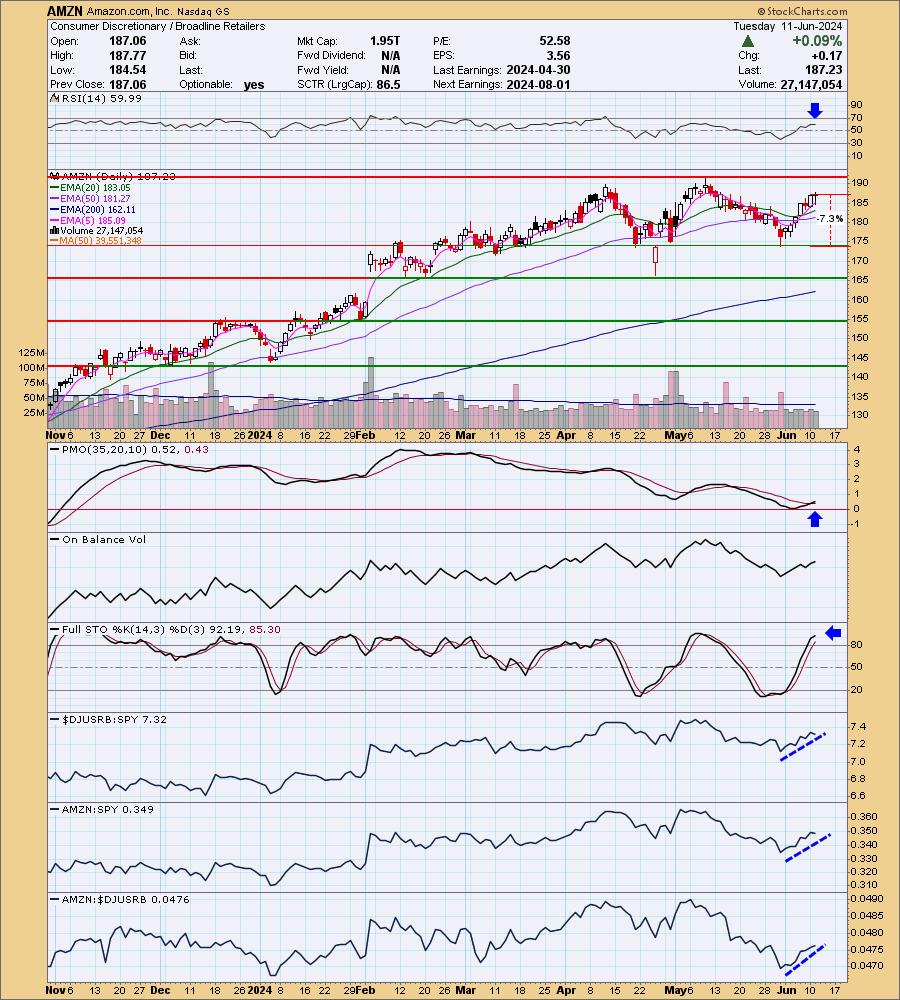
AMZN is down -0.14% in after hours trading. AMZN showed up in my scans and while I like this new rally, there is still the problem of a double top formation. That formation will be busted when AMZN reaches new all-time highs and I think it is on the way. We have the RSI in positive territory and not overbought. There is a new PMO Crossover BUY Signal. Stochastics are above 80. Relative strength studies are very positive. We should see follow through, but as I mentioned in the opening, I don't know how much longer these big guys will hold up. The stop is set beneath support at 7.3% or $173.56.
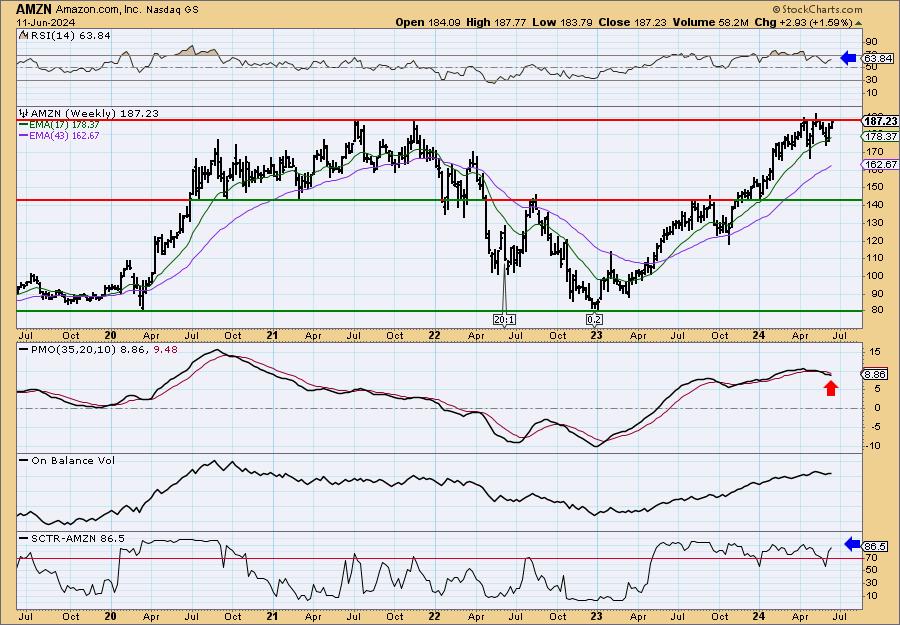
AMZN is pushing against all-time highs. I don't like that the weekly PMO is in decline, but it may be decelerating. The weekly RSI is positive and not overbought. The OBV is rising and confirming the rally. The StockCharts Technical Rank (SCTR) is in the hot zone* above 70. Consider a 17% upside target to $219.06.
*If a stock is in the "hot zone" above 70, it implies that it is stronger than 70% of its universe (large-, mid-, small-caps and ETFs) primarily in the intermediate to long terms.
Boston Scientific Corp. (BSX)
EARNINGS: 07/24/2024 (BMO)
Boston Scientific Corp. engages in the development, manufacture, and marketing of medical devices that are used in interventional medical procedures. It operates through the MedSurg and Cardiovascular segments. The MedSurg segment includes Endoscopy, Urology, and Neuromodulation. The Cardiovascular segment consists of Cardiology and Peripheral Interventions. The company was founded by John E. Abele and Pete Michael Nicholas on June 29, 1979 and is headquartered in Marlborough, MA.
Predefined Scans Triggered: P&F Double Top Breakout.
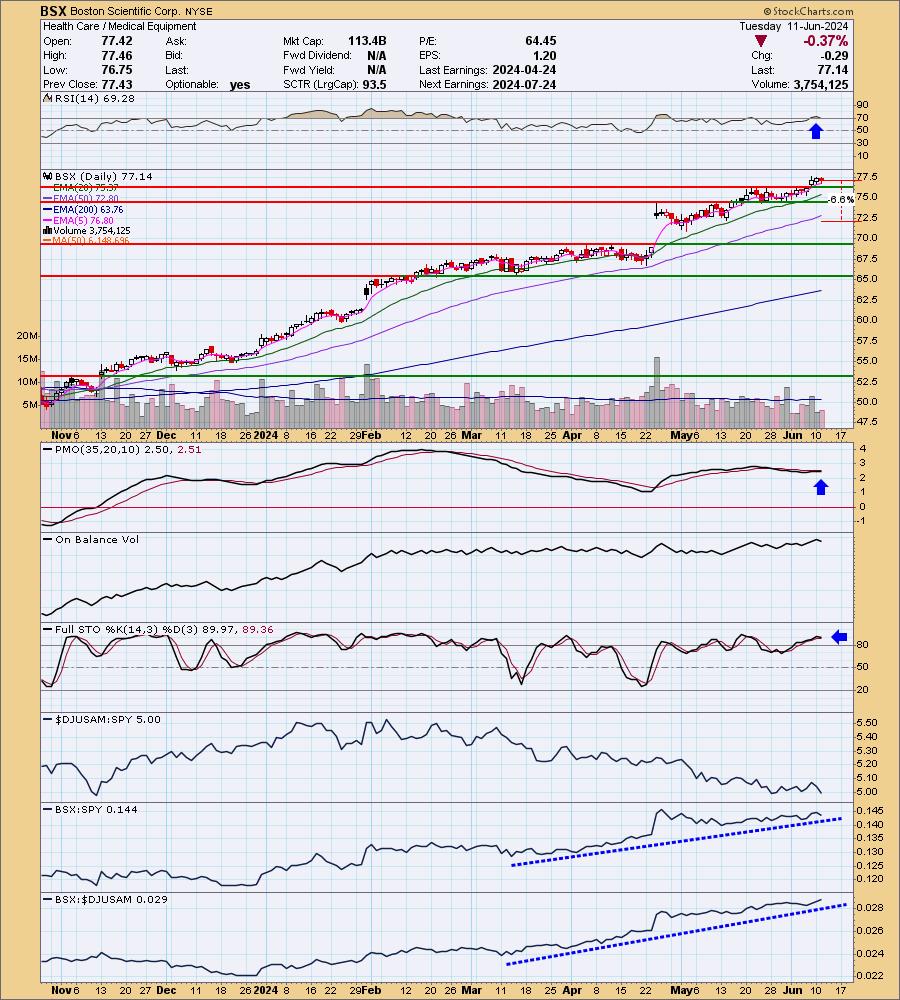
BSX is up +0.20% in after hours trading. This is a winner that will likely keep on winning. It is in a strong rising trend. This has unfortunately pushed the RSI into overbought territory, but given its prior history, it can stay overbought for weeks. The PMO is nearing a Crossover BUY Signal. Stochastics are above 80. The group isn't performing well now, but it is from our Industry Group to Watch this week. BSX is outperforming both the group and the SPY by a mile. I've set the stop below the 50-day EMA at 6.6% or $72.04.
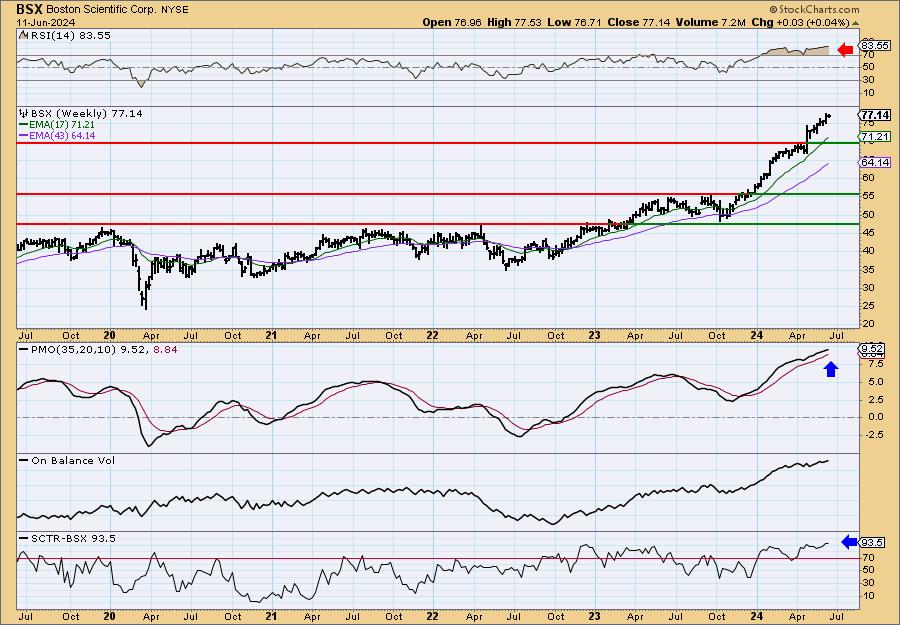
The weekly RSI is the big problem, but as I noted on the daily chart, it can hold these conditions while in a strong rally and it is in one. The weekly PMO is rising on a Crossover BUY Signal and the SCTR is at the top of the hot zone. Consider a 17% upside target to about $90.25.
CenterPoint Energy, Inc. (CNP)
EARNINGS: 07/25/2024 (BMO)
CenterPoint Energy, Inc. is a holding company, which engages in the business of power generation and distribution. It operates through the following segments: Electric, Corporate and Other, and Natural Gas. The Electric segment includes electric transmission and distribution services. The Corporate and Other segment refers to the energy performance contracting and sustainable infrastructure services. The Natural Gas segment is involved in the sales of intrastate natural gas, permanent pipeline connections, and home appliance maintenance and repair services. The company was founded in 1866 and is headquartered in Houston, TX.
Predefined Scans Triggered: Elder Bar Turned Green, Improving Chaikin Money Flow, New CCI Buy Signals and Three White Soldiers.
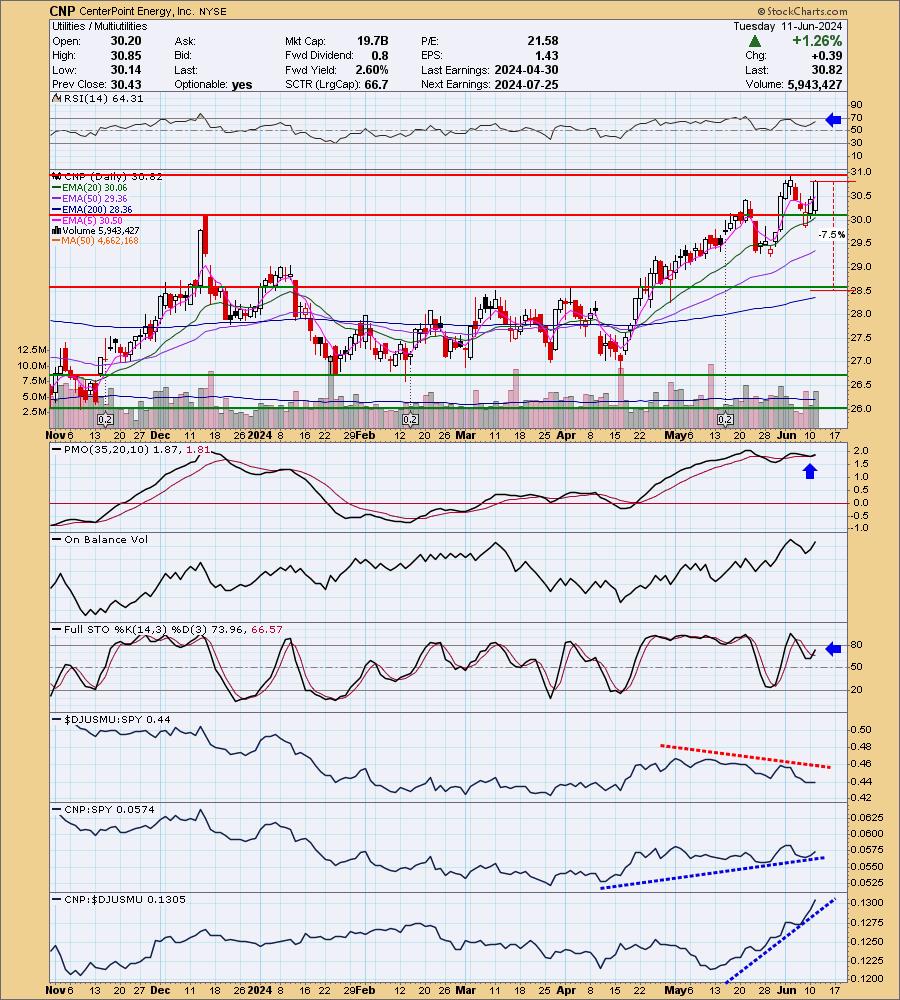
CNP is unchanged in after hours trading. I'd never heard of the "Three White Soldiers" candlestick pattern so I looked it up and found that it is a bullish reversal pattern. So we should see follow through based on the pattern. The RSI is positive and not overbought. The PMO surged above the signal line and is flat above the zero line which suggests internal strength. Stochastics have reversed higher in positive territory. The group is underperforming, but CNP isn't bothered by it and is outperforming the market. It is clearly outperforming the group. The stop is set beneath support at 7.5% or $28.50.
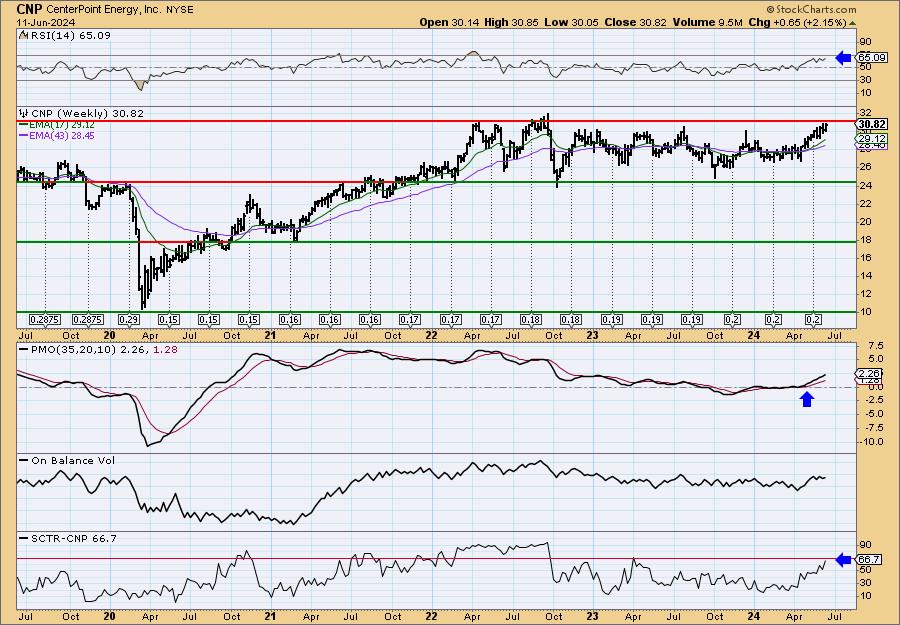
It has been in a sideways trading range and is at the top of it so we are vulnerable to a downside reversal. However, the indicators do suggest a breakout ahead. The weekly RSI is positive and not overbought. The weekly PMO is rising above the zero line on a Crossover BUY Signal. The SCTR isn't in the hot zone, but it is close. Consider a 17% upside target to about $36.06.
Micron Technology, Inc. (MU)
EARNINGS: 06/26/2024 (AMC)
Micron Technology, Inc. engages in the provision of innovative memory and storage solutions. It operates through the following segments: Compute and Networking Business Unit (CNBU), Mobile Business Unit (MBU), Embedded Business Unit (EBU), and Storage Business Unit (SBU). The CNBU segment includes memory products and solutions sold into client, cloud server, enterprise, graphics, and networking markets. The MBU segment is involved in memory and storage products sold into smartphone and other mobile-device markets. The EBU segment focuses on memory and storage products sold into automotive, industrial, and consumer Markets. The SBU segment consists of SSDs and component-level solutions sold into enterprise and cloud, client, and consumer storage markets. The company was founded by Ward D. Parkinson, Joseph Leon Parkinson, Dennis Wilson, and Doug Pitman on October 5, 1978 and is headquartered in Boise, ID.
Predefined Scans Triggered: New 52-week Highs, Filled Black Candles and P&F Double Top Breakout.
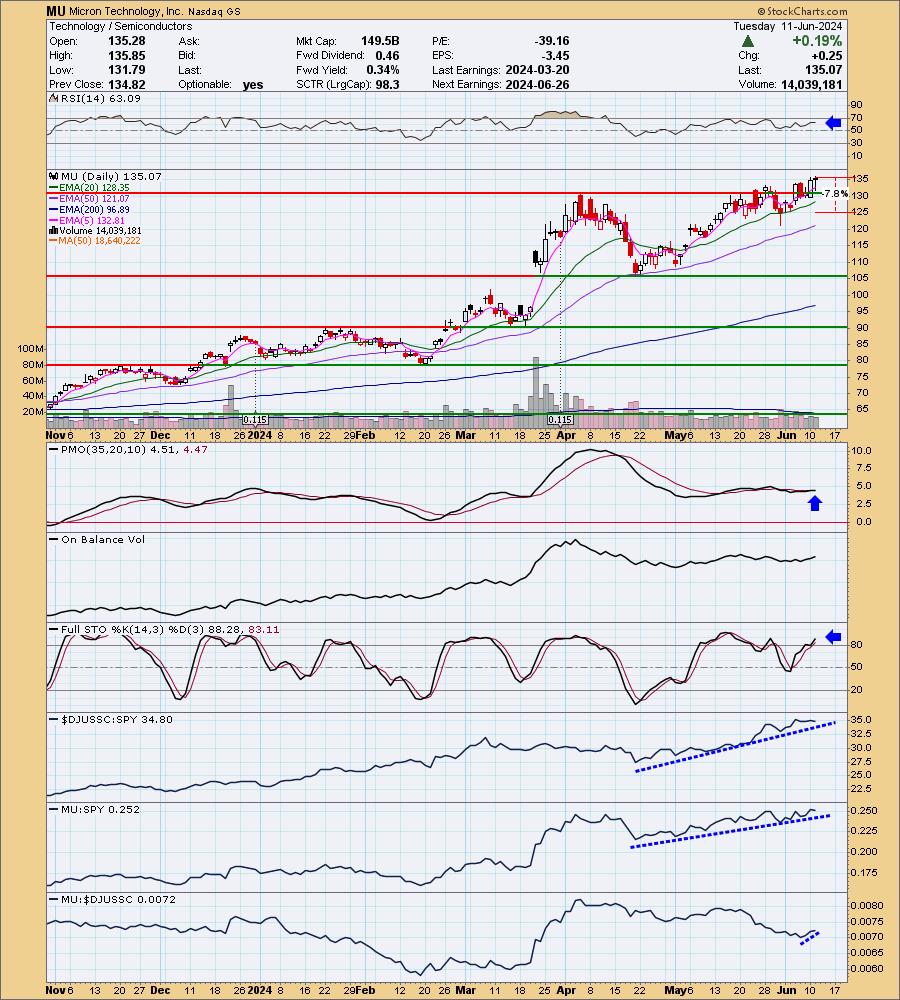
MU is up +0.06% in after hours trading. Technically it saw a bearish filled black candlestick today, but it was pretty skinny. Ultimately we got a new 52-week high. I like this breakout and steady rally out of the April low. The RSI is positive and not yet overbought. The PMO is flat above the zero line indicating pure strength. It also just saw a Crossover BUY Signal. Stochastics are now above 80. The group is doing quite well with the help of NVDA, but not all Semiconductors are bullish like MU. It hasn't been performing well within the group, but that is changing and overall it is outperforming the SPY. The stop is set between the 20/50-day EMAs at 7.8% or $124.53.
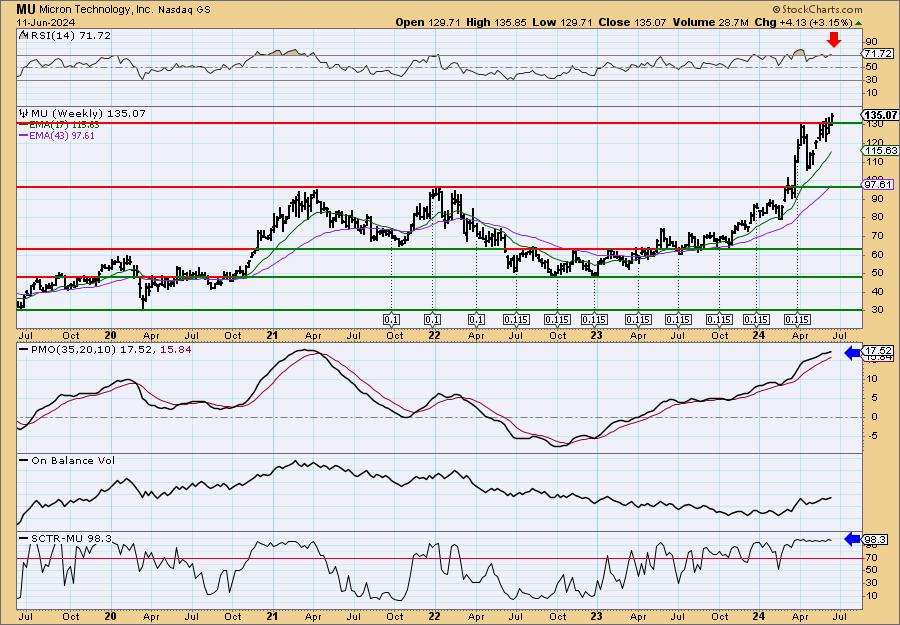
I am a bit concerned about the parabolic rally as it begs for a breakdown like we saw in April. The weekly RSI is now overbought so it is vulnerable in the intermediate term. However, the weekly PMO and SCTR are bullish enough that we could continue to see more upside. Consider a 17% upside target to $158.03.
Don't forget, on Thursdays I look at reader-requested symbols, click HERE to send me an email. I read every email I receive and try to answer them all!
Current Market Outlook:
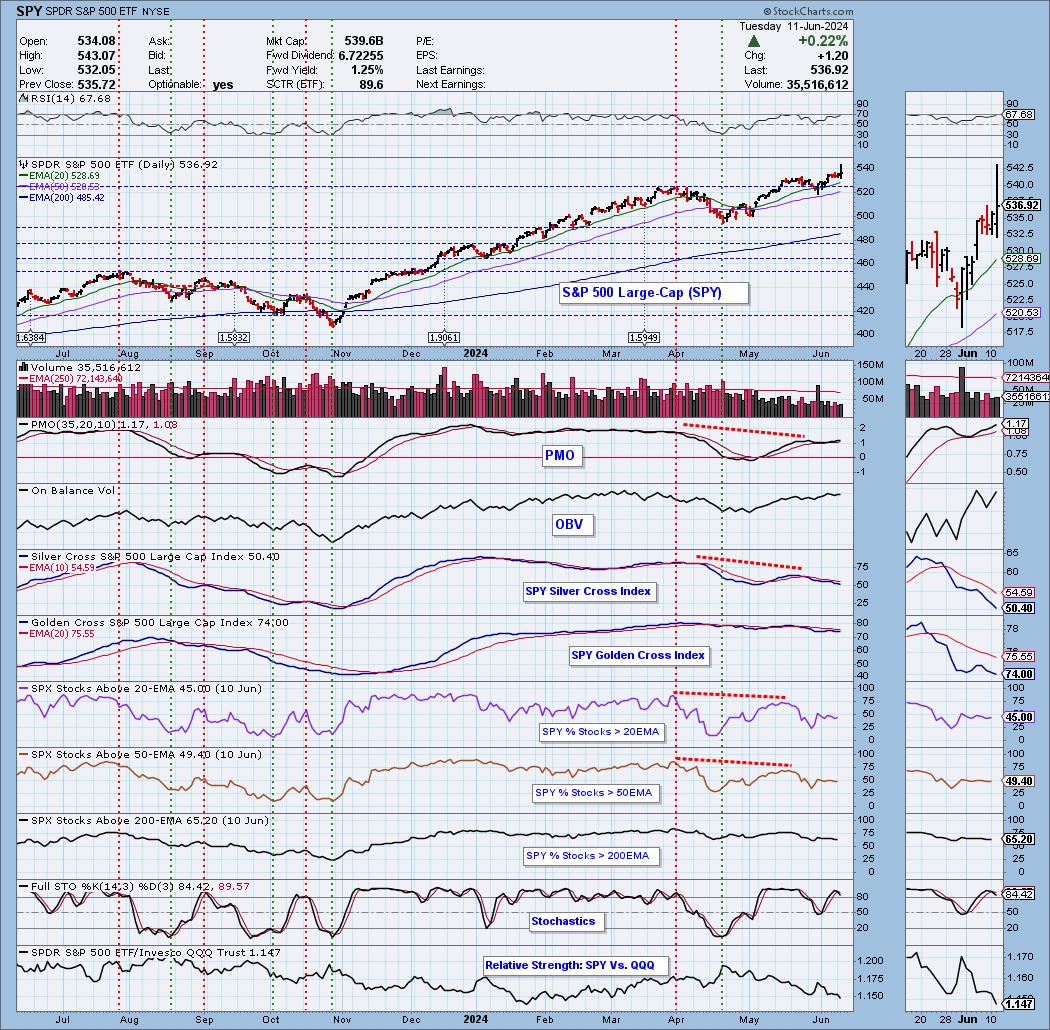
Market Environment: It is important to consider the odds for success by assessing the market tides. The following chart uses different methodologies for objectively showing the depth and trend of participation for intermediate- and long-term time frames.
- The Silver Cross Index (SCI) shows the percentage of SPX stocks on IT Trend Model BUY signals (20-EMA > 50-EMA)
- The Golden Cross Index (GCI) shows the percentage of SPX stocks on LT Trend Model BUY signals (50-EMA > 200-EMA)
Don't forget that as a "Diamonds" member, you have access to our "Under the Hood" curated ChartList on DecisionPoint.com. You'll find it under "Members Only" links on the left side on the Blogs and Links Page.
Here is the current chart:
Full Disclosure: I am 45% long, 0% short.
I'm required to disclose if I currently own a stock I mention and/or may buy/short it within the next 72 hours.
"Technical Analysis is a windsock, not a crystal ball." - Carl Swenlin
(c) Copyright 2024 DecisionPoint.com
Watch the latest episode of DecisionPoint Trading Room with Carl & Erin Swenlin Mondays on the DecisionPoint YouTube channel here!
NOTE: The stocks reported herein are from mechanical trading model scans that are based upon moving average relationships, momentum and volume. DecisionPoint analysis is then applied to get five selections from the scans. The selections given should prompt readers to do a chart review using their own analysis process. This letter is not a call for a specific action to buy, sell or short any of the stocks provided. There are NO sure things or guaranteed returns on the daily selection of "Diamonds in the Rough."
Regarding BUY/SELL Signals: The signal status reported herein is based upon mechanical trading model signals and crossovers. They define the implied bias of the price index/stock based upon moving average relationships and momentum, but they do not necessarily call for a specific action. They are information flags that should prompt chart review. Further, they do not call for continuous buying or selling during the life of the signal. For example, a BUY signal will probably (but not necessarily) return the best results if action is taken soon after the signal is generated. Additional opportunities for buying may be found as price zigzags higher, but the trader must look for optimum entry points. Conversely, exit points to preserve gains (or minimize losses) may be evident before the model mechanically closes the signal.
Helpful DecisionPoint Links:
Price Momentum Oscillator (PMO)
Swenlin Trading Oscillators (STO-B and STO-V)
For more links, go to DecisionPoint.com