
I was actually a little surprised that I didn't get any shorting opportunities from readers this week. I have to say the longs that were picked out fit our Diamonds in the Rough profile. I did have one short and that was the Technology inverse ETF (TECS). I like it, but I've already presented quite a few inverse opportunities already, but definitely keep this one in mind as a possibility. With the Magnificent Seven failing today, that sector took a big hit. The question is whether those mega-cap stocks can continue to rally from here. It is possible, but the ill effects on the broader market could overshadow and actually take some of them down. We'll keep you posted in the DP Alert.
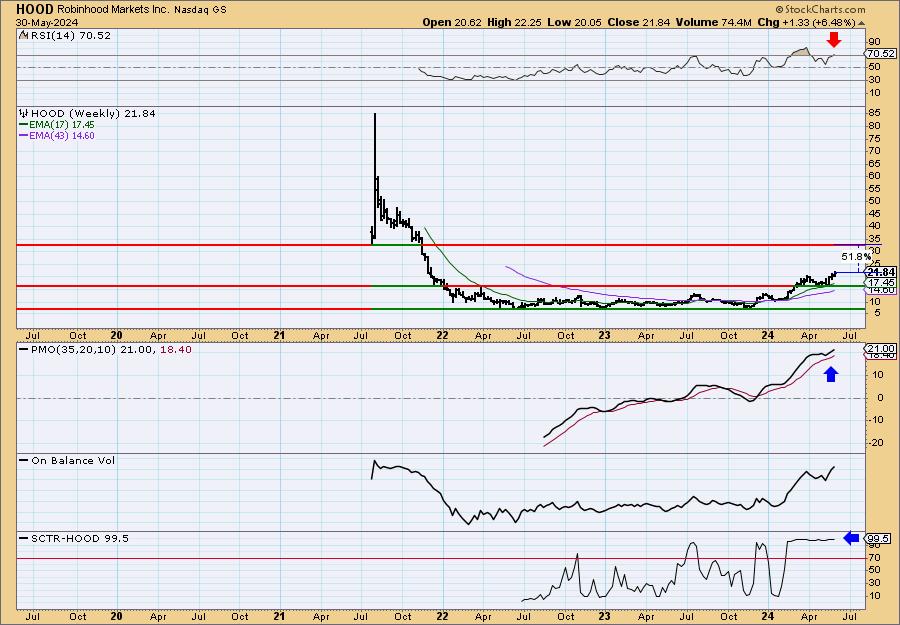
One of the requests came in from two people and that will always have me presenting it. Robinhood (HOOD) does look good right now, but it has enjoyed quite a bit of rally already. The weekly chart convinced me that there could be plenty of upside available still.
Finally, the Solar ETF (TAN) was requested. I do like what is happening in this industry group, but I had a single stock, Enphase (ENPH) that was requested and I opted to present it instead.
Tomorrow is the Diamond Mine trading room! Would love to welcome some new faces to the group. Check it out and don't forget the replays are available for two weeks after.
Good Luck & Good Trading,
Erin
Today's "Diamonds in the Rough": DVA, ENPH and HOOD.
Other requests: NOV, DBA, TAN, TECS, NVST and PLTR.

RECORDING & DOWNLOAD LINK (5/24/2024):
Topic: DecisionPoint Diamond Mine (5/24/2024) LIVE Trading Room
Download & Recording Link HERE
Passcode: May#24th
REGISTRATION for 5/31/2024:
When: May 31, 2024 09:00 AM Pacific Time (US and Canada)
Topic: DecisionPoint Diamond Mine (5/31/2024) LIVE Trading Room
Register in advance for this webinar HERE.
After registering, you will receive a confirmation email containing information about joining the webinar.

Here is the latest recording from 5/20 (No recording on 5/27). Click HERE to subscribe to the DecisionPoint YouTube Channel to be notified when new content is available.
Welcome to DecisionPoint Diamonds, wherein I highlight ten "Diamonds in the Rough" per week. These are selected from the results of my DecisionPoint Scans which search for stocks that could benefit from the trend and condition of the market. Remember, these are not recommendations to buy or sell, but are the most interesting of the stocks that surfaced in my scans. My objective is to save you the work of the initial, tedious culling process, but you need to apply your own analysis to see if these stocks pique your interest as well. There are no guaranteed winners here!
"Predefined Scans Triggered" are taken from StockCharts.com using the "Symbol Summary" option instead of a "SharpChart" on the workbench.
Stop levels are all rounded down.
DaVita Inc. (DVA)
EARNINGS: 08/01/2024 (AMC)
DaVita, Inc. engages in the provision of medical care services. It operates through the following two segments: US Dialysis and Related Lab Services, and Other-Ancillary Services and Strategic Initiatives. The US Dialysis and Related Lab Services segment offers kidney dialysis services in the United States for patients suffering from chronic kidney failure. The Other-Ancillary Services and Strategic Initiatives segment consist primarily of pharmacy services, disease management services, vascular access services, clinical research programs, physician services, direct primary care, end stage renal disease seamless care organizations, and comprehensive care. The company was founded in 1994 and is headquartered in Denver, CO.
Predefined Scans Triggered: New 52-week Highs, Filled Black Candles and P&F Double Top Breakout.
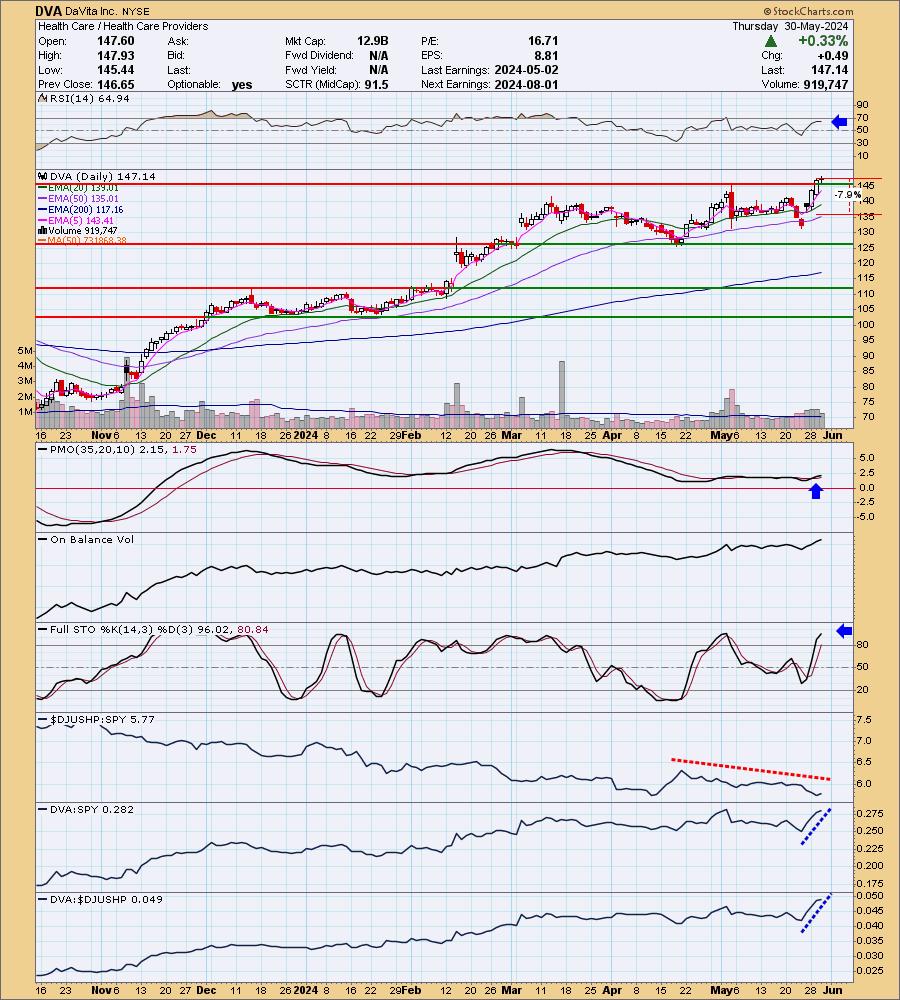
DVA is unchanged in after hours trading. We have a new breakout to 52-week highs. It had already begun to breakout yesterday and today saw good follow through. The RSI is positive and not yet overbought. The PMO is flat above the zero line which implies strength on this current Crossover BUY Signal. Stochastics are above 80. The one complaint I have is the industry group is clearly underperforming. What keeps this one viable is the outperformance it is showing against the SPY in spite of its group. The stop is set near the 50-day EMA at $135.51.
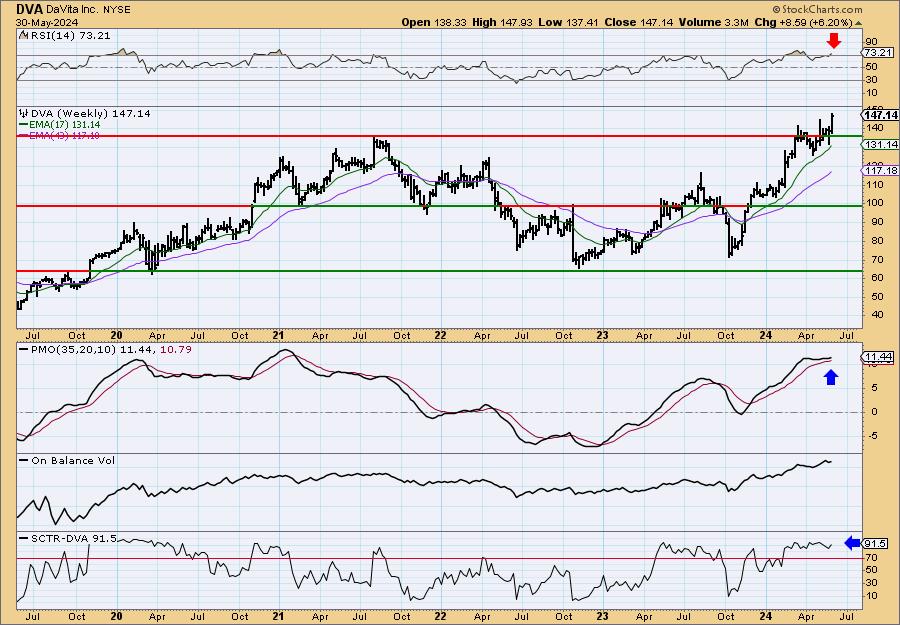
Price is overbought based on the weekly RSI so it is due for a pullback. The weekly PMO is flat but on a Crossover BUY Signal. The StockCharts Technical Rank (SCTR) is at the top of the hot zone*. Consider a 17% upside target to about $172.15.
*If a stock is in the "hot zone" above 70, it implies that it is stronger than 70% of its universe (large-, mid-, small-caps and ETFs) primarily in the intermediate to long terms.
Enphase Energy Inc. (ENPH)
EARNINGS: 07/30/2024 (AMC)
Enphase Energy, Inc. is a global energy technology company, which engages in the business of designing, developing, manufacturing, and selling home energy solutions that manage energy generation, energy storage, control, and communications on one intelligent platform. It operates through the following geographical segments: the United States, the Netherlands, and Others. The company was founded by Raghuveer R. Belur and Martin Fornage in March 2006 and is headquartered in Fremont, CA.
Predefined Scans Triggered: Elder Bar Turned Green, Moved Above Upper Bollinger Band, P&F Ascending Triple Top Breakout and P&F Double Top Breakout.
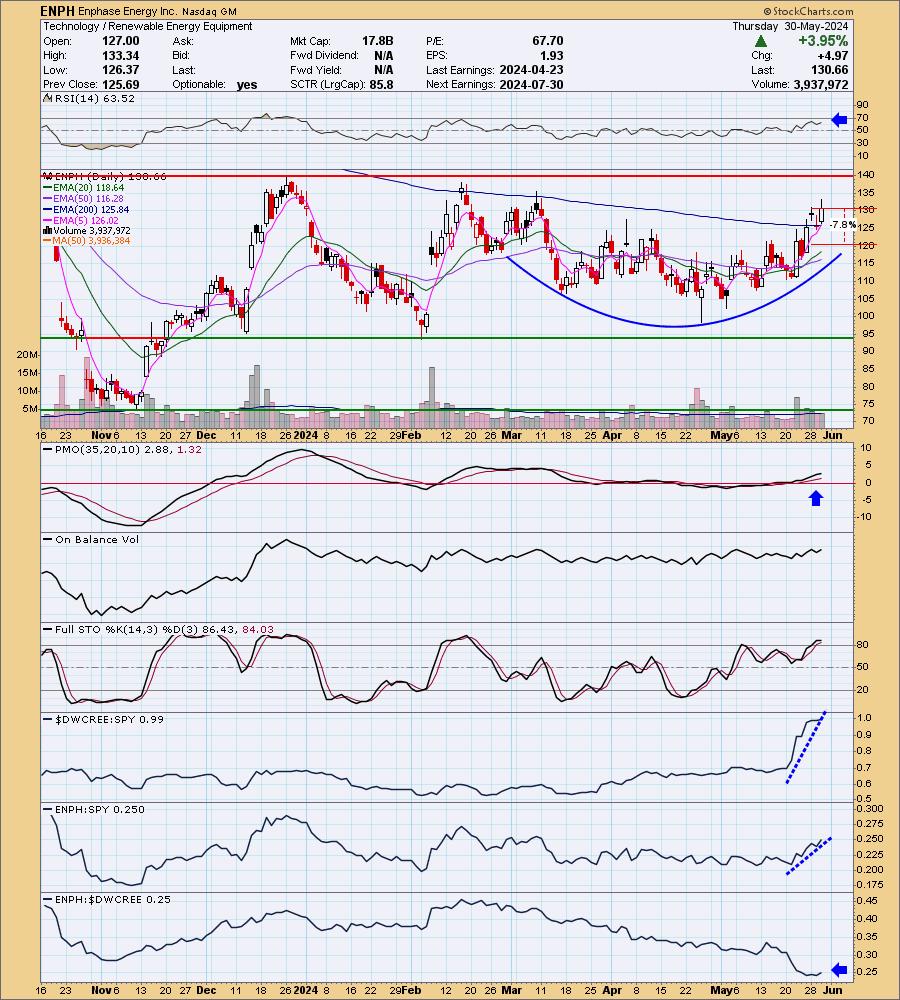
ENPH is down -0.21% in after hours trading. It has been in a sideways trading range for some time and while it is near the top, I notice a cup shaped basing pattern that should keep price moving higher. We are vulnerable to a possible "handle" being added to this cup which would require a pullback. The indicators are ripe and suggest an upcoming breakout. The RSI is positive and not overbought. The PMO is rising on a Crossover BUY Signal above the zero line. Stochastics are above 80. The industry group is on fire so I see why it was requested. ENPH is just now beginning to stave off its underperformance against the group. It is doing well against the SPY and that is the most important of the relative strength windows. The stop is set as deeply as I'm comfortable. This can be a volatile stock. The stop is at 7.8% or $120.46.
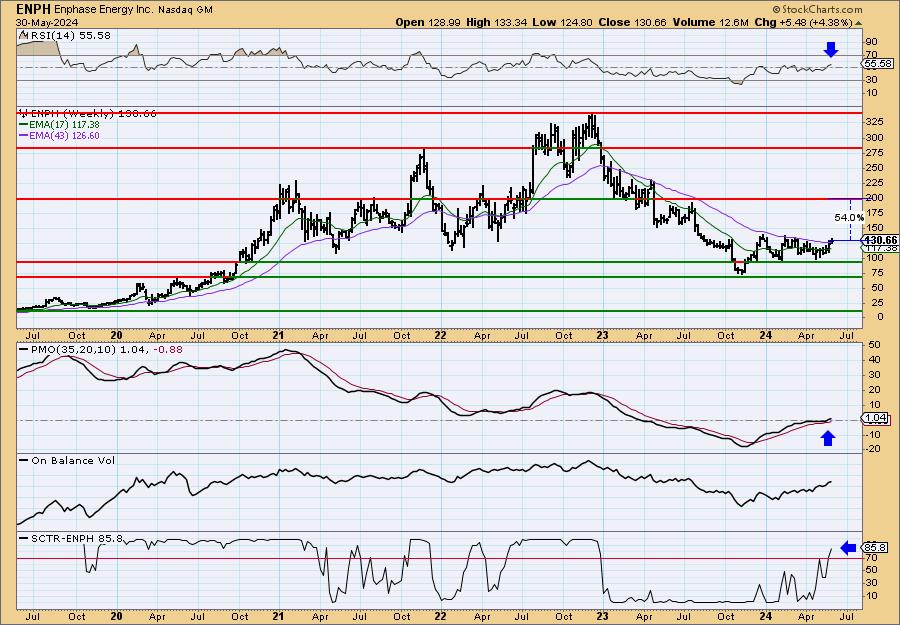
I really like the weekly chart. The weekly RSI is positive and far from being overbought. The weekly PMO surged above the signal line and is rising. The SCTR is in the hot zone above 70. If it breaks out, there isn't strong overhead resistance for some time.
Robinhood Markets Inc. (HOOD)
EARNINGS: 07/31/2024 (AMC)
Robinhood Markets, Inc is a financial services platform that pioneered commission-free stock trading with no account minimums and fractional share trading. The firm is focused on providing retail brokerage and offers trading in U.S. listed stocks and Exchange Traded Funds, related options, and cryptocurrency trading, as well as cash management, which includes debit cards services. The company was founded by Vladimir Tenev and Baiju Prafulkumar Bhatt in 2013 and is headquartered in Menlo Park, CA.
Predefined Scans Triggered: Moved Above Upper Keltner Channel, New 52-week Highs, Stocks in a New Uptrend (Aroon), Moved Above Upper Price Channel, P&F Ascending Triple Top Breakout.
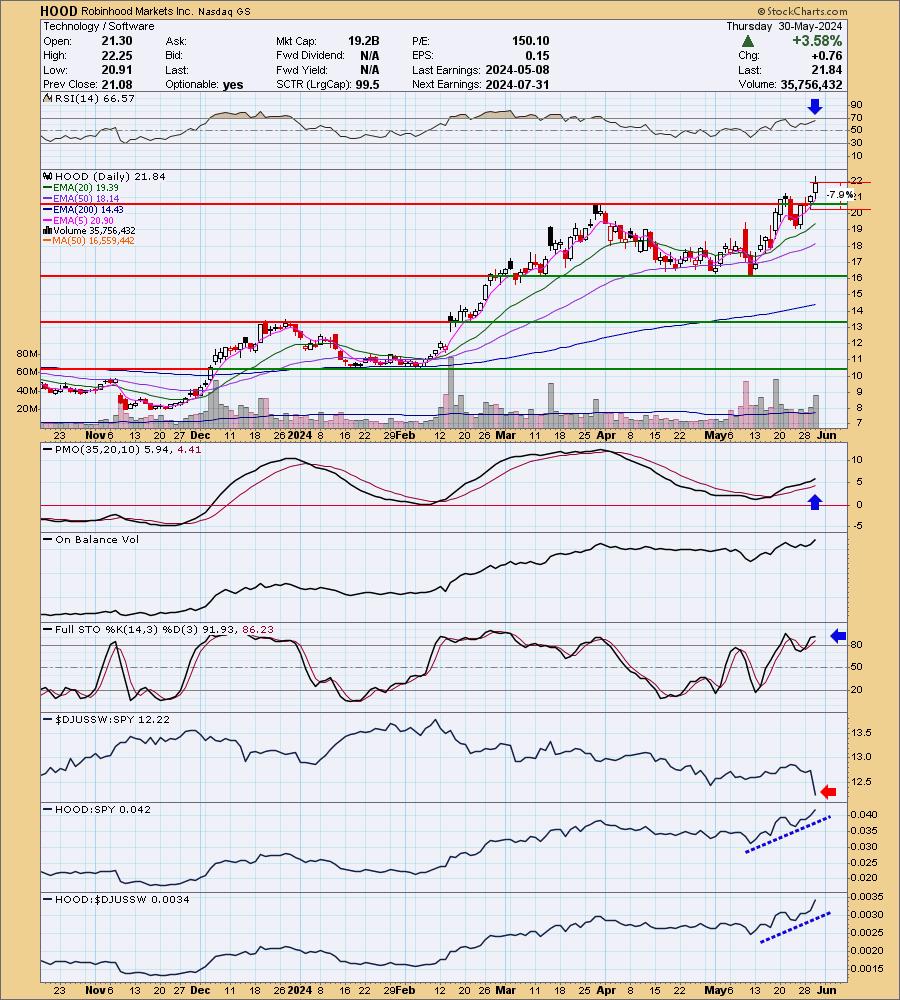
HOOD is down -1.28% in after hours trading. It appears we may be getting the mechanical pullback to the breakout point after hours. It could offer a better entry. I liked this breakout and the strong rally out of a small bull flag. It does suggest more upside to come. The RSI is positive and not overbought. The PMO is rising on a Crossover BUY Signal well above the zero line. The Software group seriously underperformed today, but it didn't bother HOOD in the least. It is showing excellent strength against both the group and the SPY. The stop is set below support at 7.9% or $20.11.
As noted in the opening, the weekly chart definitely suggest we will see higher prices. This is a great looking breakout from a flat basing pattern. The weekly RSI is getting overbought, but it didn't seem to be much of a problem last time. I think we can still get more rally out of this one. The SCTR is at the very top of the hot zone. The weekly PMO has surged above the signal line.
Don't forget, on Thursdays I look at reader-requested symbols, click HERE to send me an email. I read every email I receive and try to answer them all!
Current Market Outlook:
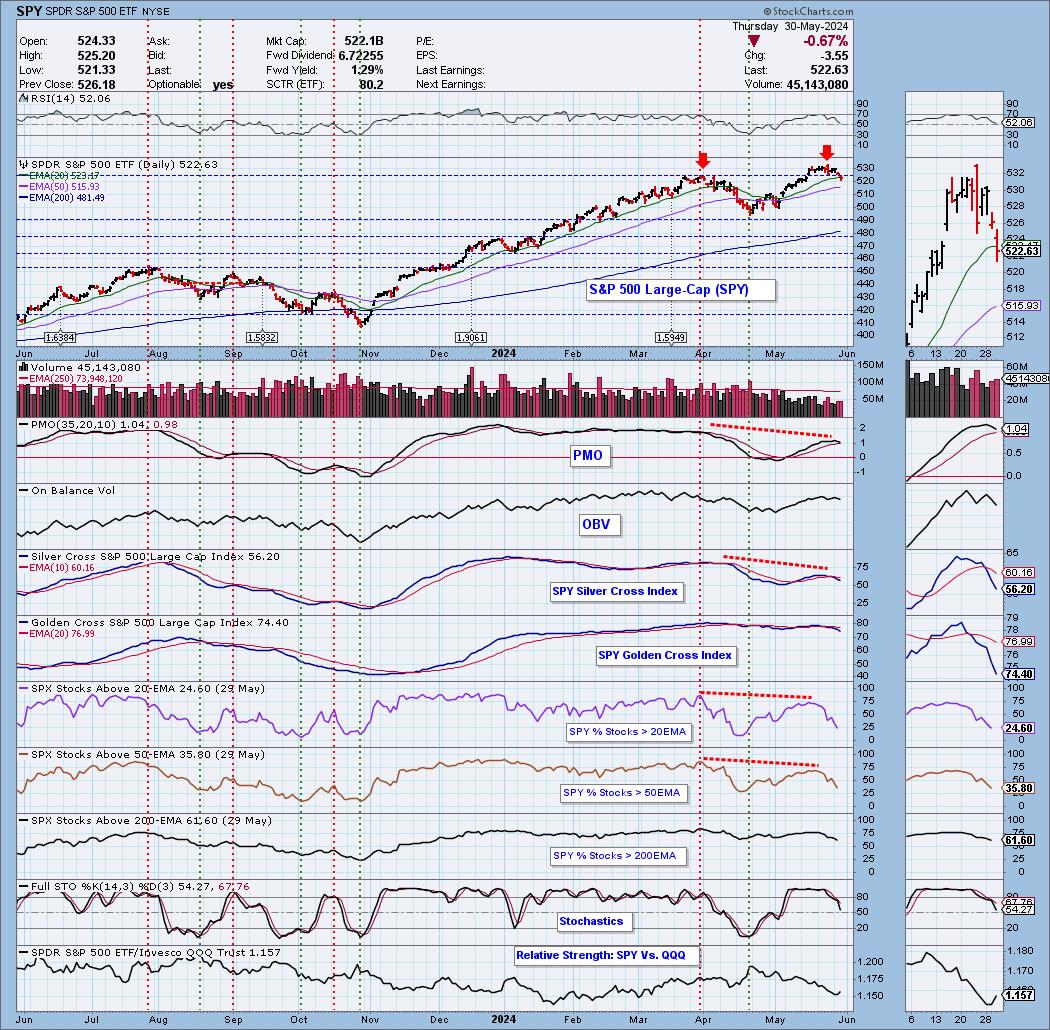
Market Environment: It is important to consider the odds for success by assessing the market tides. The following chart uses different methodologies for objectively showing the depth and trend of participation for intermediate- and long-term time frames.
- The Silver Cross Index (SCI) shows the percentage of SPX stocks on IT Trend Model BUY signals (20-EMA > 50-EMA)
- The Golden Cross Index (GCI) shows the percentage of SPX stocks on LT Trend Model BUY signals (50-EMA > 200-EMA)
Don't forget that as a "Diamonds" member, you have access to our GCI/SCI curated ChartList on DecisionPoint.com. You'll find it under "Members Only" links on the left side on the Blogs and Links Page.
Here is the current chart:
Full Disclosure: I am 30% long, 8% short.
I'm required to disclose if I currently own a stock I mention and/or may buy/short it within the next 72 hours.
"Technical Analysis is a windsock, not a crystal ball." - Carl Swenlin
(c) Copyright 2024 DecisionPoint.com
Watch the latest episode of DecisionPoint Trading Room with Carl & Erin Swenlin Mondays on the DecisionPoint YouTube channel here!
NOTE: The stocks reported herein are from mechanical trading model scans that are based upon moving average relationships, momentum and volume. DecisionPoint analysis is then applied to get five selections from the scans. The selections given should prompt readers to do a chart review using their own analysis process. This letter is not a call for a specific action to buy, sell or short any of the stocks provided. There are NO sure things or guaranteed returns on the daily selection of "Diamonds in the Rough."
Regarding BUY/SELL Signals: The signal status reported herein is based upon mechanical trading model signals and crossovers. They define the implied bias of the price index/stock based upon moving average relationships and momentum, but they do not necessarily call for a specific action. They are information flags that should prompt chart review. Further, they do not call for continuous buying or selling during the life of the signal. For example, a BUY signal will probably (but not necessarily) return the best results if action is taken soon after the signal is generated. Additional opportunities for buying may be found as price zigzags higher, but the trader must look for optimum entry points. Conversely, exit points to preserve gains (or minimize losses) may be evident before the model mechanically closes the signal.
Helpful DecisionPoint Links:
Price Momentum Oscillator (PMO)
Swenlin Trading Oscillators (STO-B and STO-V)
For more links, go to DecisionPoint.com