
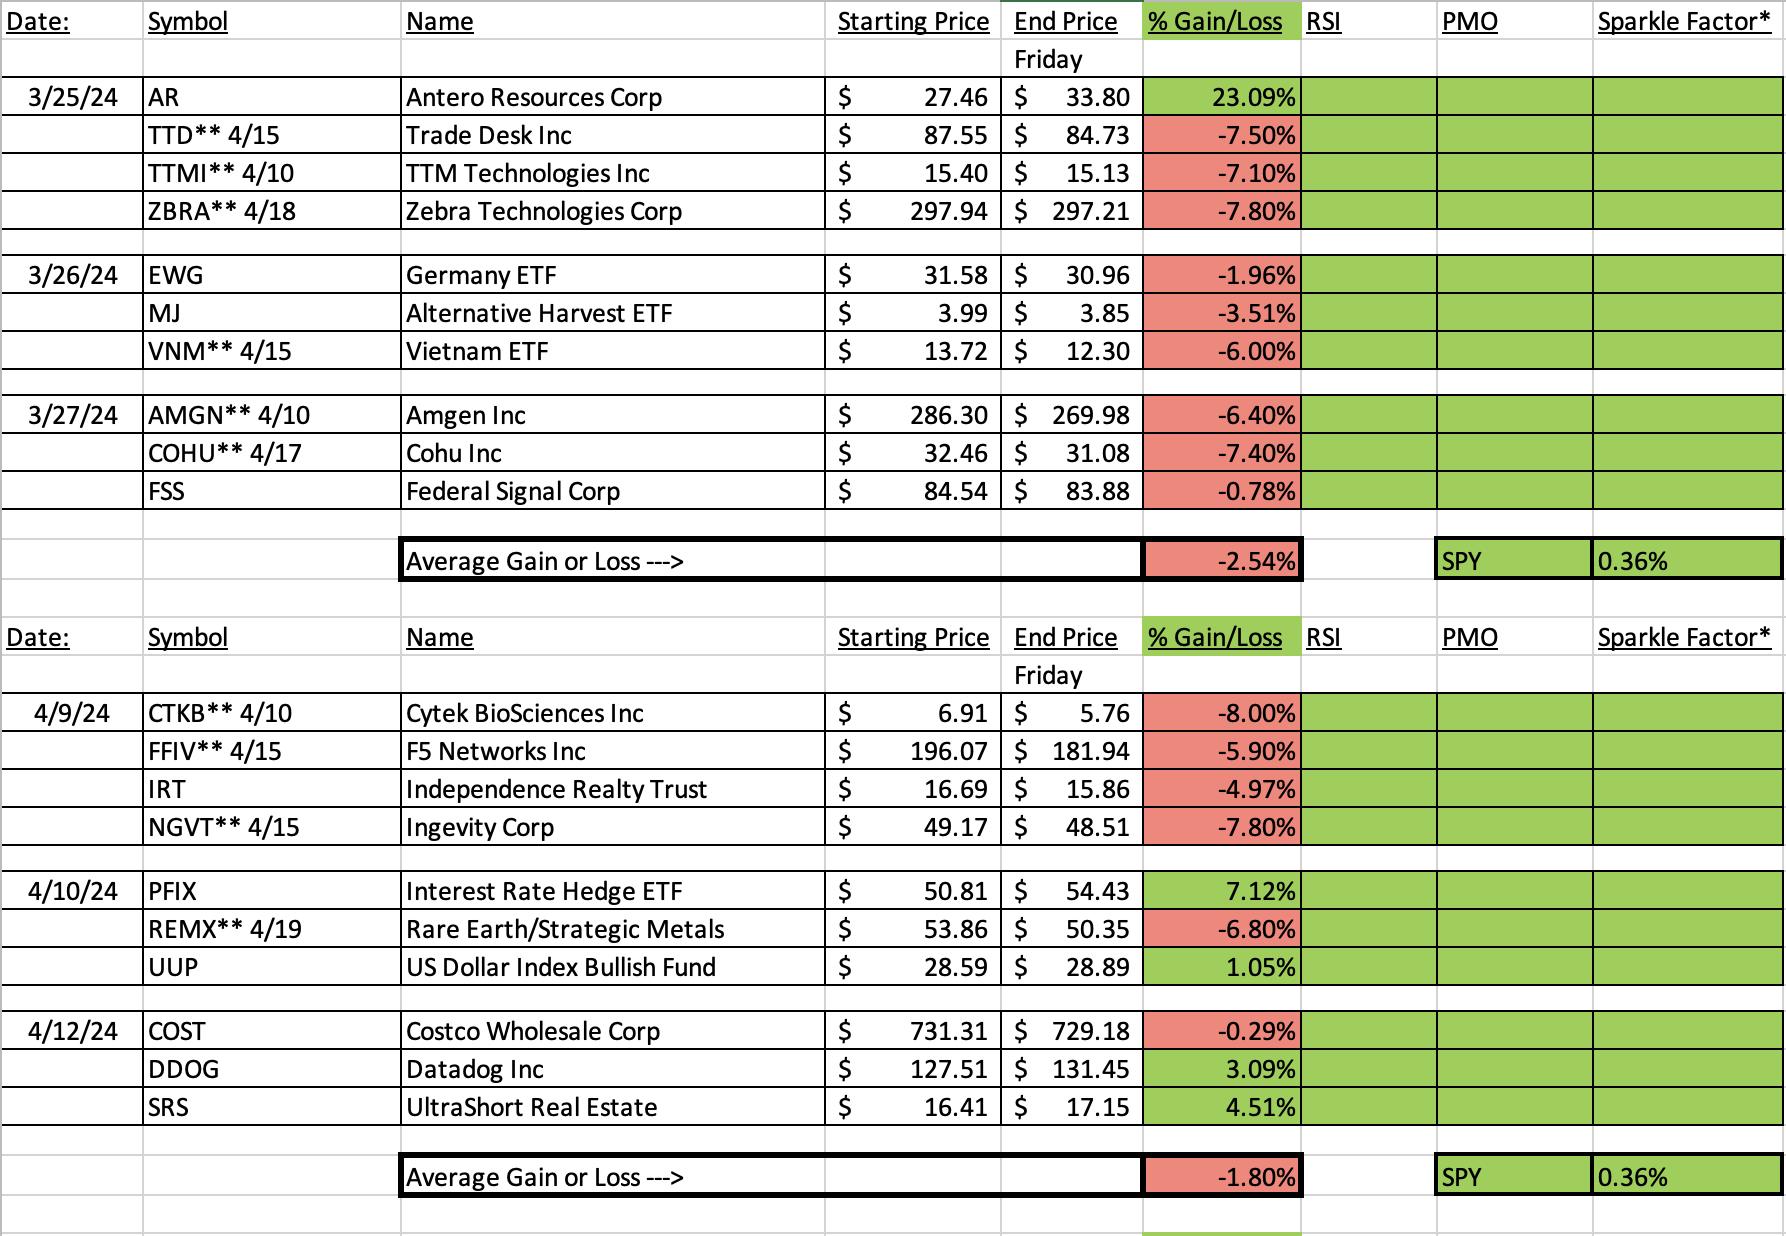
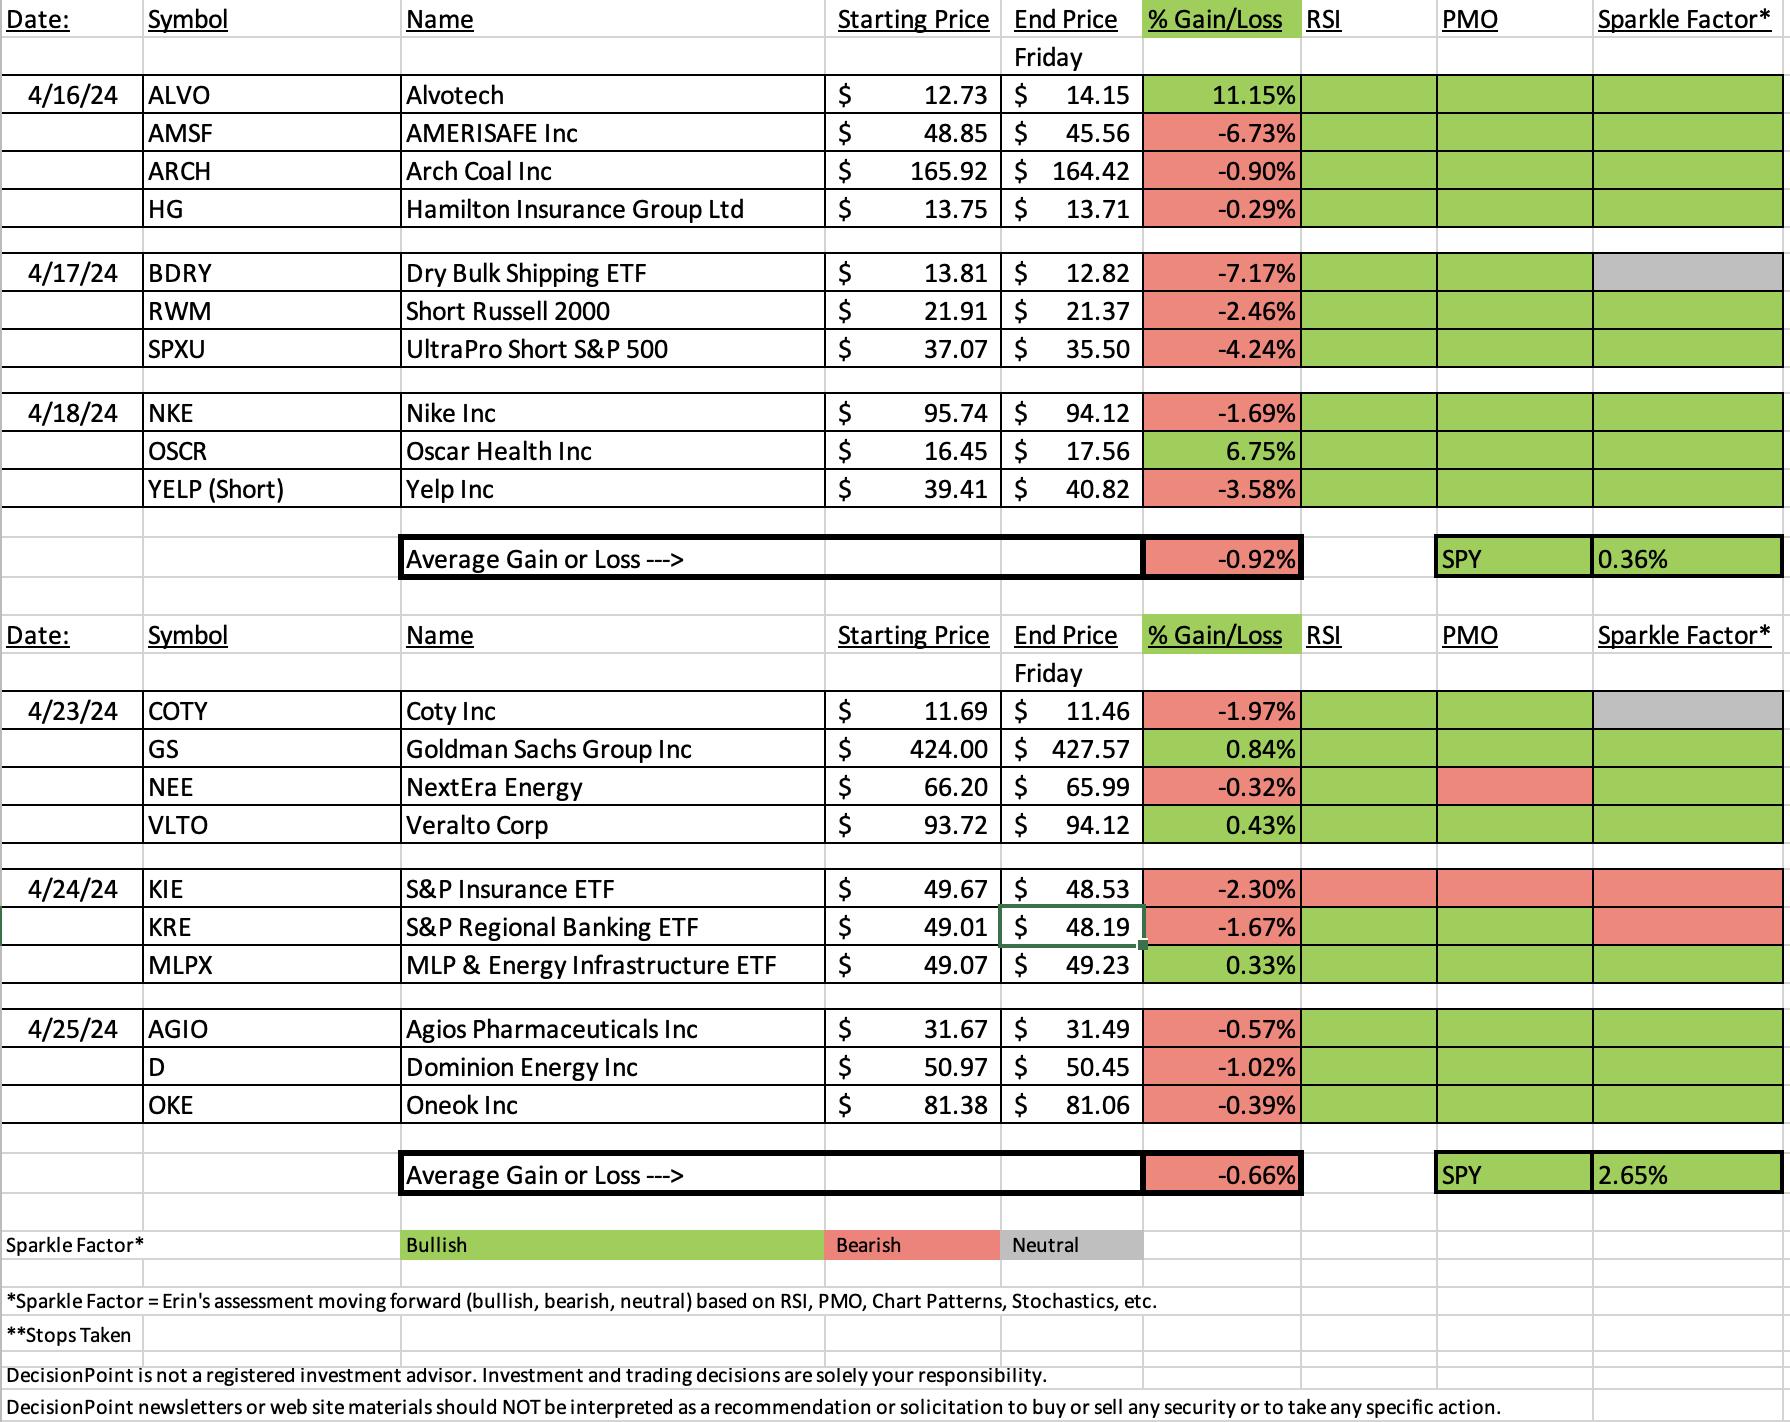
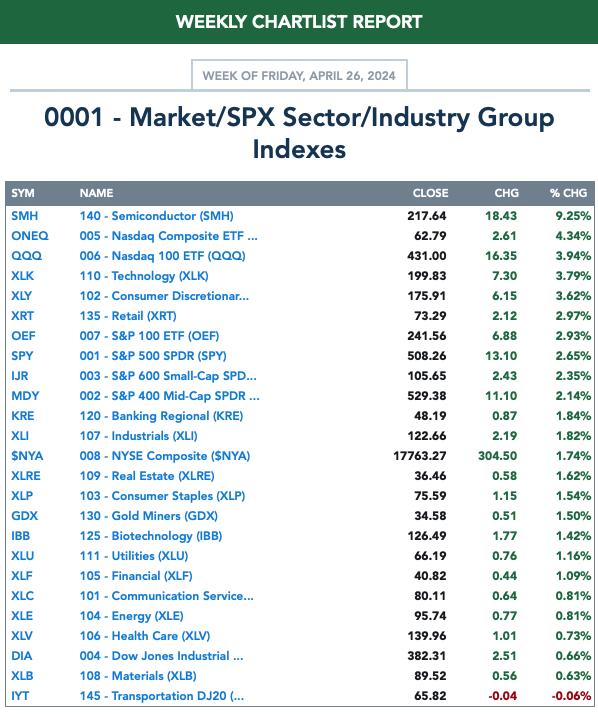
The market rallied strongly higher on the week, up +2.65%. "Diamonds in the Rough" did not perform as well as we would have hoped given that pop in the market. Many of them do have promise moving forward, they may take a little more time to ripen.
The April decline did no favors to our spreadsheet. I will remind that I do not manage the positions once they have been selected. More than likely positions that were stopped out would've been relinquished sooner as we should have watched the PMO and Stochastics closely. But, enough excuses, I will do better.
We were busy in the Diamond Mine this morning but I changed my mind on the Sector to Watch! We uncovered Consumer Discretionary (XLY) as our Sector to Watch this AM, but after the close Technology (XLK) was the clear winner. I'm leaving Specialized Consumer Services as the Industry Group to Watch. Stock symbols from this group included PRDO, LAUR, SCI, APEI, TAL.
We also ran the Momentum Sleepers Scan and were able to find four more symbols to watch next week: COHR, CRUS, PTC and TMHC.
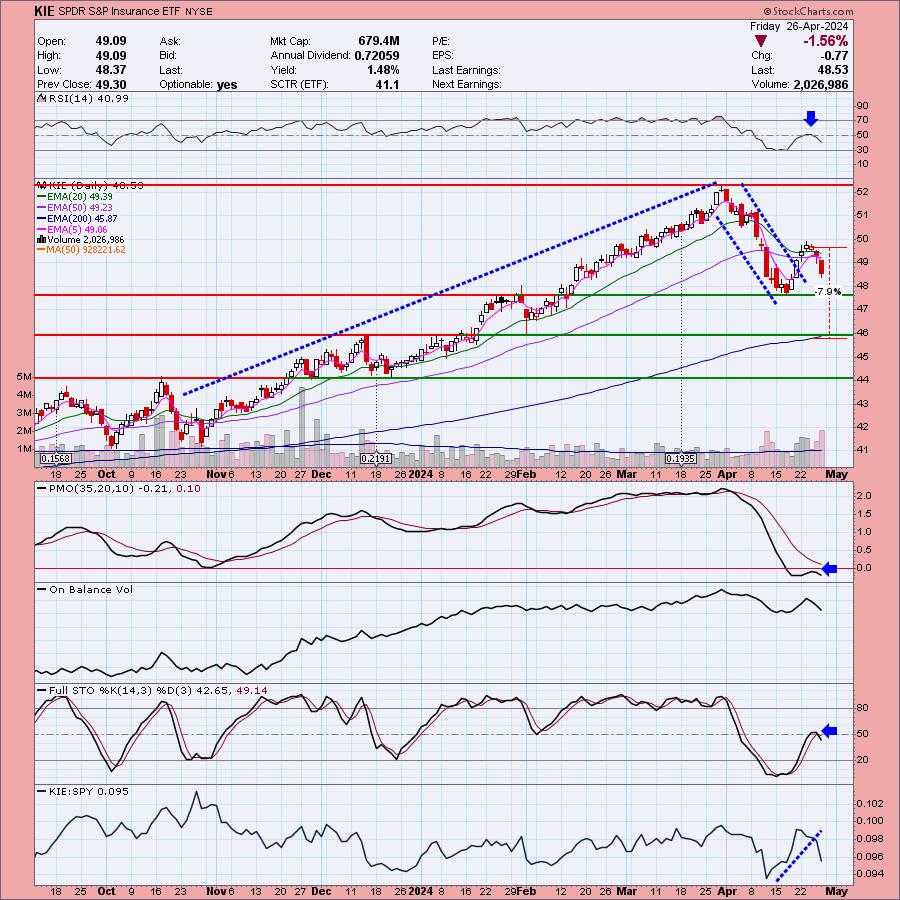
This week's "Dud" is the ETF to avoid. We were starting to see some positive activity in the Financial sector on Bank earnings. Insurance was seeing some nice movement, but after being picked this ETF went south. No need to wait for the stop to be hit on this one.
This week's "Darling" was Goldman Sachs (GS) which continued to rally and looks very good moving forward.
Have a great weekend! See you in the free DecisionPoint Trading Room on Monday at Noon ET!
Good Luck & Good Trading,
Erin

RECORDING & DOWNLOAD LINK (4/26/2024):
Topic: DecisionPoint Diamond Mine (4/26/2024) LIVE Trading Room
Recording & Download Link HERE.
Passcode: April#26
REGISTRATION for 5/3/2024:
When: May 3, 2024 09:00 AM Pacific Time (US and Canada)
Topic: DecisionPoint Diamond Mine (5/3/2024) LIVE Trading Room
Register in advance for this webinar HERE.
After registering, you will receive a confirmation email containing information about joining the webinar.

Below is the latest free DecisionPoint Trading Room recording from 4/22. You'll find these recordings posted on Mondays to our DP YouTube Channel. Be sure and subscribe HERE.
A few items about the spreadsheet: I've put on the spreadsheet whether the RSI is positive (green) or negative (red). The PMO column tells you if it is rising (green) or falling (red). Finally I've added my own "Sparkle Factor" that gives you my assessment going forward, bullish (green), bearish (red) or neutral (gray). The Sparkle Factor is basically my thoughts on whether I expect it to rise or fall. A neutral means it could really go either way so it could be added to a watch list. If you're in a stock I consider "neutral" going forward, the ball is in your court.
Darling:
Goldman Sachs Group, Inc. (GS)
EARNINGS: 07/15/2024 (BMO)
The Goldman Sachs Group, Inc. engages in the provision of financial services. It operates through the following business segments: Global Banking and Markets, Asset and Wealth Management, and Platform Solutions. The Global Banking and Markets segment includes investment banking, global investments, and equity and debt investments. The Asset and Wealth Management segment relates to the direct-to-consumer banking business which includes lending, deposit-taking, and investing. The Platform Solutions segment includes consumer platforms such as partnerships offering credit cards and point-of-sale financing, and transaction banking. The company was founded by Marcus Goldman in 1869 and is headquartered in New York, NY.
Predefined Scans Triggered: New CCI Buy Signals, New 52-week Highs, P&F Spread Triple Top Breakout, Moved Above Upper Bollinger Band, Stocks in a New Uptrend (Aroon), Moved Above Upper Price Channel and P&F Double Top Breakout.
Below are the commentary and chart from Tuesday, 4/23:
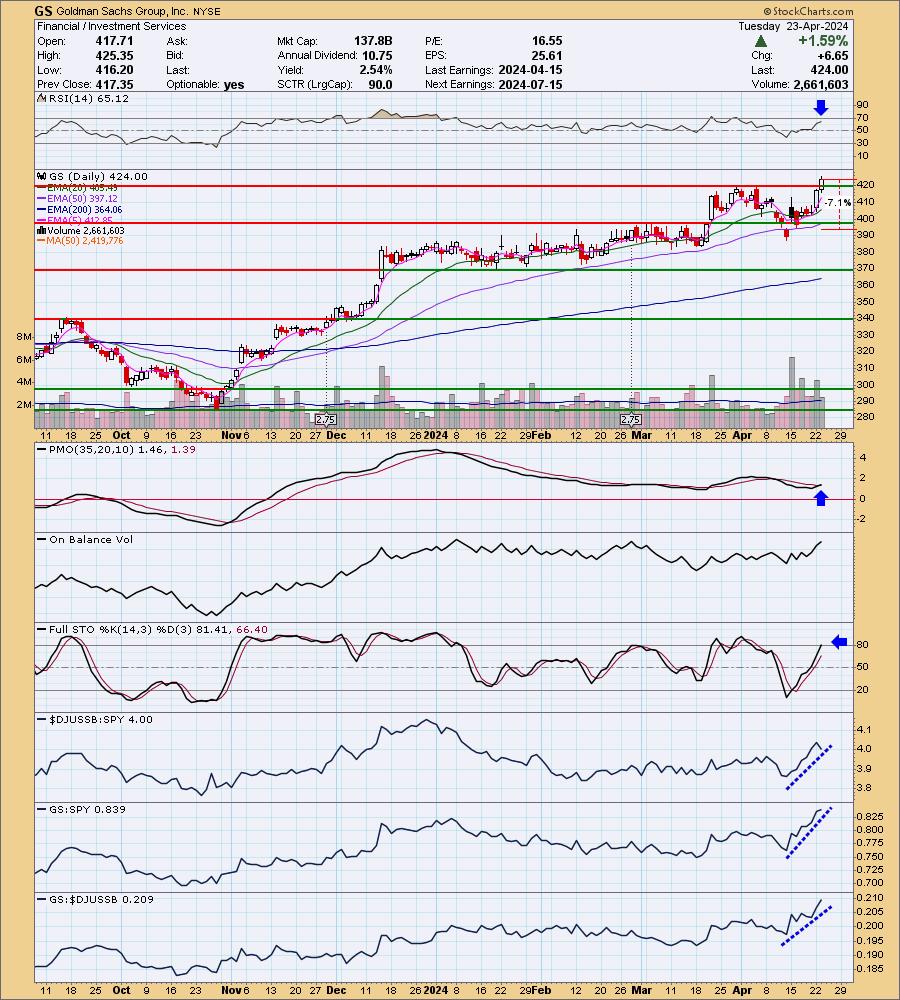
"GS is up +0.12% in after hours trading. I liked today's breakout to new 52-week highs today. The RSI is positive and there is a PMO Crossover BUY Signal above the zero line. Stochastics just moved above 80. Relative strength is fantastic right now with relative strength lines moving almost vertically higher. The stop is set beneath support at 7.1% or $393.89."
Here is today's chart:
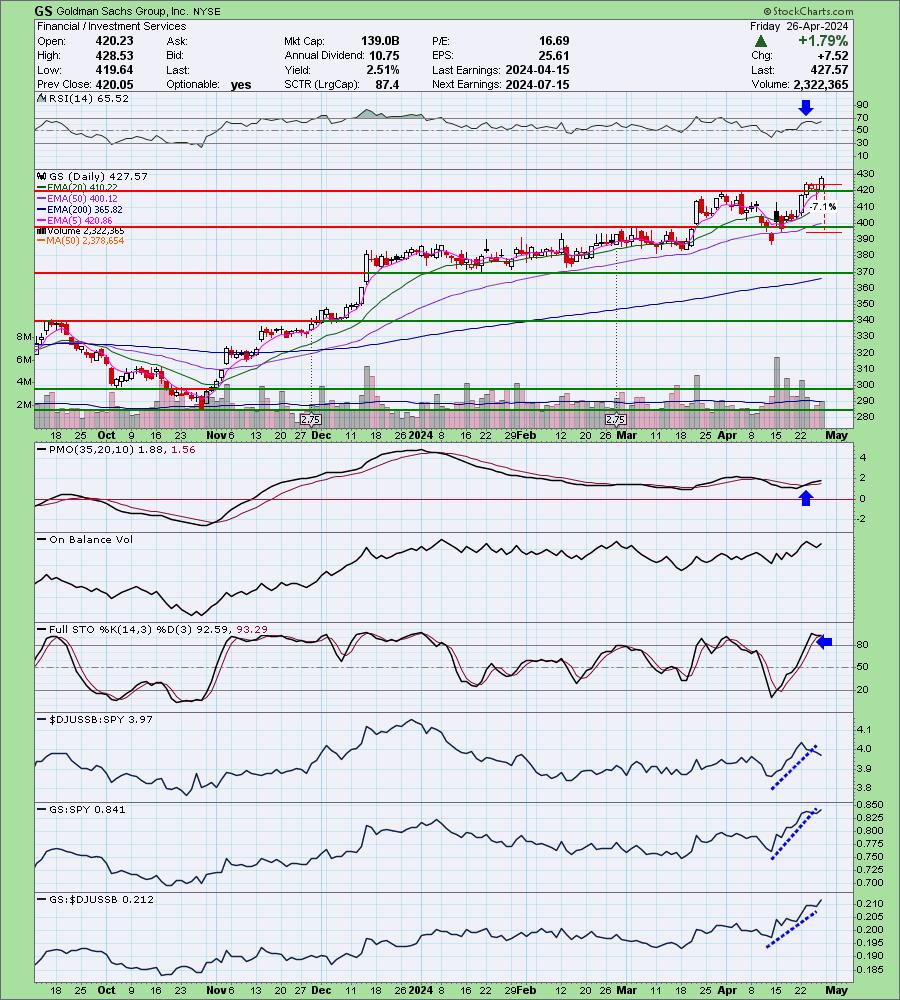
The breakout is still holding strong. The RSI isn't overbought yet so I think this one is still ripe for entry. The PMO is mostly flat above the zero line so we see strength. Stochastics remain above 80. The group is beginning to fail so there will be some headwind, but it is still outperforming the SPY.
Don't forget, on Thursdays I look at reader-requested symbols, so shoot me an email at erin@decisionpoint.com. I read every email I receive and try to answer them all!
Dud:
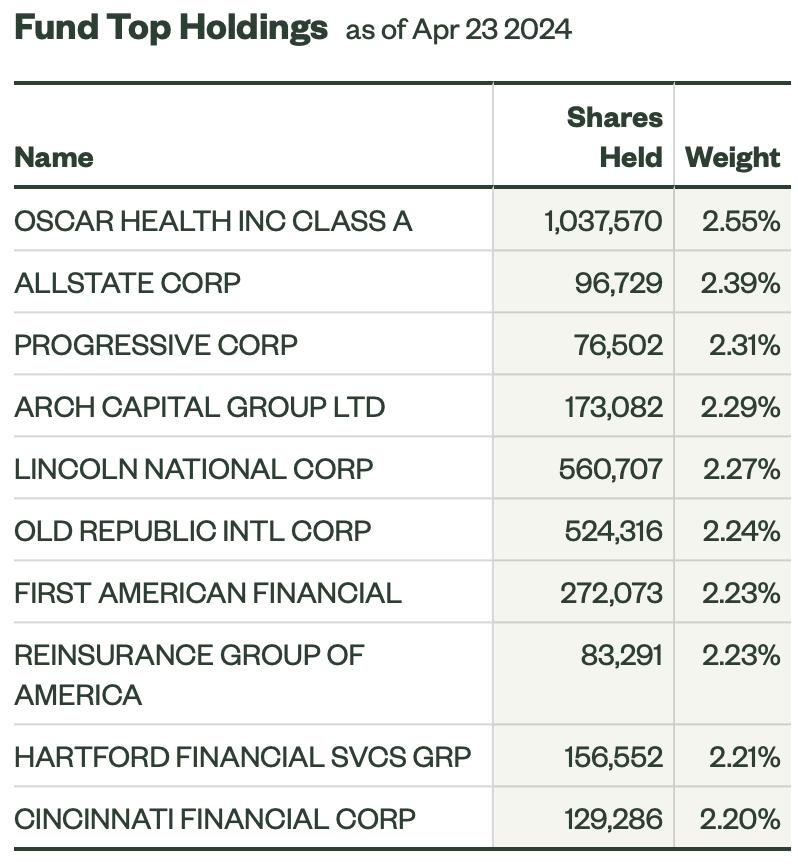
SPDR S&P Insurance ETF (KIE)
EARNINGS: N/A
KIE tracks an equal-weighted-index of insurance companies, as defined by GICS. Click HERE for more information.
Predefined Scans Triggered: Hollow Red Candles.
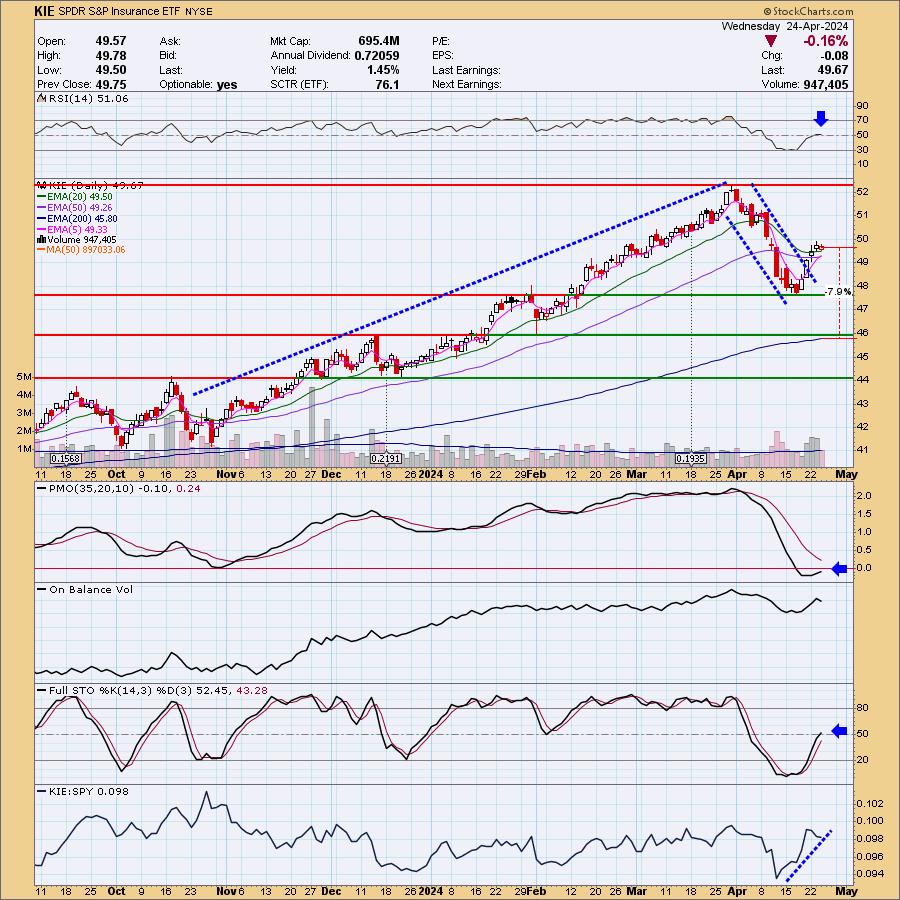
Below are the commentary and chart from Wednesday, 4/24:
"KIE is down -0.23% in after hours trading. We have a giant bull flag formation that immediately caught my eye. The breakout is confirming the pattern and suggests we could see a move that is the height of the flagpole! I don't think that will happen, but it certainly makes this one interesting in the intermediate term. The RSI is positive and not at all overbought. The PMO is curling up toward a Crossover BUY Signal. Stochastics just moved into positive territory. Relative strength looks good, but I do note a good portion of the outperformance came during its decline which was not as hefty as the SPY. Still this is positive. The stop is set at the 200-day EMA at 7.9% or $45.74."
Here is today's chart:
Where did this one go wrong? The set up was excellent coming out of the bull flag formation. Sometimes they just go south. We haven't had one that failed like this out of the gate in some time. The PMO topped beneath the signal line and that is all I need to close this investment out. Stochastics are confirming.
THIS WEEK's Performance:
DecisionPoint Market Scoreboard (Mechanical Trend Model Signals): 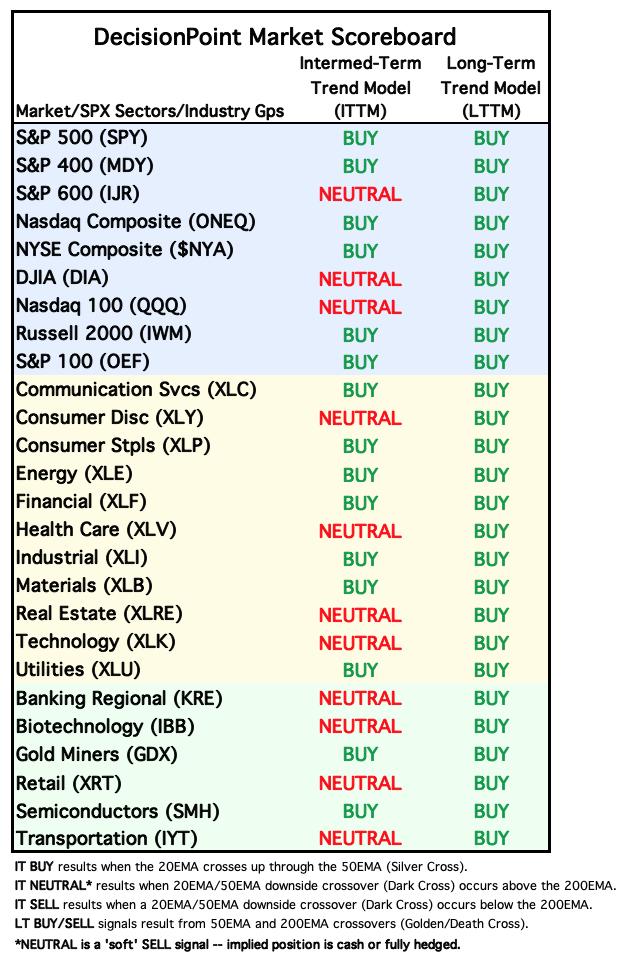
Friday signal changes are outlined in purple.
Click Here to view Carl's annotated "Under the Hood" ChartList!
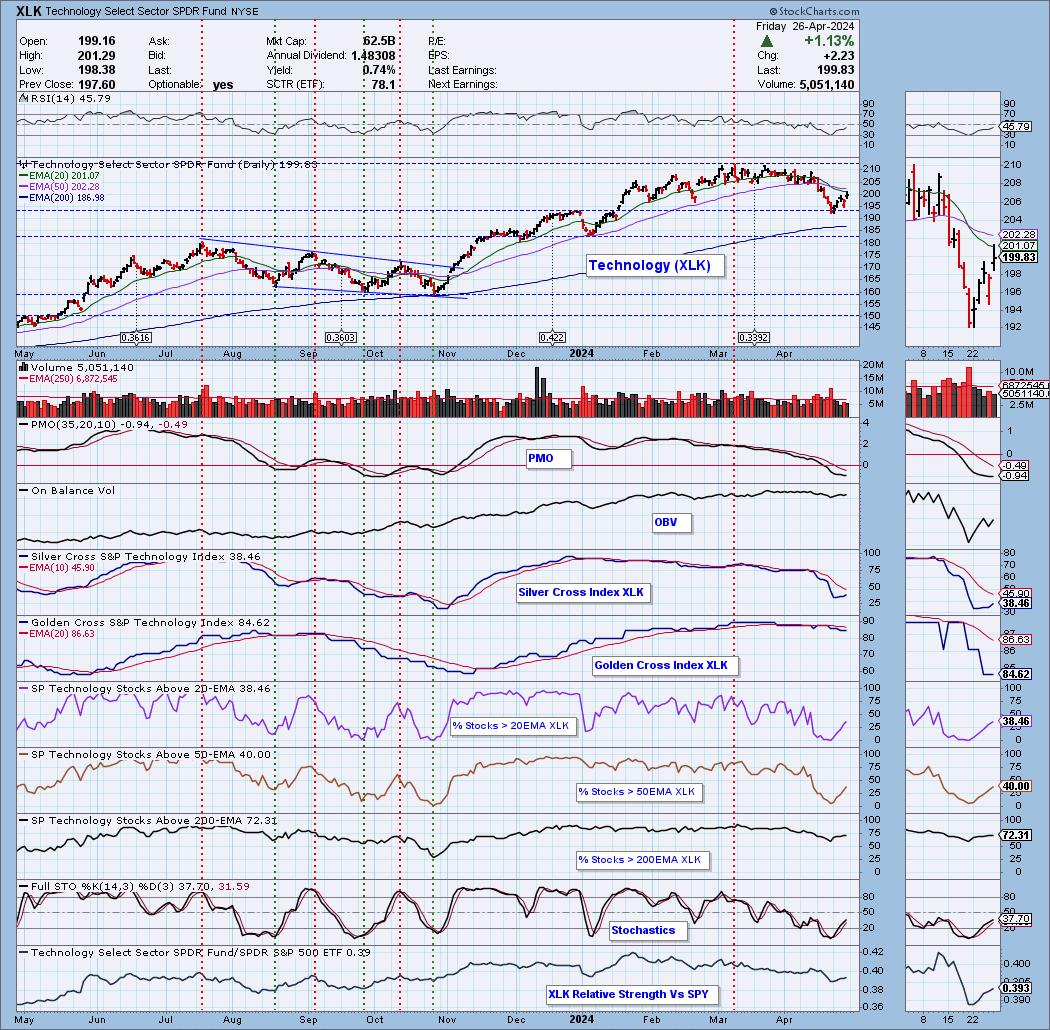
Sector to Watch: Technology (XLK)
One of the reasons I did NOT want to pick XLK was that the PMO is still technically declining. However, the strong increase in participation of stocks above their 20/50EMAs was very good. Stochastics are rising and we have a small double bottom pattern similar to the one on the SPY. Relative strength is expanding. If the Fed is too hawkish next week, this sector will feel the brunt of the pain so be very careful expanding your portfolio in general.
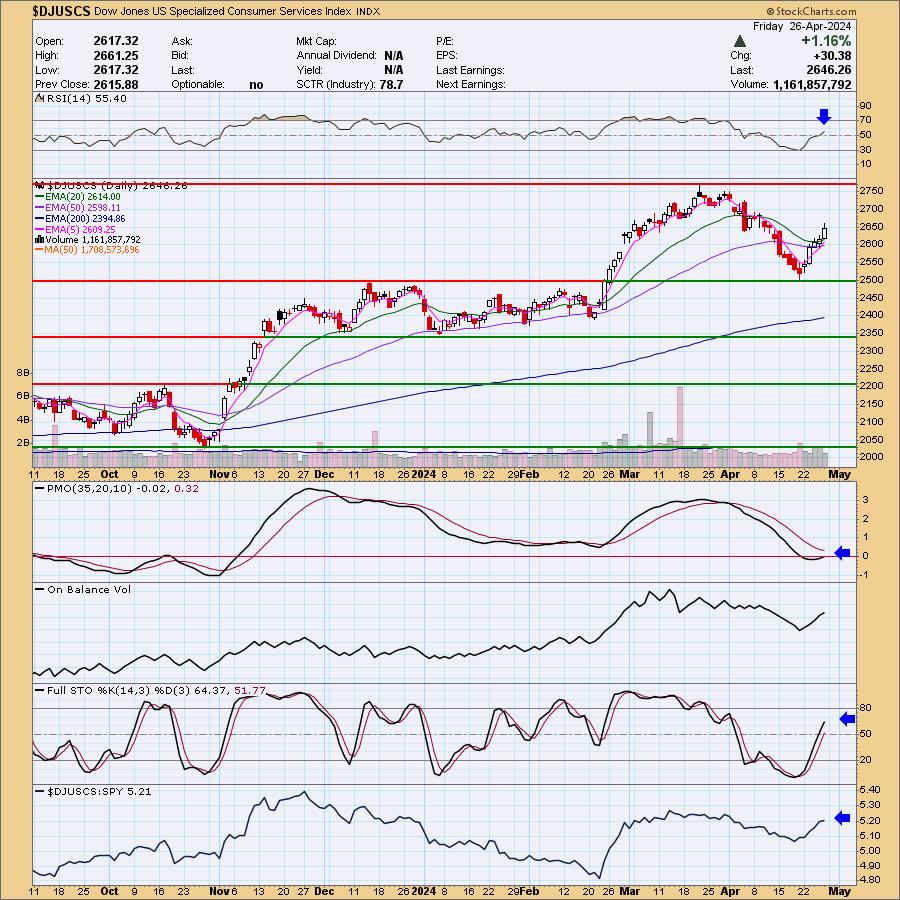
Industry Group to Watch: Specialized Consumer Services ($DJUSCS)
We have a nice bounce of support and price is now above both the 20/50-day EMAs. The RSI is not overbought suggesting this move is just getting started. The PMO is curling up toward a Crossover BUY Signal. The OBV shows that volume is definitely coming in on this move. Stochastics are rising and we are seeing outperformance against the SPY. The symbols we found in this area: PRDO, LAUR, SCI, APEI and TAL.
Go to our Under the Hood ChartList on DecisionPoint.com to get an in-depth view of all the sectors. On StockCharts.com you can find the Industry Summary.
Good Luck & Good Trading!
- Erin
erin@decisionpoint.com
Full Disclosure: I'm 30% long, 0% short.
Watch the latest episode of the DecisionPoint Trading Room with Carl & Erin Swenlin on Mondays 3:00p EST!
Technical Analysis is a windsock, not a crystal ball. --Carl Swenlin
NOTE: The stocks reported herein are from mechanical trading model scans that are based upon moving average relationships, momentum and volume. DecisionPoint analysis is then applied to get selections from the scans. The selections given should prompt readers to do a chart review using their own analysis process. This letter is not a call for a specific action to buy, sell or short any of the stocks provided. There are NO sure things or guaranteed returns on the selection of "diamonds in the rough."
Helpful DecisionPoint Links:
DecisionPoint Shared ChartList and DecisionPoint Chart Gallery
Price Momentum Oscillator (PMO)
Swenlin Trading Oscillators (STO-B and STO-V)
(c) Copyright 2024 DecisionPoint.com