
As usual I started the day by running my scans to see what "Diamonds in the Rough" I could uncover. What was interesting is that NVIDIA (NVDA) came up in two scans. Another powerhouse would be Super Micro Computers (SMCI). I'm not presenting either. I don't think SMCI is up to snuff. NVDA is one you all follow so no need for me to present it. I think NVDA does look pretty good, but I worry about the market (full disclosure: I own NVDA). I like to notify you if any big names appear in the scans.
Healthcare saw a lot of action in the scans and Real Estate seems to be back in favor. I have a Diamond in the Rough for each of those sectors.
The market is acting toppy again with economic news putting a damper on this new rally. This could seep into our Diamonds in the Rough so be sure to set those stops if you decide to ride one of today's selections. If there is one thing I have learned, we must invest with the trend. You'll note Diamonds almost always take a turn for the worse when the market pulls back. The trend is currently up but it looks more iffy now than it did yesterday.
Keep an eye on earnings dates. I do have three reporting this week. You can enter, but you never know how earnings will be received so maybe holding off isn't a bad idea or be prepared to be nimble. Hope the spreadsheet remains positive after these earnings calls.
Good Luck & Good Trading,
Erin
Today's "Diamonds in the Rough": COLL, CTRE, TTEK and WING.
Other requests: SEM, NVDA, DVA, MELI and TNDM.

RECORDING & DOWNLOAD LINK (4/26/2024):
Topic: DecisionPoint Diamond Mine (4/26/2024) LIVE Trading Room
Recording & Download Link HERE.
Passcode: April#26
REGISTRATION for 5/3/2024:
When: May 3, 2024 09:00 AM Pacific Time (US and Canada)
Topic: DecisionPoint Diamond Mine (5/3/2024) LIVE Trading Room
Register in advance for this webinar HERE.
After registering, you will receive a confirmation email containing information about joining the webinar.

Here is the latest recording from 4/29. Click HERE to subscribe to the DecisionPoint YouTube Channel to be notified when new content is available.
Welcome to DecisionPoint Diamonds, wherein I highlight ten "Diamonds in the Rough" per week. These are selected from the results of my DecisionPoint Scans which search for stocks that could benefit from the trend and condition of the market. Remember, these are not recommendations to buy or sell, but are the most interesting of the stocks that surfaced in my scans. My objective is to save you the work of the initial, tedious culling process, but you need to apply your own analysis to see if these stocks pique your interest as well. There are no guaranteed winners here!
"Predefined Scans Triggered" are taken from StockCharts.com using the "Symbol Summary" option instead of a "SharpChart" on the workbench.
Stop levels are all rounded down.
Collegium Pharmaceutical, Inc. (COLL)
EARNINGS: 05/09/2024 (AMC)
Collegium Pharmaceutical, Inc. is a pharmaceutical company, which engages in development and planning to commercialize next generation, abuse-deterrent products for the treatment of patients suffering from chronic pain and other diseases. Its products include Xtampza ER, Nucynta ER and Nucynta IR, Belbuca, and Symproic. The company was founded by Michael Thomas Heffernan in April 2002 and is headquartered in Stoughton, MA.
Predefined Scans Triggered: Bullish MACD Crossovers.
COLL is unchanged in after hours trading. We have a nice cup shaped basing pattern off support at the January high. These are usually good patterns for upside follow through. The RSI is positive now and the PMO is beginning to rise toward a Crossover BUY Signal. Stochastics are rising and have hit positive territory. The OBV is confirming the rising trend. Relative strength lines are rising. I've set the stop beneath support at 7.7% or $34.08.

I don't care for the weekly chart primarily because the weekly PMO is going in for a Crossover SELL Signal. However, the weekly RSI is positive and rising again with price. The StockCharts Technical Rank (SCTR) is in the hot zone* above 70. Consider a 17% upside target to about $43.20.
*If a stock is in the "hot zone" above 70, it implies that it is stronger than 70% of its universe (large-, mid-, small-caps and ETFs) primarily in the intermediate to long terms.

CareTrust REIT, Inc. (CTRE)
EARNINGS: 05/02/2024 (AMC) ** Reports Thursday! **
CareTrust REIT, Inc. engages in the ownership, acquisition, and leasing of healthcare-related properties. It offers independent living, memory care, and assisted, and skilled nursing facilities. The company was founded on October 29, 2013 and is headquartered in San Clemente, CA.
Predefined Scans Triggered: New 52-week Highs, Stocks in a New Uptrend (ADX) and P&F Double Top Breakout.
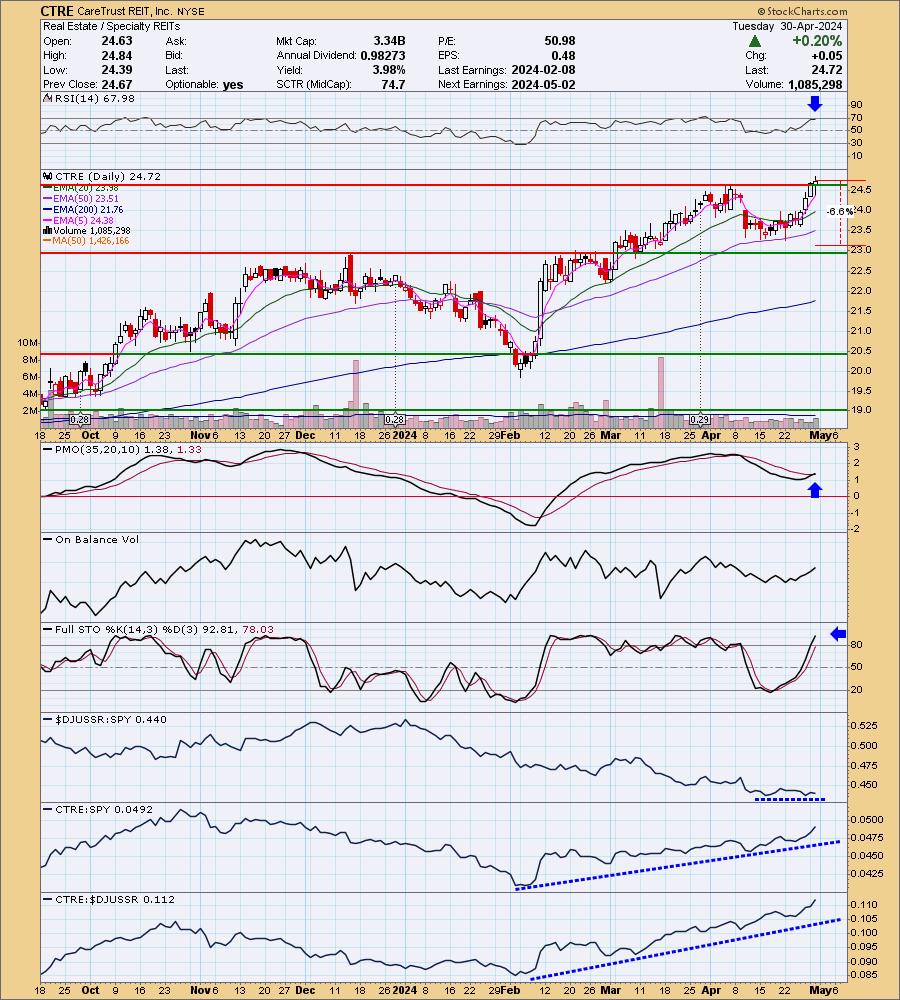
CTRE is down -0.05% in after hours trading. It reports Thursday. This run up into earnings is encouraging. I particularly liked today's breakout combined with a PMO Crossover BUY Signal well above the zero line signaling strength. Stochastics are also strong above 80 and the RSI is so far not overbought. The industry group is performing in line with the benchmark SPY and CTRE is clearly showing a leadership role against the group and the SPY. The stop is set beneath support at 6.6% or $23.08.
I really like the weekly chart. The breakout to new 52-week highs looks great. The weekly RSI is positive and not yet overbought. The SCTR is in the hot zone and the weekly PMO has surged (bottomed) above the signal line. Consider a 17% upside target around $28.92.

Tetra Tech Inc. (TTEK)
EARNINGS: 05/01/2024 (AMC) ** Reports Tomorrow! **
Tetra Tech, Inc. engages in the provision of consulting and engineering services that focus on water, environment, infrastructure, renewable energy, and international development. It operates through the following segments: Government Services Group (GSG) and Commercial and International Services Group (CIG). The GSG segment offers consulting and engineering services primarily to United States government clients such as federal, state and local, and development agencies worldwide. The CIG segment provides consulting and engineering services to US commercial clients and international clients inclusive of the commercial and government sectors, as well as infrastructure, environmental, engineering, and project management services across Canada, Australia, New Zealand, the United Kingdom, Brazil, and Chile. The company was founded in 1966 and is headquartered in Pasadena, CA.
Predefined Scans Triggered: New CCI Buy Signals, New 52-week Highs, Stocks in a New Uptrend (Aroon), P&F Ascending Triple Top Breakout and P&F Double Top Breakout.
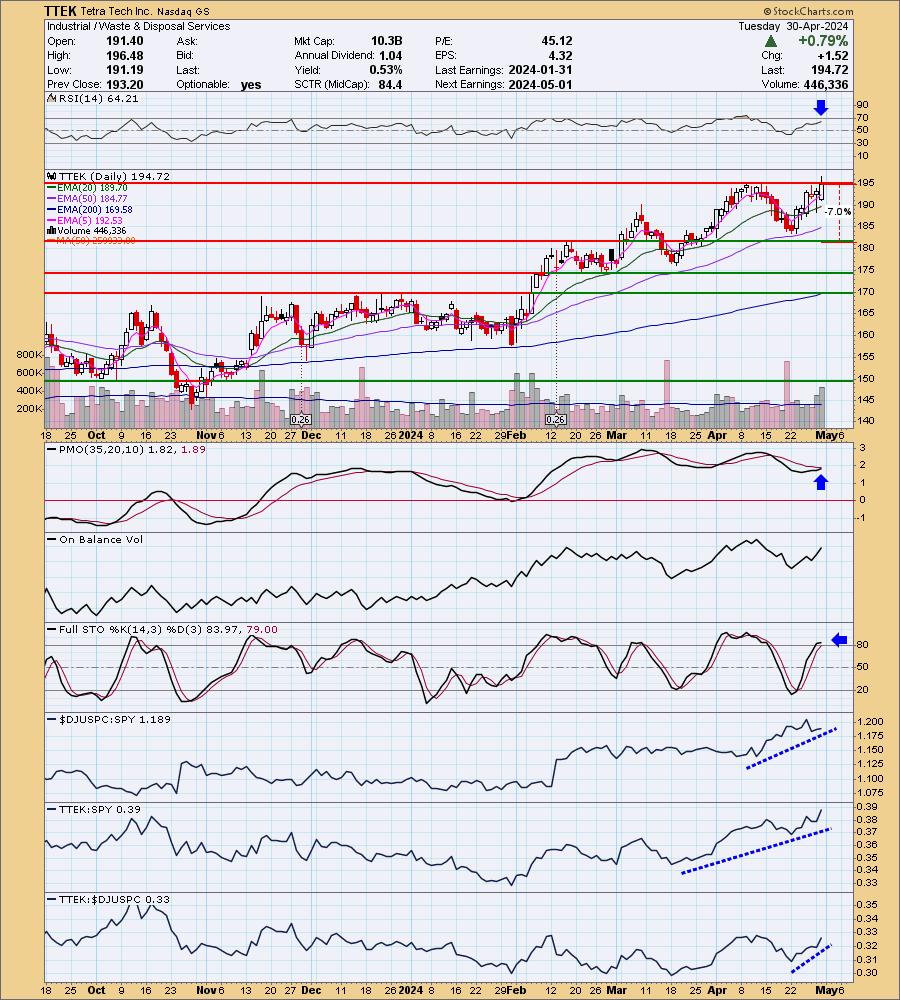
TTEK is up +1.04% in after hours trading. This one is also seeing a positive run going into earnings. They report tomorrow after the close. We have a tiny breakout, but it put TTEK at new 52-week highs. If it tops here, I wouldn't stick around long as that would set up a bearish double top. The indicators suggest that won't happen. The RSI is positive and not overbought. The PMO is going in for a Crossover BUY Signal well above the zero line. Stochastics are above 80 and the OBV is rising to confirm the rally. Relative strength is really picking up. I've set the stop beneath support at 7.0% or $181.09.
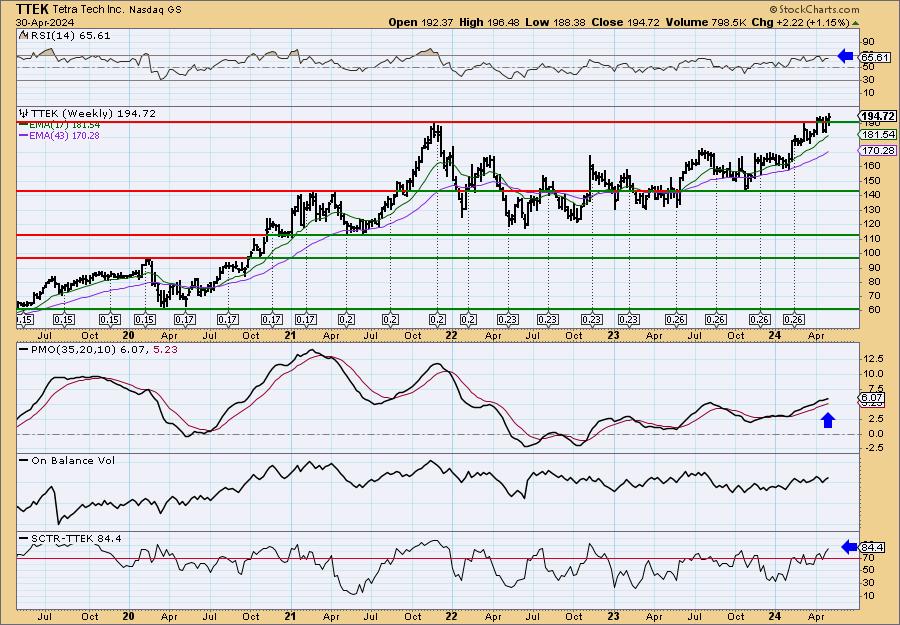
This is a strong weekly chart which shows us that this breakout was especially positive coming off support at the 2021 high. The weekly RSI is positive and not overbought. The weekly PMO is rising above the zero line and the SCTR is in the hot zone. Consider a 17% upside target to about $227.82.
Wingstop Inc. (WING)
EARNINGS: 05/01/2024 (BMO) ** Reports Tomorrow **
Wingstop, Inc. is a franchisor and operator of restaurants, which engages in the provision of cooked-to-order, hand-sauced, and tossed chicken wings. The company was founded in 1994 and is headquartered in Addison, TX.
Predefined Scans Triggered: Hollow Red Candles and P&F Double Top Breakout.
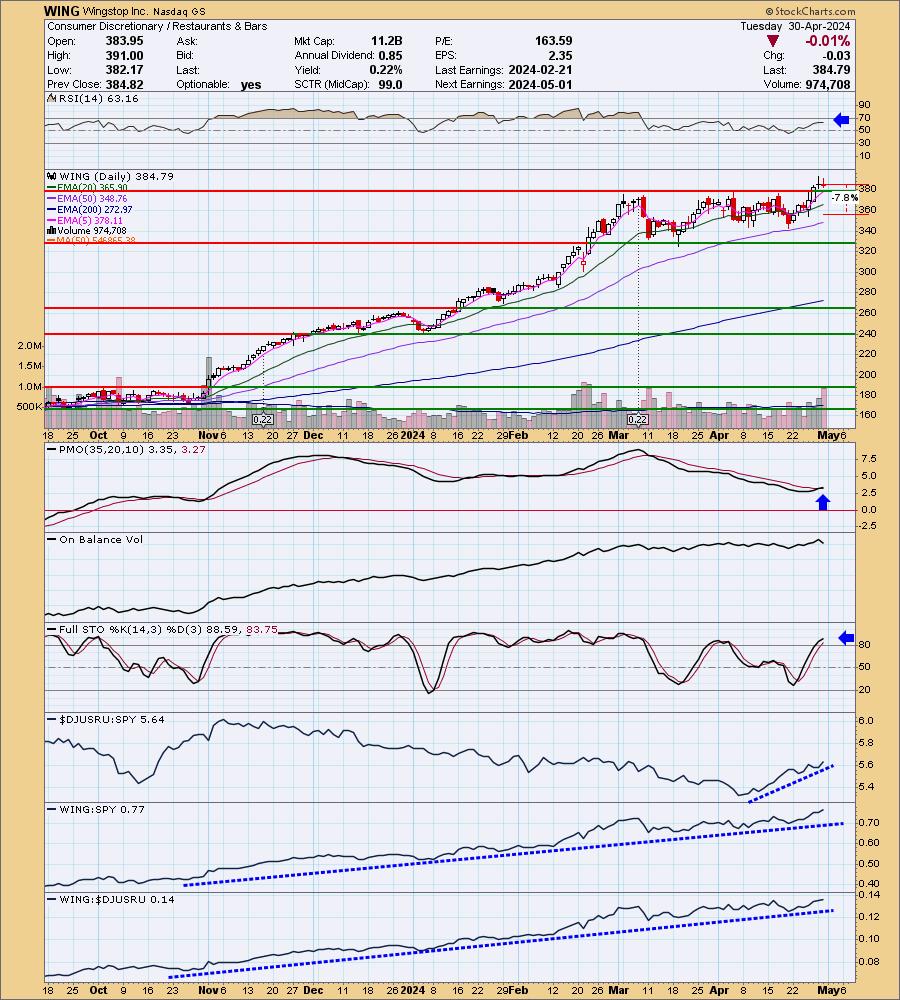
WING is up +0.08% in after hours trading. This is positive as it reports in the morning. I like the breakout here, that is what attracted me in conjunction with the PMO Crossover BUY Signal that is occurring above the zero line. The RSI is positive and not overbought. The OBV made a new high with price. Stochastics are above 80. Relative strength studies are very bullish. The group is really outperforming and WING shows leadership within that group. It has been outperforming for quite awhile. The stop is set between the 20-day EMA and the 50-day EMA at 7.8% or $354.77.
The weekly chart is positive given the breakout and very strong SCTR ranking. The weekly RSI is overbought, but that hasn't bothered it all year. The weekly PMO has surged above the signal line well above the zero line. Consider an upside target of about 17% or $450.20.

Don't forget, on Thursdays I look at reader-requested symbols, click HERE to send me an email. I read every email I receive and try to answer them all!
Current Market Outlook:
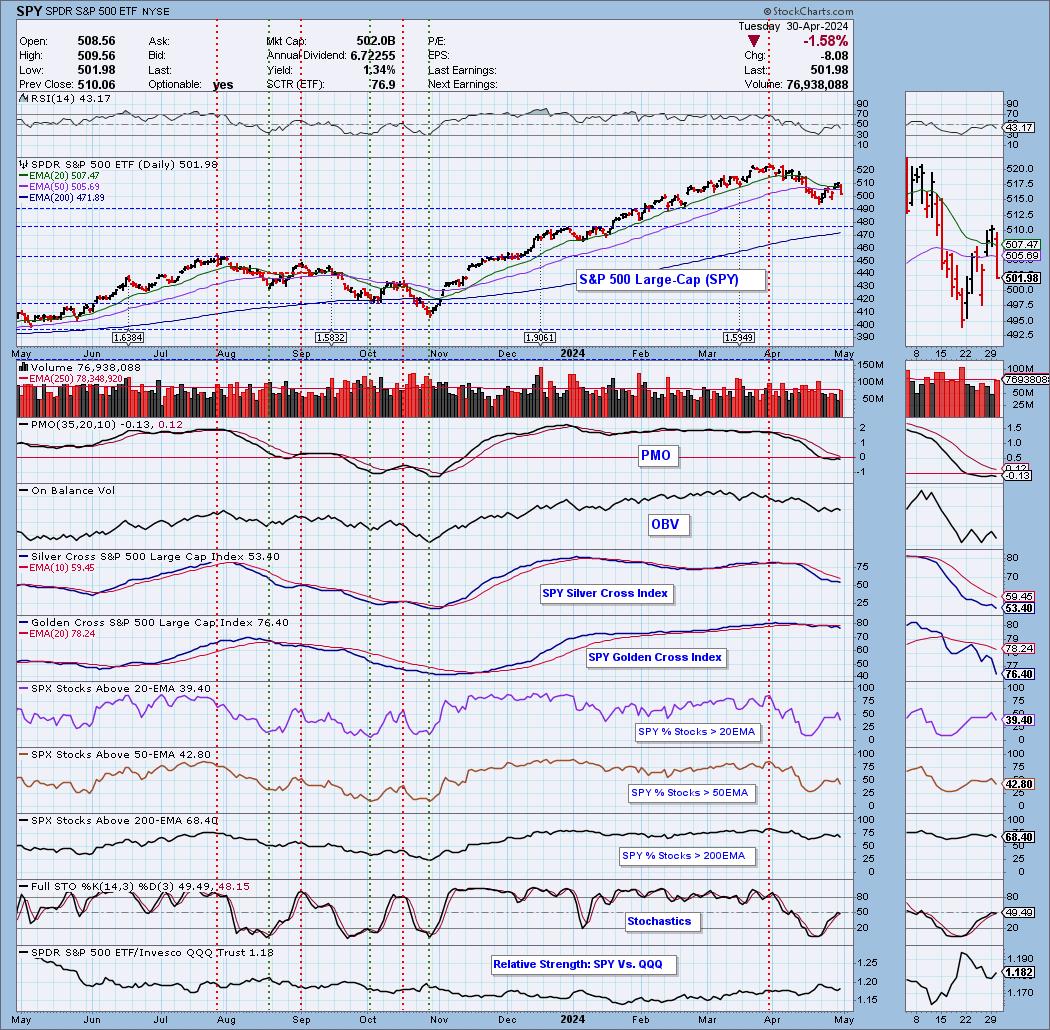
Market Environment: It is important to consider the odds for success by assessing the market tides. The following chart uses different methodologies for objectively showing the depth and trend of participation for intermediate- and long-term time frames.
- The Silver Cross Index (SCI) shows the percentage of SPX stocks on IT Trend Model BUY signals (20-EMA > 50-EMA)
- The Golden Cross Index (GCI) shows the percentage of SPX stocks on LT Trend Model BUY signals (50-EMA > 200-EMA)
Don't forget that as a "Diamonds" member, you have access to our GCI/SCI curated ChartList on DecisionPoint.com. You'll find it under "Members Only" links on the left side on the Blogs and Links Page.
Here is the current chart:
Full Disclosure: I am 30% long, 0% short.
I'm required to disclose if I currently own a stock I mention and/or may buy/short it within the next 72 hours.
"Technical Analysis is a windsock, not a crystal ball." - Carl Swenlin
(c) Copyright 2024 DecisionPoint.com
Watch the latest episode of DecisionPoint Trading Room with Carl & Erin Swenlin Mondays on the DecisionPoint YouTube channel here!
NOTE: The stocks reported herein are from mechanical trading model scans that are based upon moving average relationships, momentum and volume. DecisionPoint analysis is then applied to get five selections from the scans. The selections given should prompt readers to do a chart review using their own analysis process. This letter is not a call for a specific action to buy, sell or short any of the stocks provided. There are NO sure things or guaranteed returns on the daily selection of "Diamonds in the Rough."
Regarding BUY/SELL Signals: The signal status reported herein is based upon mechanical trading model signals and crossovers. They define the implied bias of the price index/stock based upon moving average relationships and momentum, but they do not necessarily call for a specific action. They are information flags that should prompt chart review. Further, they do not call for continuous buying or selling during the life of the signal. For example, a BUY signal will probably (but not necessarily) return the best results if action is taken soon after the signal is generated. Additional opportunities for buying may be found as price zigzags higher, but the trader must look for optimum entry points. Conversely, exit points to preserve gains (or minimize losses) may be evident before the model mechanically closes the signal.
Helpful DecisionPoint Links:
Price Momentum Oscillator (PMO)
Swenlin Trading Oscillators (STO-B and STO-V)
For more links, go to DecisionPoint.com