
The market finished the week with a bang after starting with a lurch downward. This was great for the majority of the "Diamonds in the Rough", but definitely didn't do much for the shorting opportunities we took on Wednesday. I still believe those hedges will serve you well, but they will likely frustrate going into next week. Remember they are to protect your current holdings if/when the market slides not necessarily an 'investment'.
Carl and I are still not happy with the market internals so continue to raise or tighten stops to protect yourself. Next week the Fed will have the stage and anything can happen with that.
This week's "Darling" was Edgewise Therapeutics (EWTX). It did what Biotechs often do, it rallied over 6% in one day. Just remember they can easily do the same to the downside. These trades can be tricky. The "Dud" was the Ultrashort of the Dow 30 (SDOW). I still really like this one as a hedge, but it is about near its stop level. We'll reevaluate it.
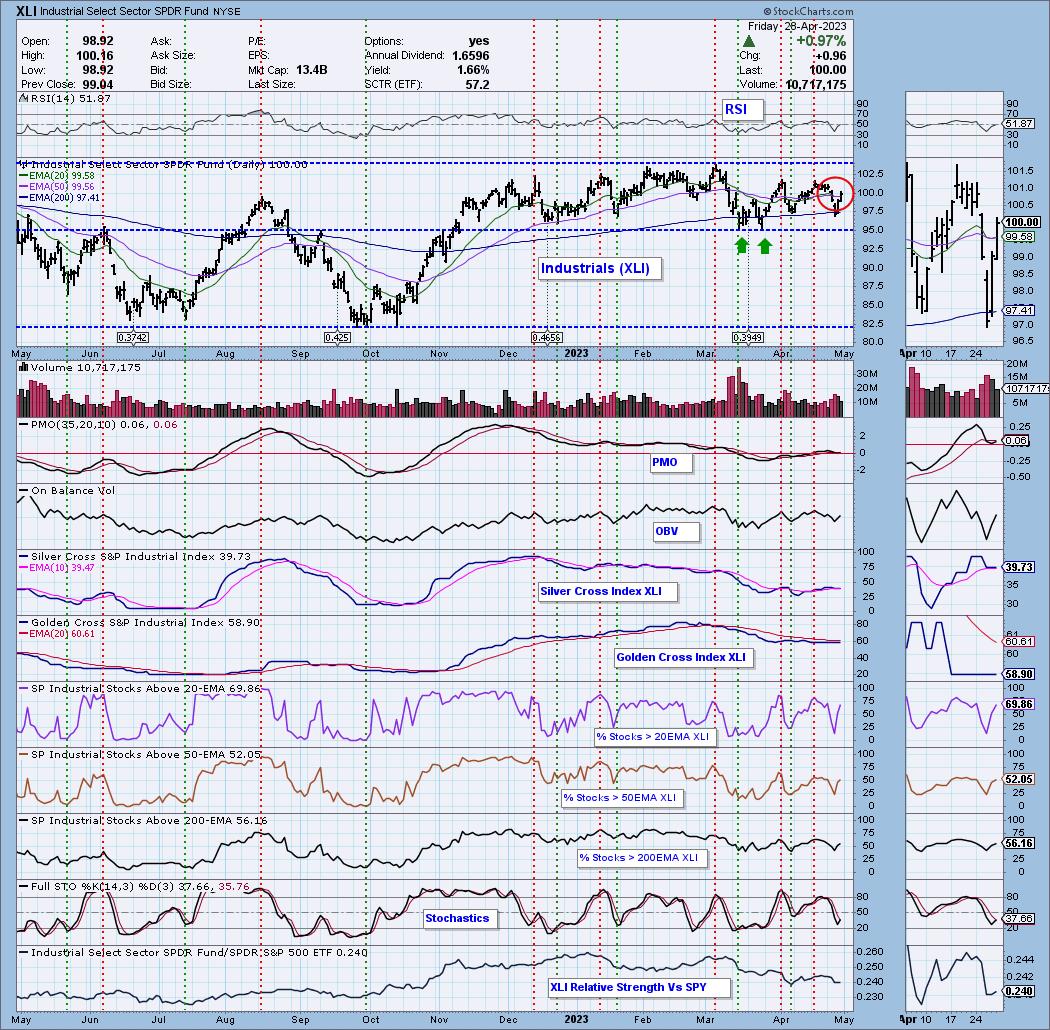
The Sector to Watch was easy to pick this week, Industrials (XLI). Not only do the internals look fairly good, it had a Silver Cross of its 20/50-day EMAs. Of course, if the market declines as I believe it will, we need to be ready to pivot into cash.
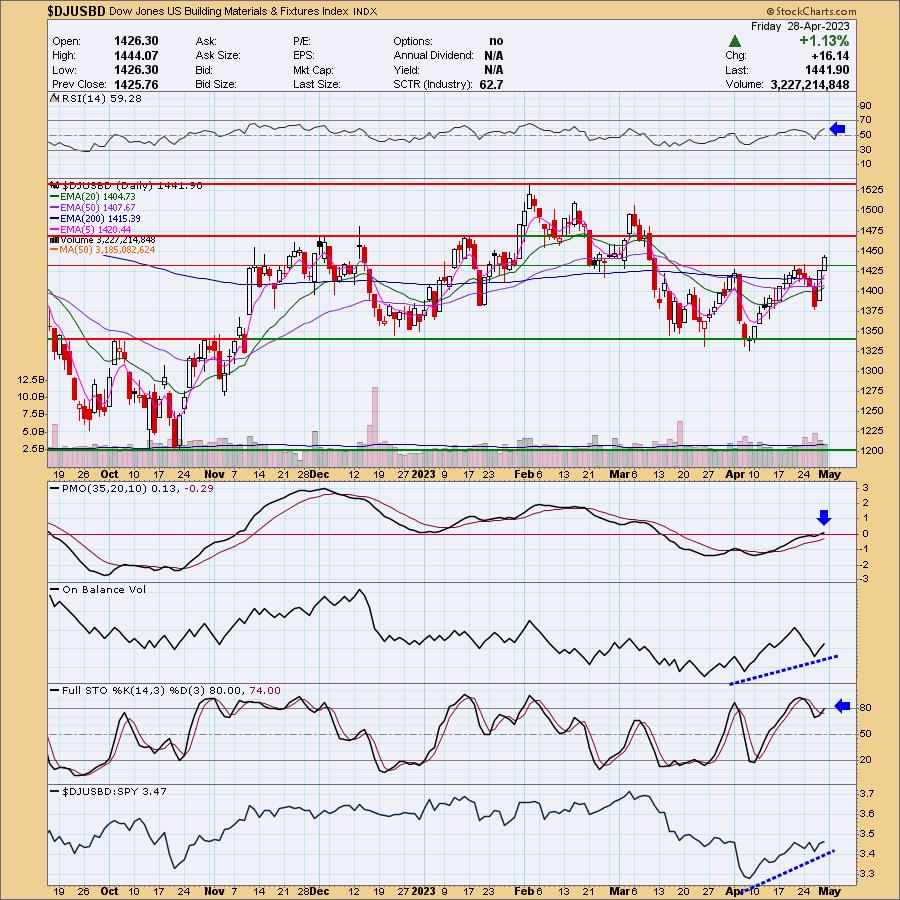
The Industry Group to Watch is Building Materials. We found some great looking stocks in this group that I'll share in the write-up.
Have a great weekend!
Good Luck & Good Trading,
Erin

RECORDING LINK (4/28/2023):
Topic: DecisionPoint Diamond Mine (4/28/2023) LIVE Trading Room
Passcode: April#28
REGISTRATION for 5/5/2023:
When: May 5, 2023 09:00 AM Pacific Time (US and Canada)
Topic: DecisionPoint Diamond Mine (5/5/2023) LIVE Trading Room
Register in advance for this webinar HERE
After registering, you will receive a confirmation email containing information about joining the webinar.

Our latest DecisionPoint Trading Room recording (4/24/2023):
A few items about the spreadsheet: I've put on the spreadsheet whether the RSI is positive (green) or negative (red). The PMO column tells you if it is rising (green) or falling (red). Finally I've added my own "Sparkle Factor" that gives you my assessment going forward, bullish (green), bearish (red) or neutral (gray). The Sparkle Factor is basically my thoughts on whether I expect it to rise or fall. A neutral means it could really go either way so it could be added to a watch list. If you're in a stock I consider "neutral" going forward, the ball is in your court.
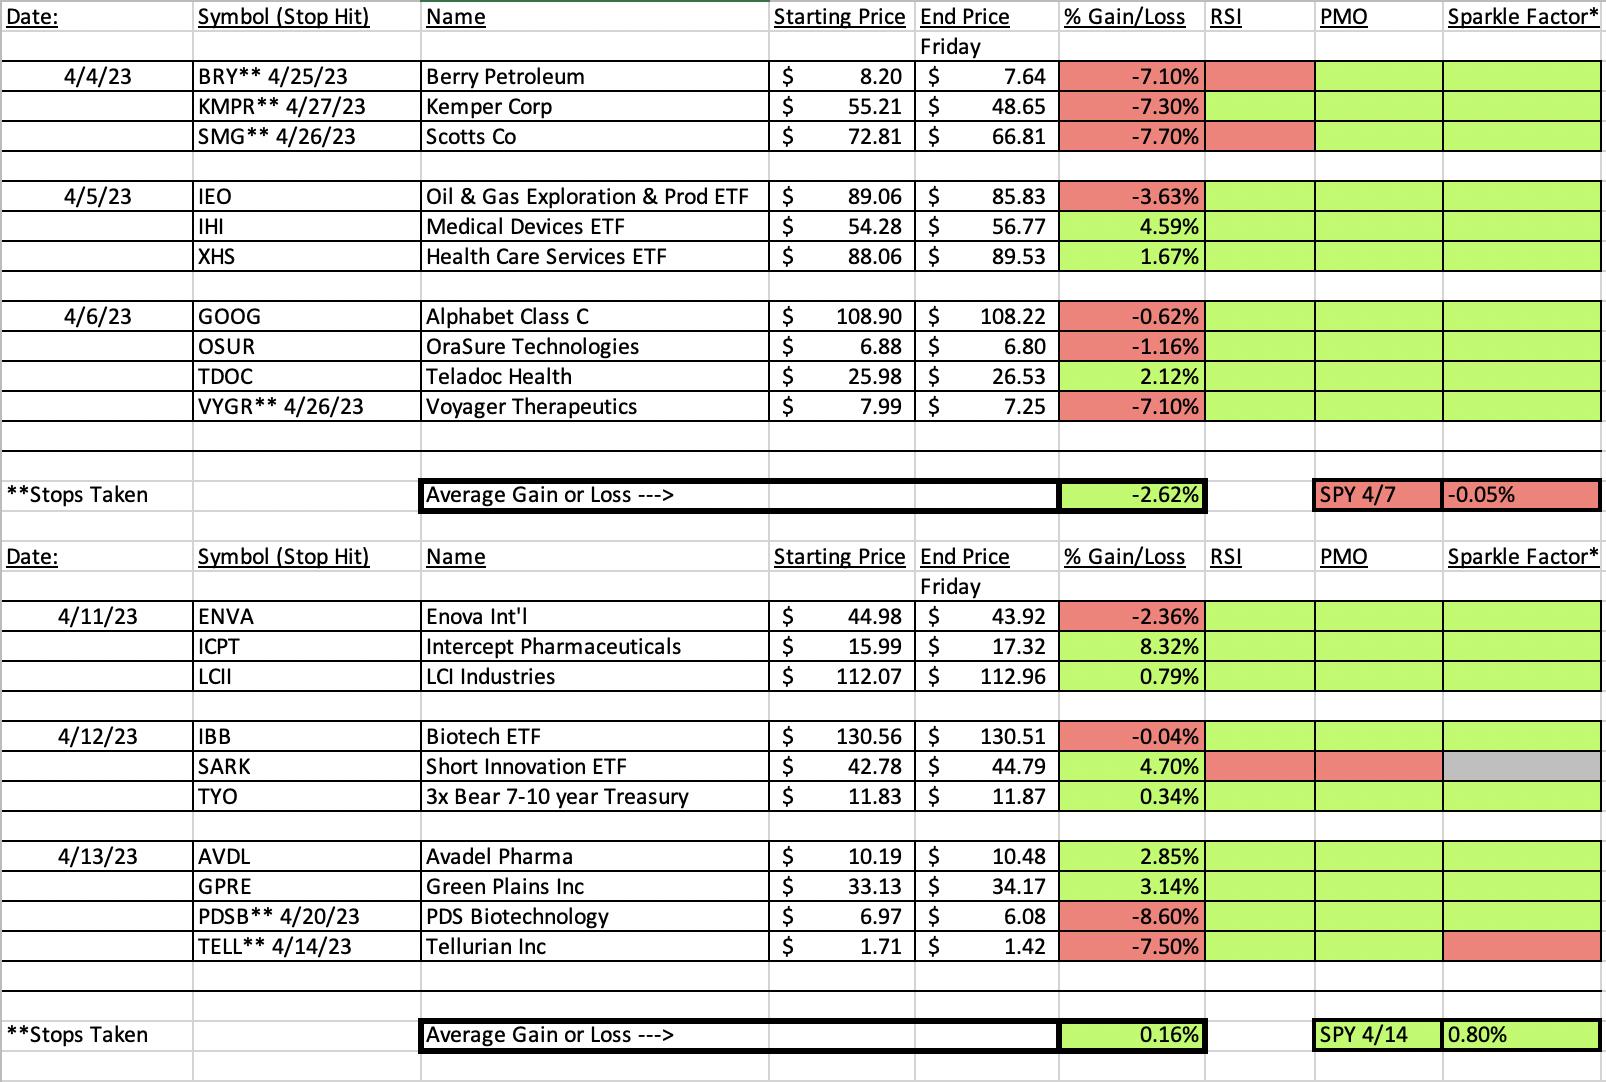
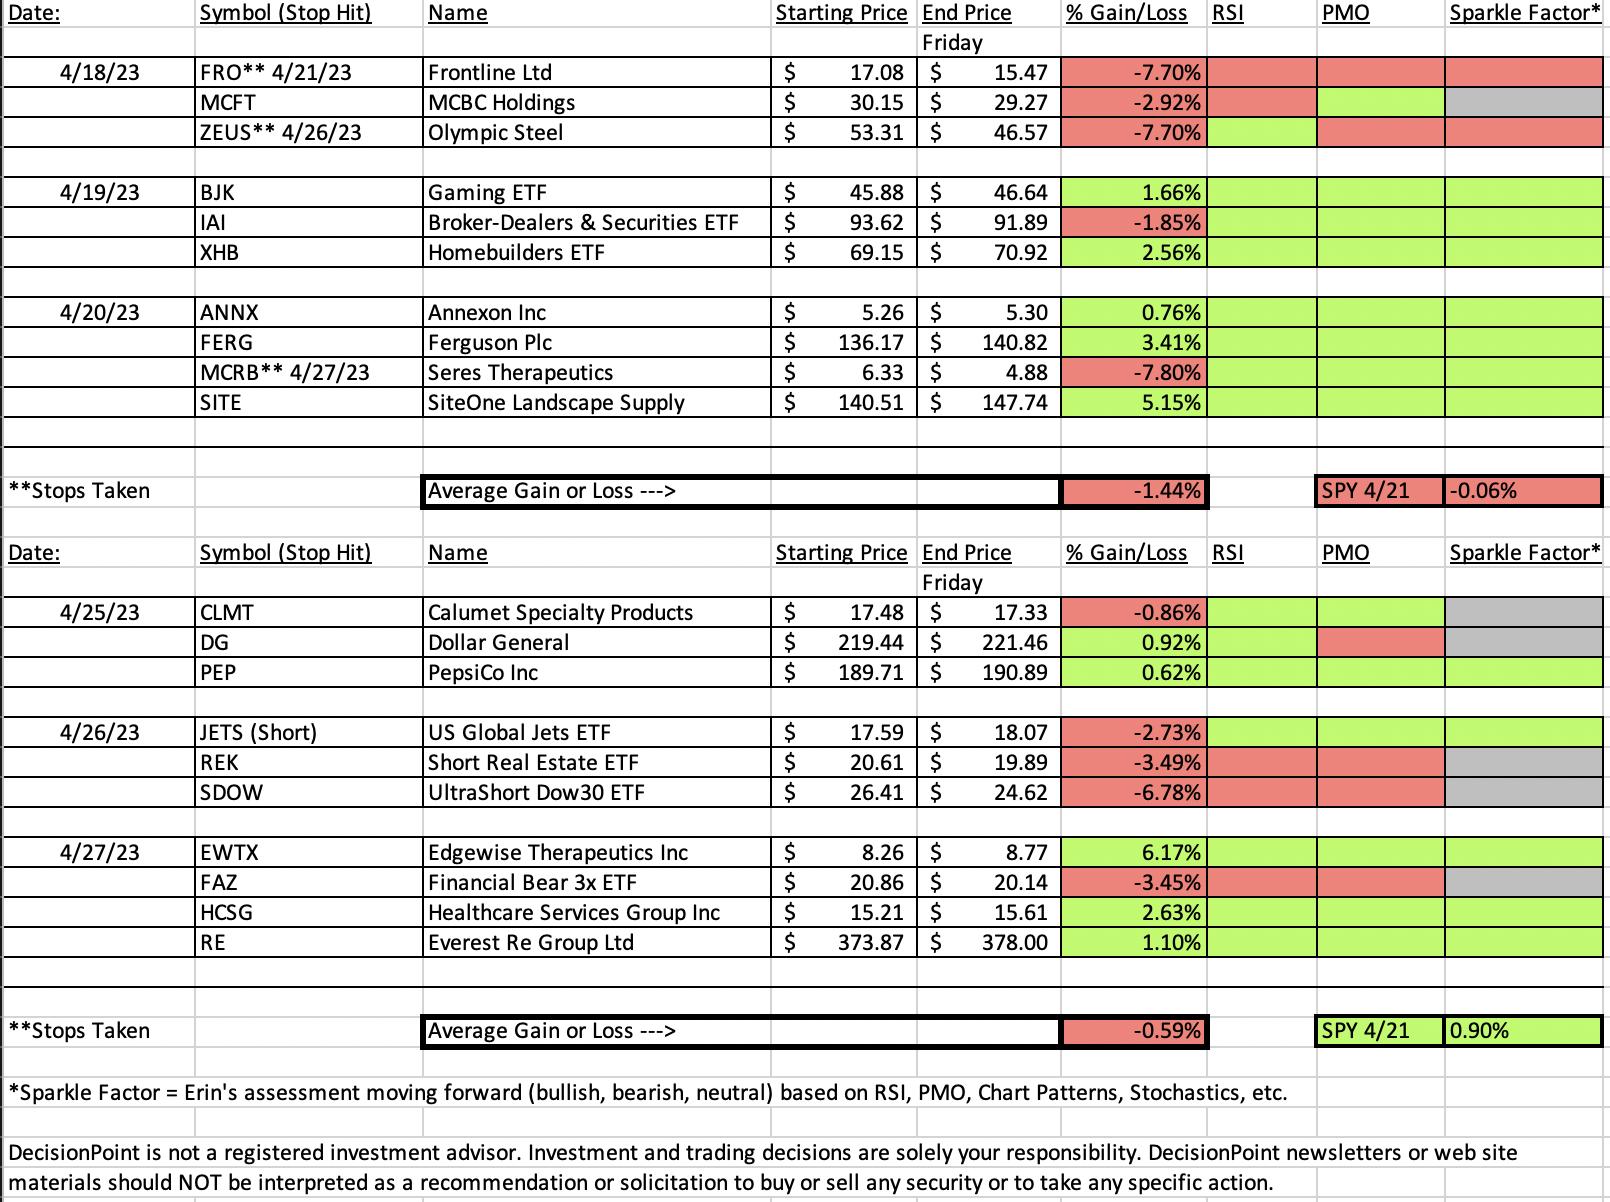
Darling:
Edgewise Therapeutics Inc. (EWTX)
EARNINGS: 05/10/2023 (BMO)
Edgewise Therapeutics, Inc. is a clinical-stage biopharmaceutical company. It focuses on the discovery, development and commercialization of innovative treatments for severe, rare muscle disorders for which there is significant unmet medical need. Its platform utilizes custom-built throughput and translatable systems that measure integrated muscle function in whole organ extracts to identify small molecule precision medicines regulating key proteins in muscle tissue, initially focused on addressing rare neuromuscular and cardiac diseases. The company was founded by Badreddin Edris, Alan Russel and Peter A. Thompson in 2017 and is headquartered in Boulder, CO.
Predefined Scans Triggered: None.
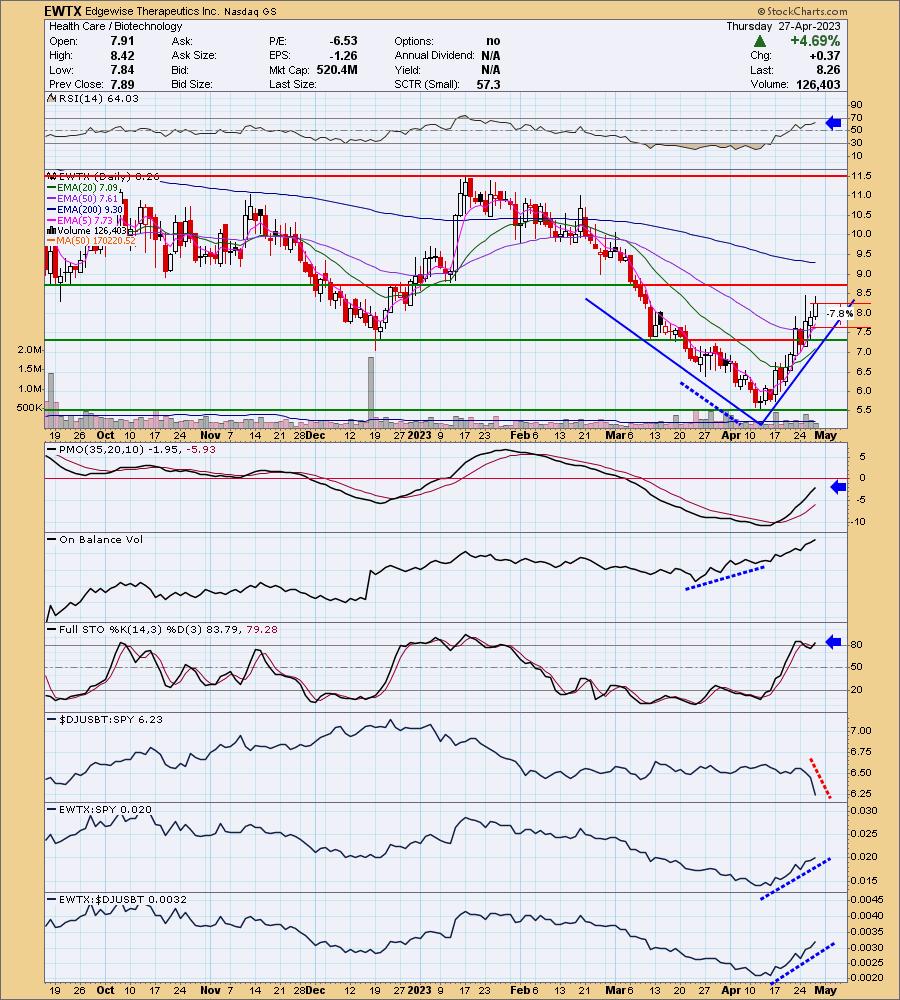
Below are the commentary and chart from Tuesday (4/24):
"EWTX is down -2.06% in trading so the strong rally is about to pause if this carries through tomorrow. Better entry. We have a bullish "V" bottom chart pattern. These patterns suggest a rally that would take price past the beginning of the "V". That would mean a move to at least test $11.50. The indicators are very strong with the RSI positive and not overbought, the PMO rising strongly on an oversold BUY Signal and Stochastics above 80. You'll notice that leading into this rally there was a strong positive OBV divergence. It fulfilled as expected with a strong rally. The group is really falling off the map, but the Biotechs are not very homogenous so I don't mind picking a strong chart from this group. This is a strong chart given relative strength against the group is strong as well as against the SPY. The stop is set below the 50-day EMA at 7.8% or $7.61."
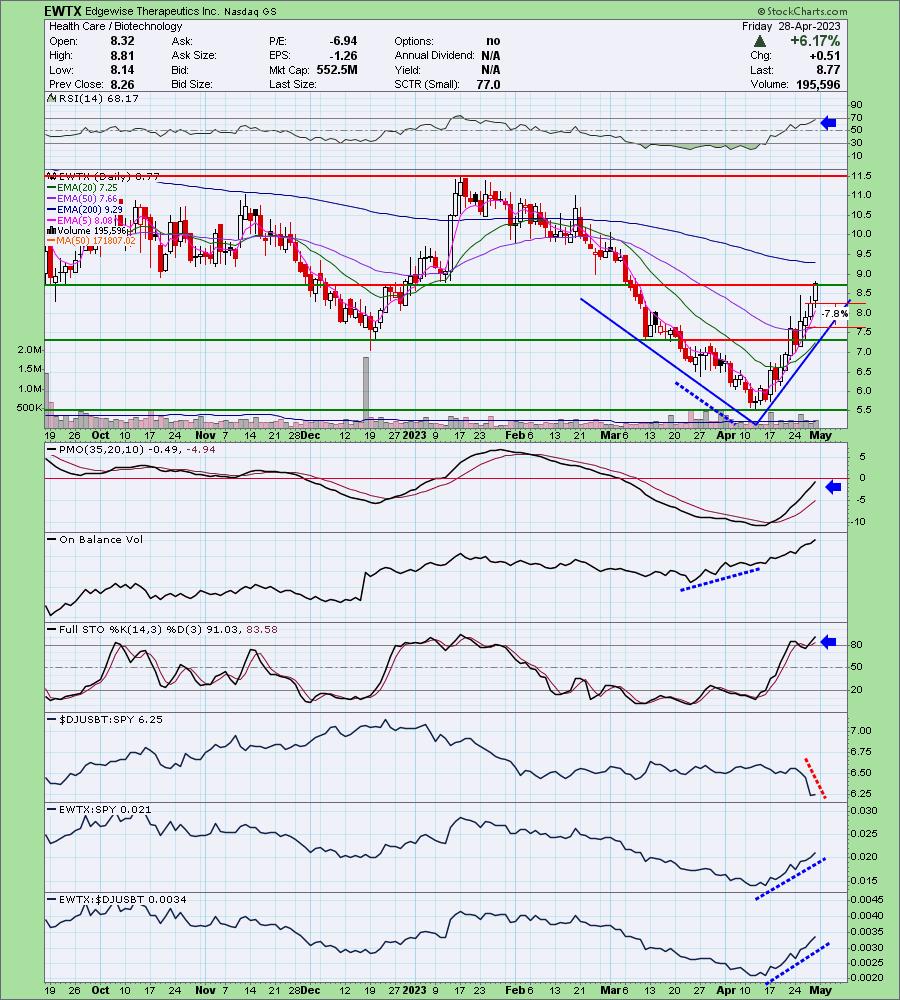
Here is today's chart:
The "V" bottom pattern continues to work its magic. Today price began breaking out above overhead resistance. The chart continues to mature as expected given the positive indicators. I was glad that the failing Biotech industry group didn't hurt this pick.
Don't forget, on Thursdays I look at reader-requested symbols, so shoot me an email at erin@decisionpoint.com. I read every email I receive and try to answer them all!
Dud:
ProShares UltraPro Short Dow30 (SDOW)
EARNINGS: N/A
SDOW provides 3x inverse exposure to the price-weighted Dow Jones Industrial Average, which includes 30 of the largest US companies. Click HERE for more information.
Predefined Scans Triggered: P&F High Pole.
Below are the commentary and chart from Wednesday (4/25):
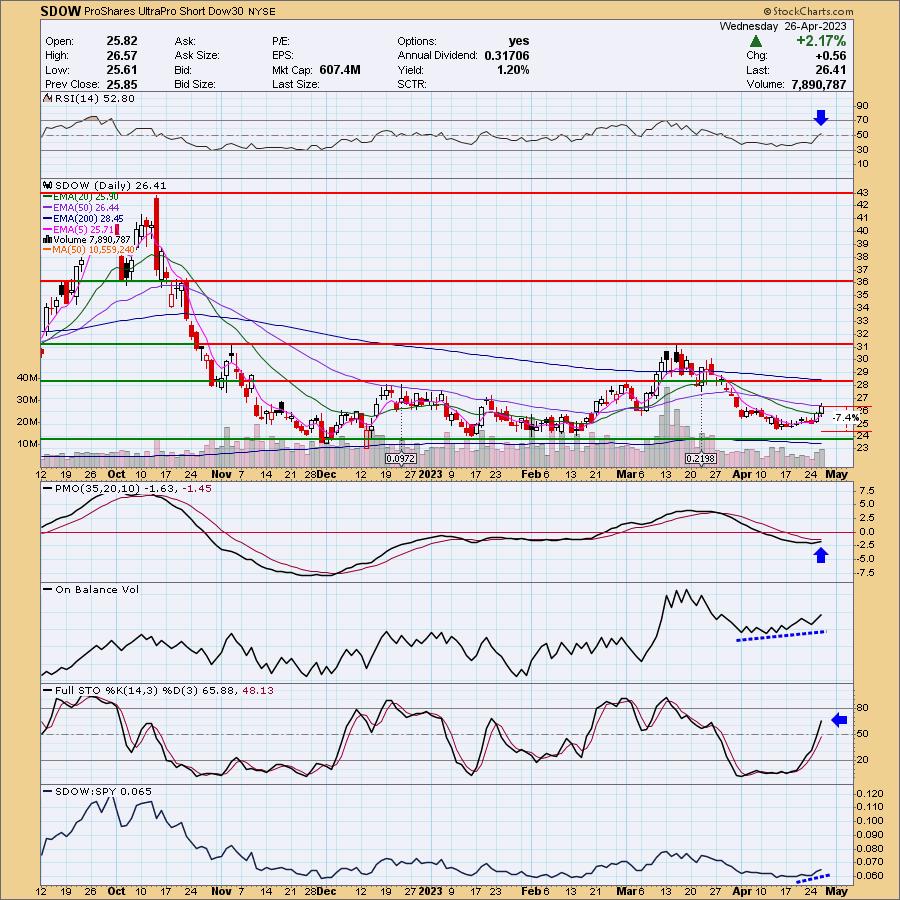
"SDOW is down -0.15% in after hours trading. As the market breaks down, this chart is shaping up. I believe the Dow looks even more vulnerable than the SPX so an inverse on the Dow made the most sense. We have a nice rounded bottom price pattern. The RSI just entered positive territory. The PMO has now turned back up. The OBV is confirming the rally. Stochastics are moving quickly higher and should get above 80 shortly. Relative strength is picking up for obvious reasons and should continue to rise. The stop is set below support at 7.4% or $24.45."
Here is today's chart:
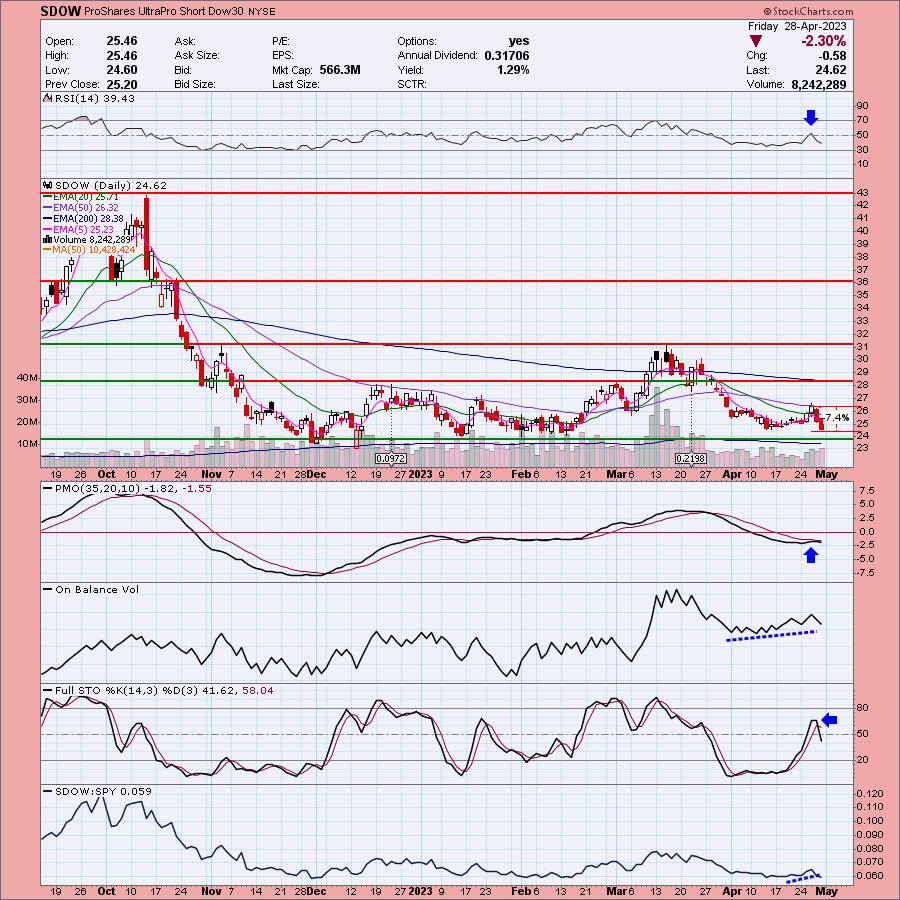
Two days of strong rally did this ETF wrong. It plummeted given it is a 2x inverse. I see this as a good hedge and may go ahead and add it for more short coverage, but I'll reevaluate when we see how the market opens Monday. That PMO top beneath the signal line is ugly.
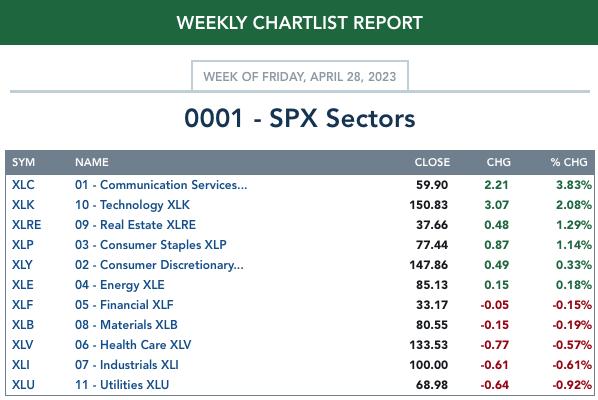
THIS WEEK's Sector Performance:
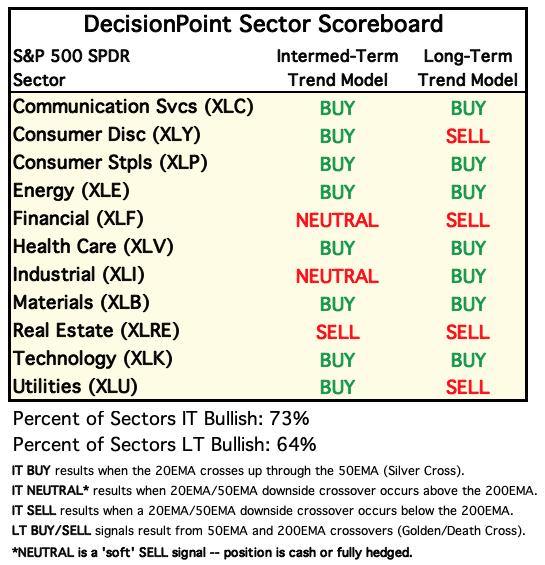
DecisionPoint Sector Scoreboard (Mechanical Trend Model Signals):
Click Here to view Carl's annotated Under the Hood ChartList!
Sector to Watch: Industrials (XLI)
As noted in the opening, XLI had a Silver Cross and that triggered an IT Trend Model "Silver Cross" BUY Signal. I will admit that Industrials have been very rangebound and under most circumstances I wouldn't favor that. However, if the market doesn't fail, participation is strong enough for Industrials that we should see some a move to the top of the range. Overall, I am not proposing you expand your portfolio, but if you're going to fish, this could be a good group to look at.
Industry Group to Watch: Building Materials & Fixtures ($DJUSBD)
This chart looks very much like the XLI chart above. I like today's breakout and indicators are positive. The RSI is above net neutral and rising. The PMO just pushed above the zero line and Stochastics are reacting as we want. Relative strength is building as well. Unfortunately I didn't find an ETF that mimics this group, but we did find four stocks of interest in this morning's Diamond Mine trading room: BLD and OC looked best with AZEK and CX as strong runner-ups.
Go to our Sector ChartList on DecisionPoint.com to get an in-depth view of all the sectors. On StockCharts.com you can find the Industry Summary.
Good Luck & Good Trading!
- Erin
erin@decisionpoint.com
Full Disclosure: I'm 30% long, 4% short.
Watch the latest episode of the DecisionPoint Trading Room with Carl & Erin Swenlin on Mondays 3:00p EST!
Technical Analysis is a windsock, not a crystal ball. --Carl Swenlin
NOTE: The stocks reported herein are from mechanical trading model scans that are based upon moving average relationships, momentum and volume. DecisionPoint analysis is then applied to get selections from the scans. The selections given should prompt readers to do a chart review using their own analysis process. This letter is not a call for a specific action to buy, sell or short any of the stocks provided. There are NO sure things or guaranteed returns on the selection of "diamonds in the rough."
Helpful DecisionPoint Links:
DecisionPoint Shared ChartList and DecisionPoint Chart Gallery
Price Momentum Oscillator (PMO)
Swenlin Trading Oscillators (STO-B and STO-V)
(c) Copyright 2023 DecisionPoint.com