
The market surprised us a bit today. We had a downside exhaustion climax yesterday so we expected a pause or small rally. Instead we got a very strong rally that had our short-term Swenlin Trading Oscillators turning up. This could mean we have a few more days of upside before we resume the decline. Your hedges should serve you well, although they may see a decline into next week. I feel it is worth holding mine.
Reader Requests were all quite good, but I'm testing out my new PMO Surge Scan and had to check on the results. I found a slew of positive charts within those results that I've included in a separate list below.
I made an appearance on The Final Bar today with my old friend, Tom Bowley who was filling in for Dave Keller. He's a notorious bull and apparently DecisionPoint is known as a bear. We had an excellent discussion and one thing he and I did agree on was that it will be important to see who leads any rally ahead. If it is the aggressive groups, we will need to pivot our position. If it is the defensive groups, we will continue to be very bearish on the market. Today it was the aggressive groups. We will know more tomorrow. If you want to watch it, it should be up on the StockChartsTV YouTube channel.
Good Luck & Good Trading,
Erin
Today's "Diamonds in the Rough": EWTX, FAZ, HCSG and RE.
Other Requests: DRV, HIBS, WING, EME, PNR and FRPT.
Surge Scan Results (Sifted): CASY, ATRC, EVC, VIV, DRVN, MSGS, ORLY, CBZ and VRTX.
** JULY VACATION **
I will be in Europe 7/14 - 7/27 so there will not be any Diamonds reports or trading rooms during that time. All subscribers with active subscriptions on 7/27 will be compensated with two weeks added to their renewal date.

RECORDING LINK (4/21/2023):
Topic: DecisionPoint Diamond Mine (4/21/2023) LIVE Trading Room
Passcode: April#21
REGISTRATION for 4/28/2023:
When: Apr 28, 2023 09:00 AM Pacific Time (US and Canada)
Topic: DecisionPoint Diamond Mine (4/28/2023) LIVE Trading Room
Register in advance for this webinar HERE
After registering, you will receive a confirmation email containing information about joining the webinar.

Here is the last recording (4/24):
Welcome to DecisionPoint Diamonds, wherein I highlight ten "Diamonds in the Rough" per week. These are selected from the results of my DecisionPoint Scans which search for stocks that could benefit from the trend and condition of the market. Remember, these are not recommendations to buy or sell, but are the most interesting of the stocks that surfaced in my scans. My objective is to save you the work of the initial, tedious culling process, but you need to apply your own analysis to see if these stocks pique your interest as well. There are no guaranteed winners here!
"Predefined Scans Triggered" are taken from StockCharts.com using the "Symbol Summary" option instead of a "SharpChart" on the workbench.
Stop levels are all rounded down.
Edgewise Therapeutics Inc. (EWTX)
EARNINGS: 05/10/2023 (BMO)
Edgewise Therapeutics, Inc. is a clinical-stage biopharmaceutical company. It focuses on the discovery, development and commercialization of innovative treatments for severe, rare muscle disorders for which there is significant unmet medical need. Its platform utilizes custom-built throughput and translatable systems that measure integrated muscle function in whole organ extracts to identify small molecule precision medicines regulating key proteins in muscle tissue, initially focused on addressing rare neuromuscular and cardiac diseases. The company was founded by Badreddin Edris, Alan Russel and Peter A. Thompson in 2017 and is headquartered in Boulder, CO.
Predefined Scans Triggered: None.
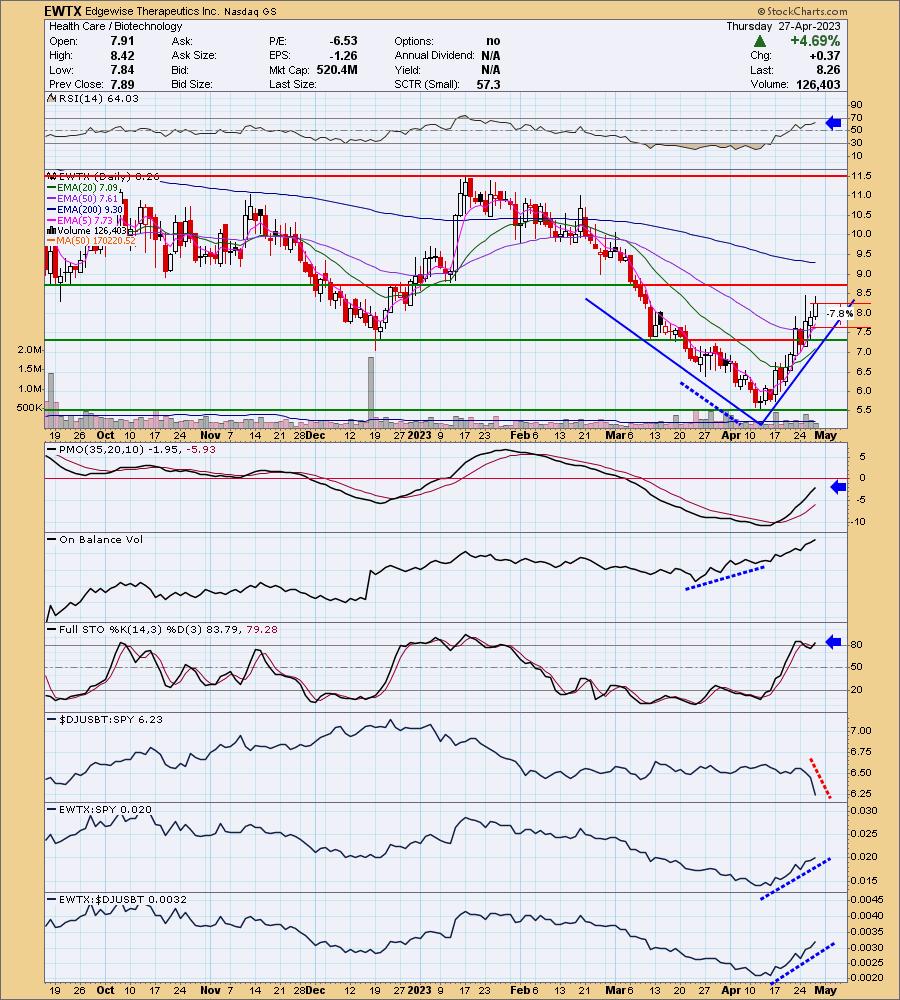
EWTX is down -2.06% in trading so the strong rally is about to pause if this carries through tomorrow. Better entry. We have a bullish "V" bottom chart pattern. These patterns suggest a rally that would take price past the beginning of the "V". That would mean a move to at least test $11.50. The indicators are very strong with the RSI positive and not overbought, the PMO rising strongly on an oversold BUY Signal and Stochastics above 80. You'll notice that leading into this rally there was a strong positive OBV divergence. It fulfilled as expected with a strong rally. The group is really falling off the map, but the Biotechs are not very homogenous so I don't mind picking a strong chart from this group. This is a strong chart given relative strength against the group is strong as well as against the SPY. The stop is set below the 50-day EMA at 7.8% or $7.61.
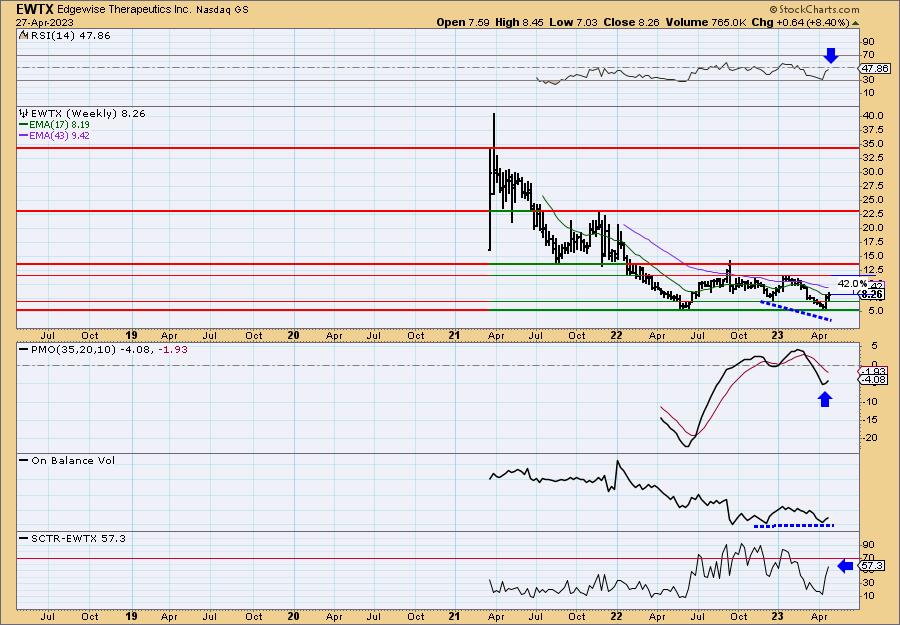
The weekly chart is improving quickly on this rally. The weekly RSI is nearing positive territory. The weekly PMO is now rising again. There is also a positive OBV divergence in the intermediate term. The SCTR is not in the "hot zone"* above 70, but it is rising strongly enough that I consider it bullish. Upside potential if it reaches that "V" bottom target would be about 42%.
*We call it the "hot zone" because it implies that the stock/ETF is in the top 30% of its "universe" (large-, mid-, small-caps and ETFs) as far as trend and condition, particularly in the intermediate and long terms.
Direxion Daily Financial Bear 3x Shares (FAZ)
EARNINGS: N/A
FAZ provides 3x inverse exposure to a market cap-weighted index of US large-cap financial companies. Click HERE for more information.
Predefined Scans Triggered: Elder Bar Turned Blue and Entered Ichimoku Cloud.
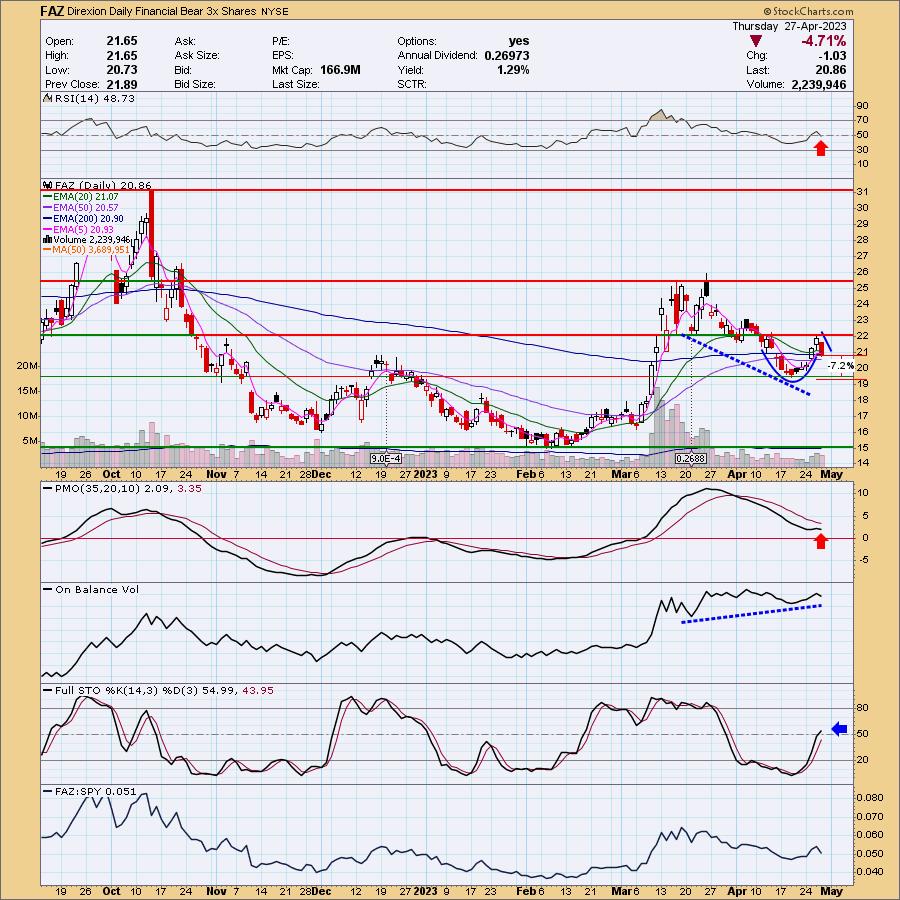
FAZ is up +0.19% in after hours trading. The Financial Sector is wobbly, but Banks in particular are the big problem. The crisis is not over for First Regional Bank and I believe they are one of many out there struggling to stay afloat; others just haven't made the news yet. I may switch to this ETF from my simple short ETF on Financials. Leveraging this sector isn't a bad idea. If the market falls quickly again, Financials will likely take the brunt of the damage. So, this chart doesn't look that appetizing, but the story behind it makes it compelling. I see a small cup with handle pattern that is bullish, but admittedly there are problems technically. The RSI moved into negative territory and the PMO topped beneath the signal line. Both are bearish. However, there is a strong positive OBV divergence and Stochastics are still rising. I believe today was a hiccup. The stop is set at 7.2% below support around $19.35.
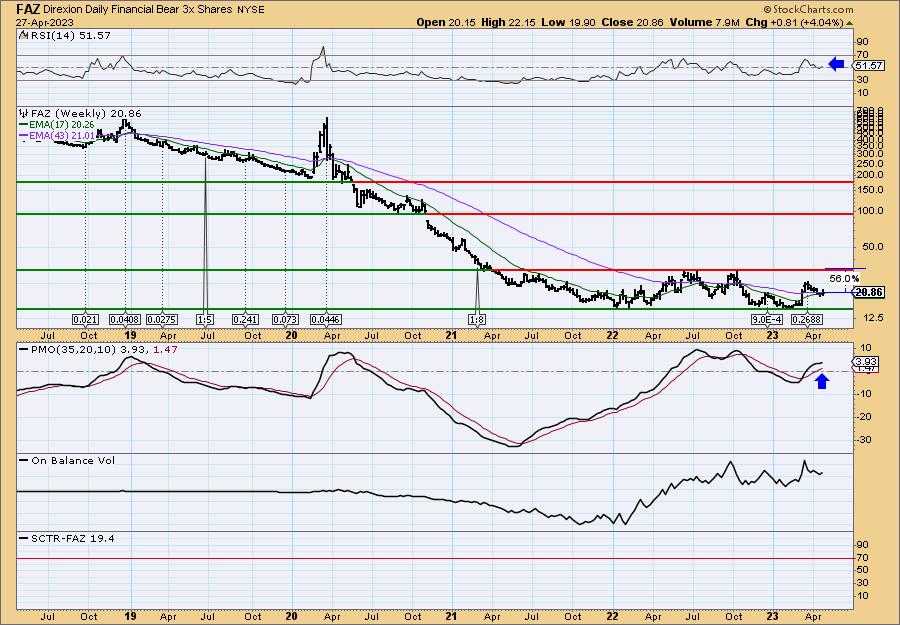
The weekly chart is log scale so we can see price action. It has been in a trading range for over a year. It is bottoming before testing the bottom of the range, that does suggest a move will take price back to the top of the range. The weekly RSI is positive and rising and the weekly PMO shows a "surge" above the signal line (PMO bottom above the signal line). I don't know that you'll see a 56% gain on it, but it isn't out of the question given it is a 3x inverse.
Healthcare Services Group, Inc. (HCSG)
EARNINGS: 04/26/2023 (BMO) ** Reported Yesterday **
Healthcare Services Group, Inc. engages in the provision of keeping, laundry, and dietary services to long-term care and related health care facilities. It operates through the following business segments: Housekeeping and Dietary. The Housekeeping segment consists of the management of the client's housekeeping department, which is responsible for the cleaning, disinfecting, and sanitizing of patient rooms and common areas of a client facility, as well as the laundering and processing of the personal clothing belonging to the facility's patients. The Dietary segment includes the management of the client's dietary department, which is responsible for food purchasing, meal preparation, and the provision of dietician consulting professional services. The company was founded by Daniel P. McCartney on November 22, 1976 and is headquartered in Bensalem, PA.
Predefined Scans Triggered: New CCI Buy Signals, P&F Ascending Triple Top Breakout, P&F Double Top Breakout and Shooting Star.
HCSG is unchanged in after hours trading. Obviously investors liked the earnings call yesterday. The rally saw follow-through. I really like this chart, but be prepared for a pause or possible pullback on profit taking. It will offer a better entry likely. The RSI is positive and the PMO practically had a 'surge' above the signal line, instead it was a whipsaw BUY which is also bullish. The OBV is rising to confirm this rally. Stochastics are rising in positive territory and relative strength for the group and HCSG is strongly rising. The stop is set at the 20-day EMA at 6.4% or $14.23.

The weekly chart is very bullish. We have a bullish saucer shaped bottom and a breakout this week. The weekly RSI is positive, rising and not overbought. The weekly PMO just moved above the zero line and the OBV is angling higher. The SCTR is excellent at 88%. Upside potential is about 17%.

Everest Re Group, Ltd. (RE)
EARNINGS: 05/01/2023 (AMC)
Everest Re Group Ltd. is a holding company, which engages in the provision of reinsurance and insurance services. It operates through the following segments: Reinsurance, and Insurance. The Reinsurance segment writes property and casualty reinsurance and specialty lines of business, including marine, aviation, surety, and accident and health business, on both a treaty and facultative basis, through reinsurance brokers, as well as directly with ceding companies primarily within the U.S. The Insurance segment writes property and casualty insurance directly and through brokers, surplus lines brokers, and general agents within the U.S., Canada, and Europe. The company was founded in 1999 and is headquartered in Hamilton, Bermuda.
Predefined Scans Triggered: Elder Bar Turned Green, Parabolic SAR Sell Signals, P&F Double Top Breakout and P&F Triple Top Breakout.
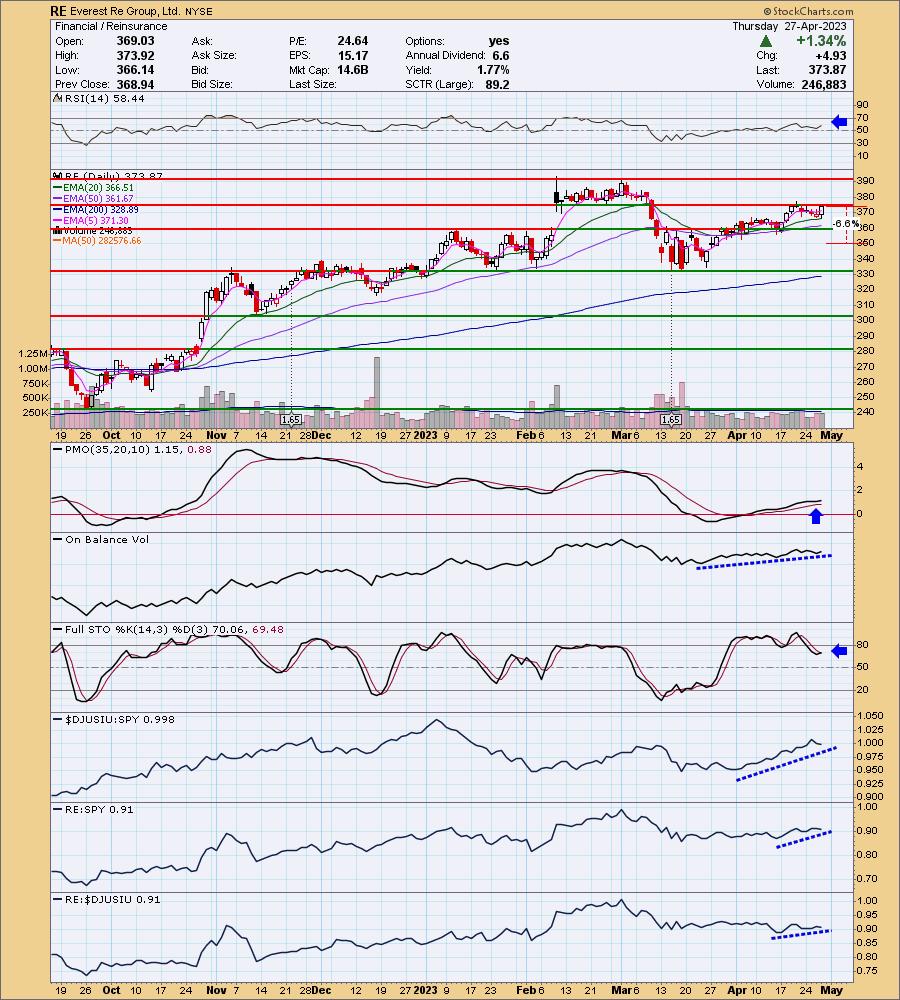
RE is down -0.79% in after hours trading. I hesitated presenting a Financial sector member as I'm also suggesting an inverse ETF on Financials. However, although it could be dragged lower, I don't want to be guilty of throwing the baby out with the bathwater (I do see the sector doing that which makes this a bit more risky). After hitting resistance and pulling back, price moved strongly higher on today's rally. We don't have the breakout yet, but the indicators are favorable. The industry group is doing very well which makes me less concerned about its membership in Financials. The RSI is positive and the PMO has surged above the signal line (bottom above the signal line). The OBV is confirming the rising trend and Stochastics have just turned back up. The stock is performing well against the group and the SPY. The stop can be set thinner than I have it, closer to support, but I decided to put it below the early April lows at 6.6% or $349.19.
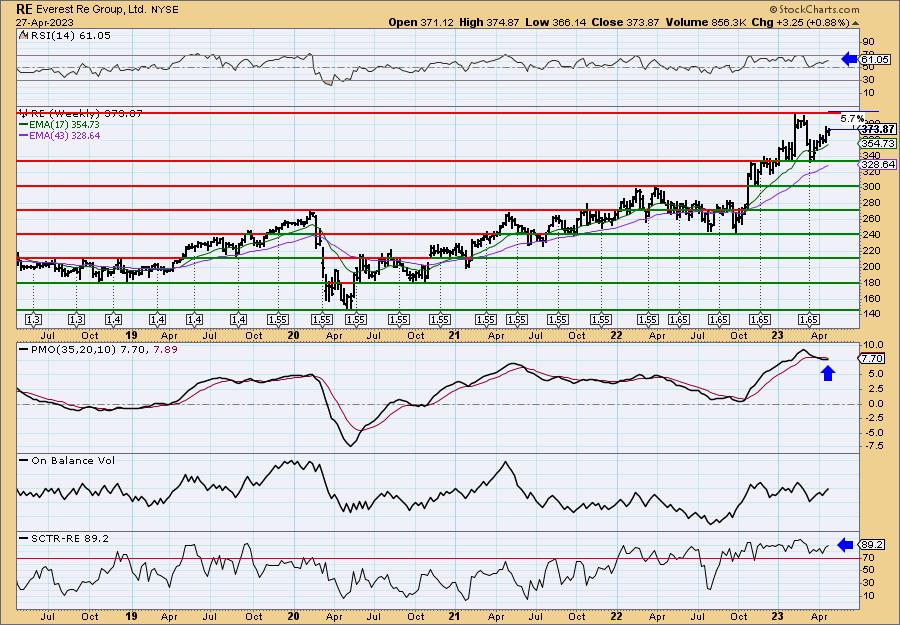
The weekly chart looks bullish given the rising and positive weekly RSI as well as the now rising weekly PMO. The SCTR is excellent at 89%. Upside potential before hitting resistance is just 5.5%, so I would set my upside target higher at 17% or $437.43.
Don't forget, on Thursdays I look at reader-requested symbols, click HERE to send me an email. I read every email I receive and try to answer them all!
Current Market Outlook:
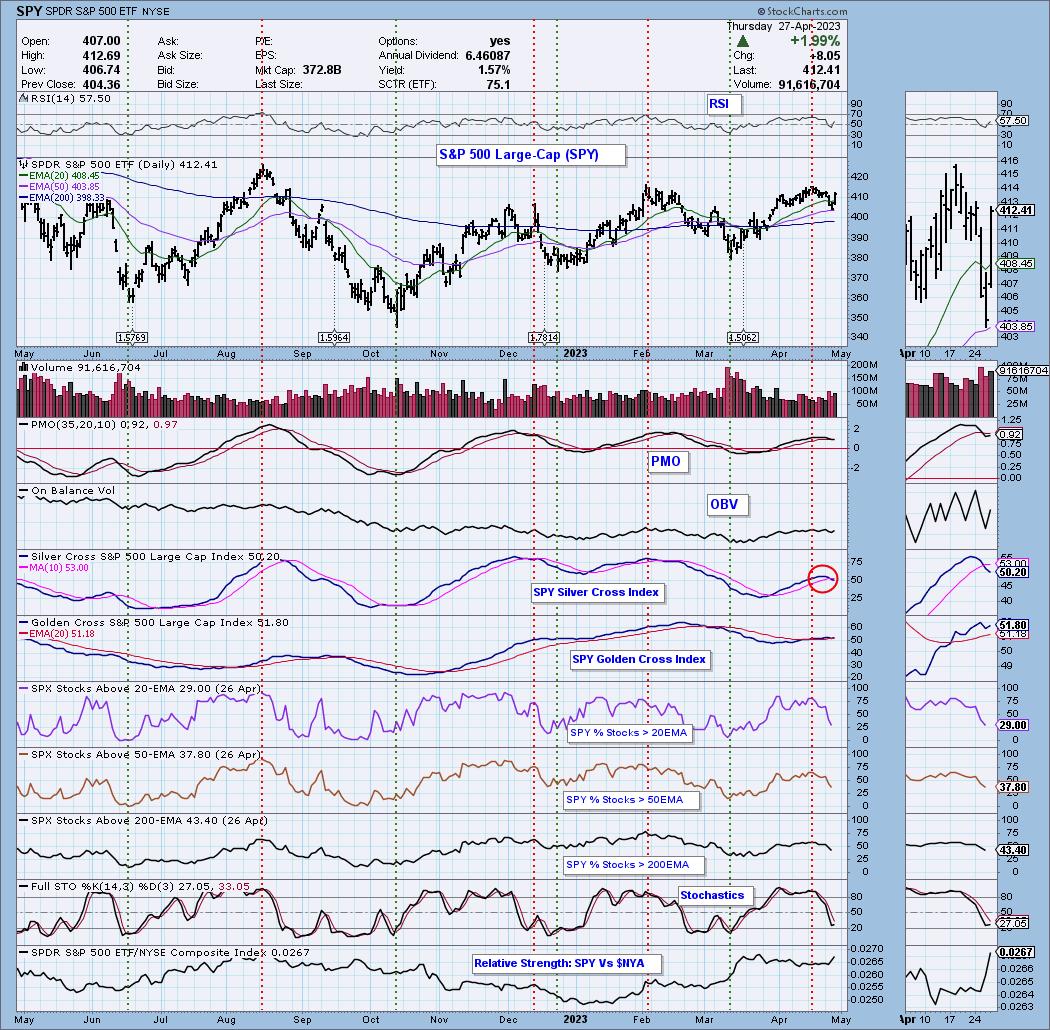
Market Environment: It is important to consider the odds for success by assessing the market tides. The following chart uses different methodologies for objectively showing the depth and trend of participation for intermediate- and long-term time frames.
- The Silver Cross Index (SCI) shows the percentage of SPX stocks on IT Trend Model BUY signals (20-EMA > 50-EMA)
- The Golden Cross Index (GCI) shows the percentage of SPX stocks on LT Trend Model BUY signals (50-EMA > 200-EMA)
Don't forget that as a "Diamonds" member, you have access to our GCI/SCI curated ChartList on DecisionPoint.com. You'll find it under "Members Only" links on the left side on the Blogs and Links Page.
Here is the current chart:
Full Disclosure: I am 30% long, 4% short.
I'm required to disclose if I currently own a stock I mention and/or may buy/short it within the next 72 hours.
"Technical Analysis is a windsock, not a crystal ball." - Carl Swenlin
(c) Copyright 2023 DecisionPoint.com
Watch the latest episode of DecisionPoint Trading Room with Carl & Erin Swenlin on Mondays 7:00p EST or on the DecisionPoint playlist on the StockCharts TV YouTube channel here!
NOTE: The stocks reported herein are from mechanical trading model scans that are based upon moving average relationships, momentum and volume. DecisionPoint analysis is then applied to get five selections from the scans. The selections given should prompt readers to do a chart review using their own analysis process. This letter is not a call for a specific action to buy, sell or short any of the stocks provided. There are NO sure things or guaranteed returns on the daily selection of "Diamonds in the Rough."
Regarding BUY/SELL Signals: The signal status reported herein is based upon mechanical trading model signals and crossovers. They define the implied bias of the price index/stock based upon moving average relationships and momentum, but they do not necessarily call for a specific action. They are information flags that should prompt chart review. Further, they do not call for continuous buying or selling during the life of the signal. For example, a BUY signal will probably (but not necessarily) return the best results if action is taken soon after the signal is generated. Additional opportunities for buying may be found as price zigzags higher, but the trader must look for optimum entry points. Conversely, exit points to preserve gains (or minimize losses) may be evident before the model mechanically closes the signal.
Helpful DecisionPoint Links:
DecisionPoint Shared ChartList and DecisionPoint Chart Gallery
Price Momentum Oscillator (PMO)
Swenlin Trading Oscillators (STO-B and STO-V)
For more links, go to DecisionPoint.com