
Sometimes Reader Request Day is challenging. Today it was not as nearly every symbol requested was "Diamond in the Rough" material. Clearly some are better than others, as you'll see, but I'm pleased with the four I've selected for you.
A reminder, although tomorrow is a market holiday, the Diamond Mine trading room will occur as usual; I may shut it down early though since there won't be any active trading. We'll see. The Recap will go out shortly thereafter.
Good Luck & Good Trading,
Erin
Today's "Diamonds in the Rough": GOOG, OSUR, TDOC and VYGR.
Other requests: UNG, GNW, HSBC, SDGR, AMPH, HCM, KYMR, NTST and PLUS.

RECORDING LINK (3/31/2023):
Topic: DecisionPoint Diamond Mine (3/31/2023) LIVE Trading Room
Passcode: March#31
REGISTRATION for 4/7/2023:
When: Apr 7, 2023 09:00 AM Pacific Time (US and Canada)
Topic: DecisionPoint Diamond Mine (4/7/2023) LIVE Trading Room
Register in advance for this webinar HERE.
After registering, you will receive a confirmation email containing information about joining the webinar.

Here is the last recording (4/3):
Welcome to DecisionPoint Diamonds, wherein I highlight ten "Diamonds in the Rough" per week. These are selected from the results of my DecisionPoint Scans which search for stocks that could benefit from the trend and condition of the market. Remember, these are not recommendations to buy or sell, but are the most interesting of the stocks that surfaced in my scans. My objective is to save you the work of the initial, tedious culling process, but you need to apply your own analysis to see if these stocks pique your interest as well. There are no guaranteed winners here!
"Predefined Scans Triggered" are taken from StockCharts.com using the "Symbol Summary" option instead of a "SharpChart" on the workbench.
Stop levels are all rounded down.
Alphabet Inc. - Class C (GOOG)
EARNINGS: 04/25/2023 (AMC)
Alphabet, Inc. engages in the business of delivering online advertising, cloud-based solutions that provide enterprise customers with infrastructure and platform services, the provision of communication and collaboration tools, and sales of other products and services such as apps and in-app purchases, hardware, and subscription-based products. It operates under the Google Services and Google Cloud segments. The Google Services segment includes ads, Android, Chrome, hardware, Gmail, Google Drive, Google Maps, Google Photos, Google Play, Search, and YouTube. The Google Cloud segment offers Google Cloud Platform and Google Workspace. The company was founded by Lawrence E. Page and Sergey Mikhaylovich Brin on October 2, 2015 and is headquartered in Mountain View, CA.
Predefined Scans Triggered: Elder Bar Turned Green, Improving Chaikin Money Flow, New CCI Buy Signals, Moved Above Upper Keltner Channel, P&F spread Triple Top Breakout, Moved Above Upper Price Channel and P&F Double Top Breakout.
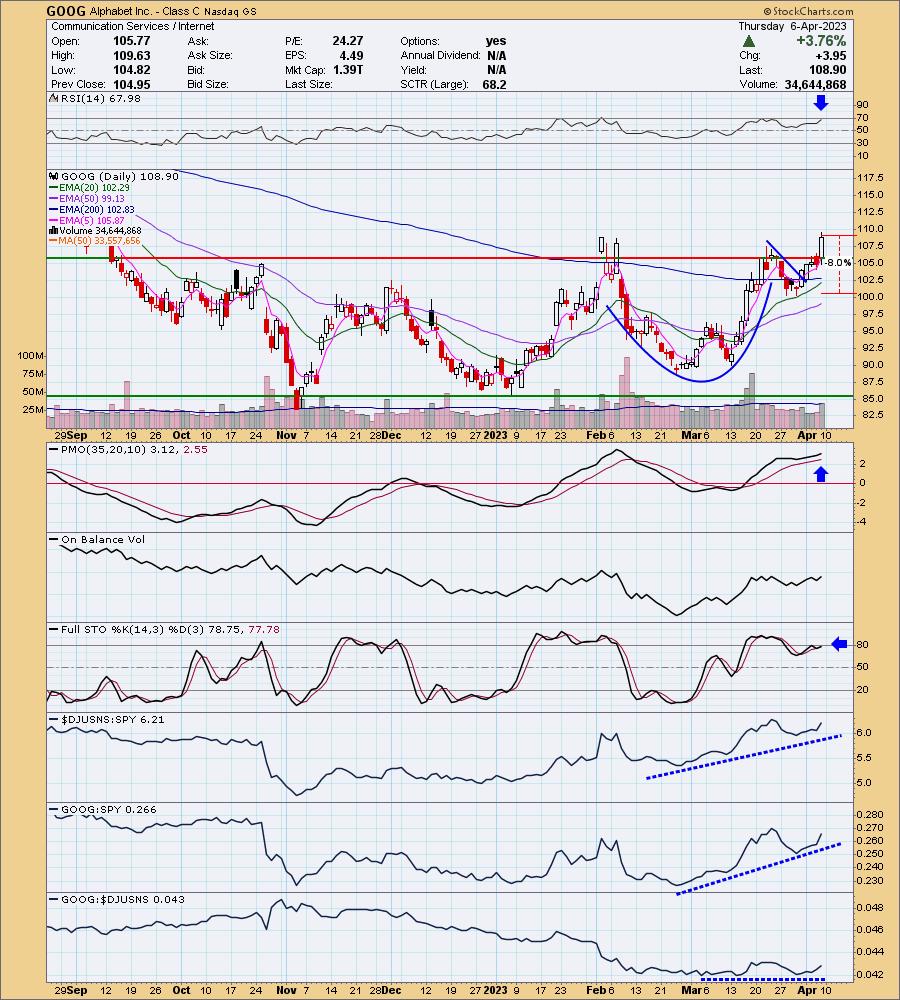
GOOG is down -0.17% in after hours trading. GOOG broke out today, but it didn't quite get above the February high. It looks like it is ready to keep rolling given the bullish cup with handle pattern that was confirmed on the breakout from the 'handle'. The RSI is positive and the PMO is rising on a BUY signal. I would point out that the PMO is overbought, but given we see the bottom range was -4, that means that the upper range should be around +4. It's not as overbought as it might look. Stochastics are just about ready to move above 80. Relative strength against the group is in line; fortunately the group is outperforming so GOOG is outperforming the market. This subscriber wanted to know where to set a stop. I would set it below the closes from the late March low at 8% or $100.18.
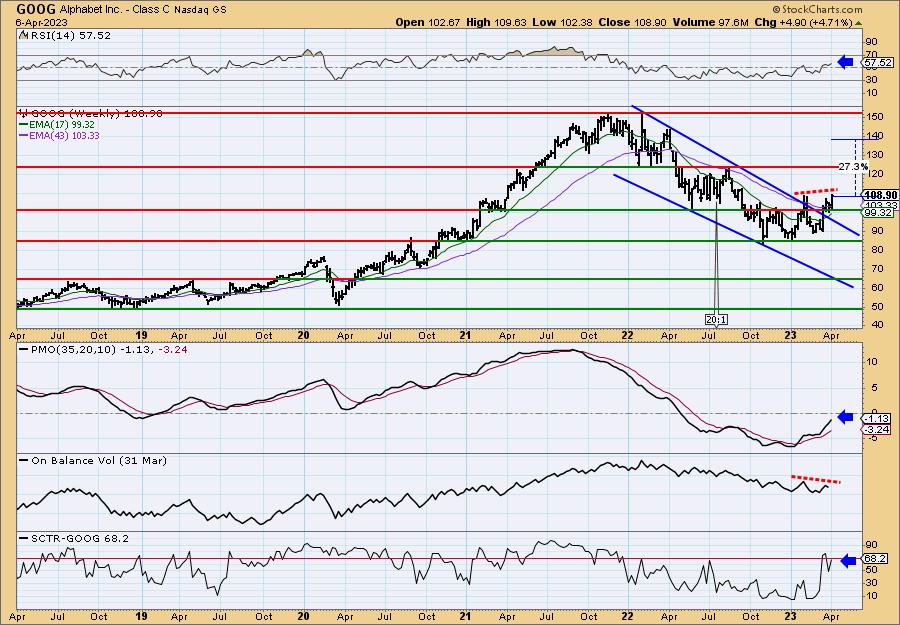
I really like the weekly chart. It suggests this could be considered an intermediate-term investment. The weekly RSI is positive and not overbought. The weekly PMO is rising out of oversold territory. The OBV does show a negative divergence currently, but I'll forgive that. The StockCharts Technical Rank (SCTR) is nearly in the "hot zone"* above 70. I've set my target halfway into the next trading range.
*We call it the "hot zone" because it implies that the stock/ETF is in the top 30% of its "universe" (large-, mid-, small-caps and ETFs) as far as trend and condition, particularly in the intermediate and long terms.
OraSure Technologies, Inc. (OSUR)
EARNINGS: 05/09/2023 (AMC)
OraSure Technologies, Inc. engages in the development, manufacture, and distribution of point of care diagnostic tests and molecular collection devices designed to detect or diagnose critical medical conditions. It operates through the OSUR and DNAG segments. The OSUR segment offer oral fluid diagnostic products and specimen collection devices. The DNAG segment produces specimen collection kits that are used to collect, stabilize, transport, and store samples of genetic material for molecular testing in the consumer genetic, clinical genetic, academic research, pharmacogenomics, personalized medicine, microbiome, and animal genetics markets. The company was founded by Michael J. Gausling in May 2000 in and is headquartered in Bethlehem, PA.
Predefined Scans Triggered: Moved Above Upper Keltner Channel, Moved Above Upper Bollinger Band, Moved Above Upper Price Channel and P&F Double top Breakout.
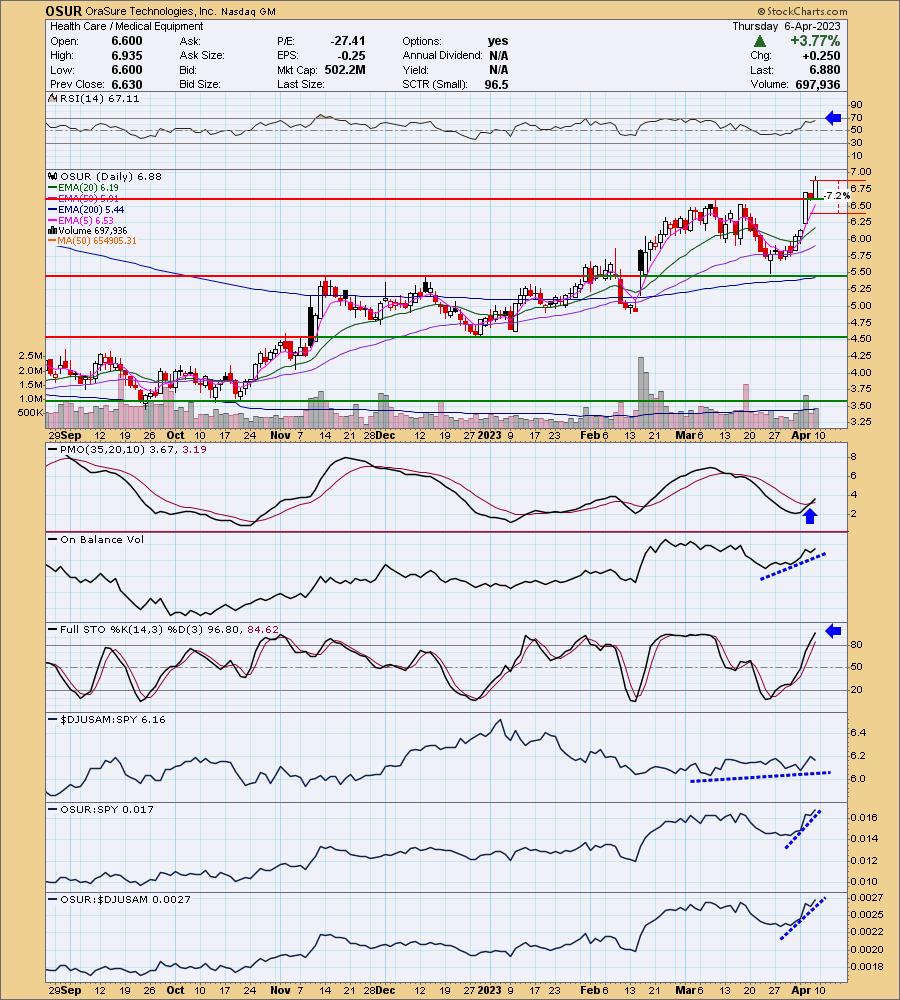
OSUR is down -2.03% in after hours trading. It appears after hours OSUR is taking back much of today's gains. If price does pullback toward current support, it would offer a nice entry. The RSI is positive and not overbought. The PMO just triggered a strong crossover BUY signal. The OBV is confirming the rally, but I would like to see it move above the prior highs to clear a current negative divergence on OBV tops from March to April. Stochastics are above 80 and still rising. Relative strength is good for the group, but is really taking off for OSUR against the group and the SPY. The stop is set well below current support at 7.2% or $6.38.
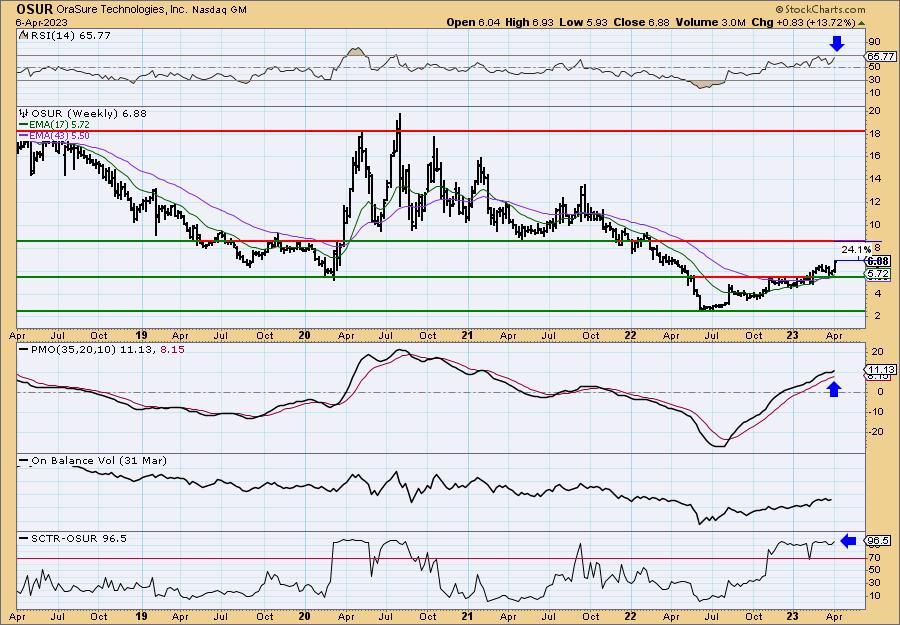
The weekly chart is strong, suggesting this one could also be more of an intermediate-term investment. The weekly RSI is positive and rising. The weekly PMO is accelerating its ascent and is not overbought. The SCTR is at the very top of the "hot zone".
Teladoc Health, Inc. (TDOC)
EARNINGS: 04/26/2023 (AMC)
Teladoc Health, Inc. engages in the provision of telehealthcare services using a technology platform via mobile devices, the Internet, video and phone. It operates through the following segments: Teladoc Health Integrated Care, BetterHelp, and Others. The Teladoc Health Integrated Care segment offers virtual medical services. The BetterHelp segment includes virtual mental health and other wellness services. The company was founded in June 2002, by George Byron Brooks, Michael Gorton, and Gary Wald and is headquartered in Purchase, NY.
Predefined Scans Triggered: None.
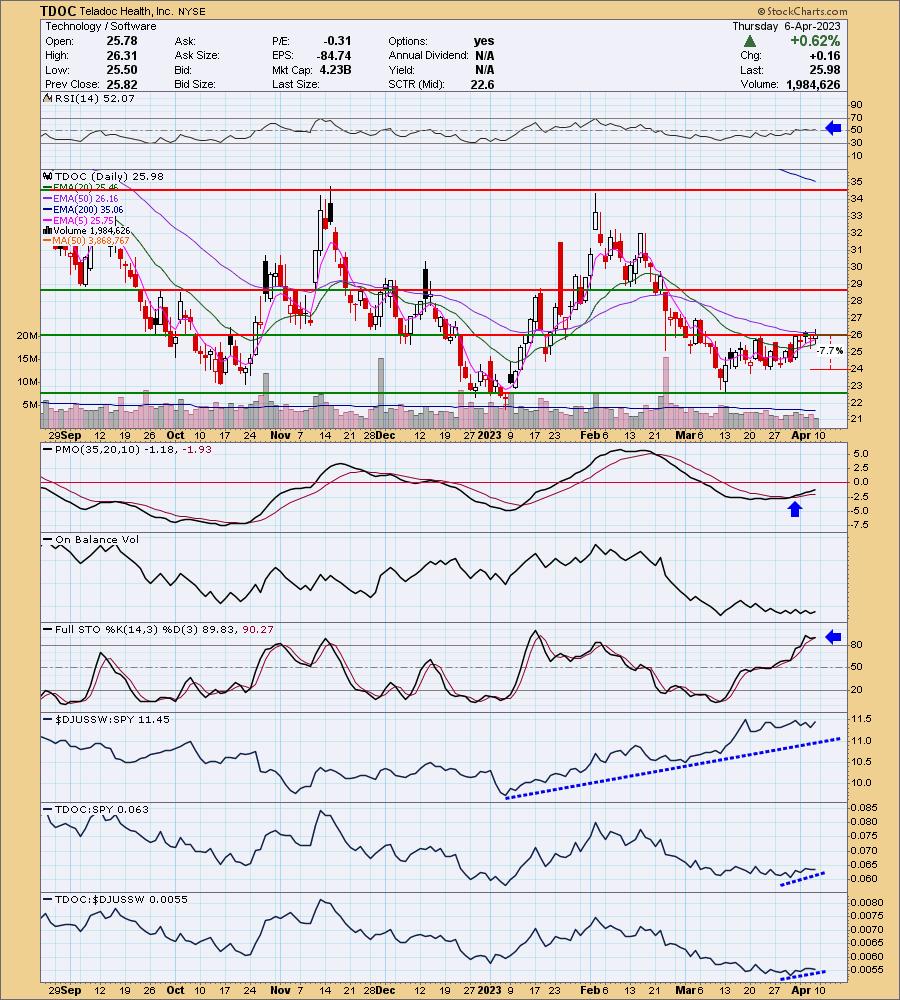
TDOC is down -0.08% in after hours trading. Price is currently struggling with horizontal resistance and the 50-day EMA. Indicators are positive enough to suggest it will breakout. The RSI is neutral but still in positive territory. As long as it isn't negative or overbought, we're good (although I do prefer it to be higher). The PMO is rising gently on a crossover BUY signal in oversold territory. The OBV is less than impressive, but Stochastics are oscillating above 80. Relative strength for the Software group has been excellent. While TDOC hasn't been showing great performance, it is seeing increasing relative strength against the group and SPY. The stop is set beneath the congestion zone at 7.7% or $23.97.
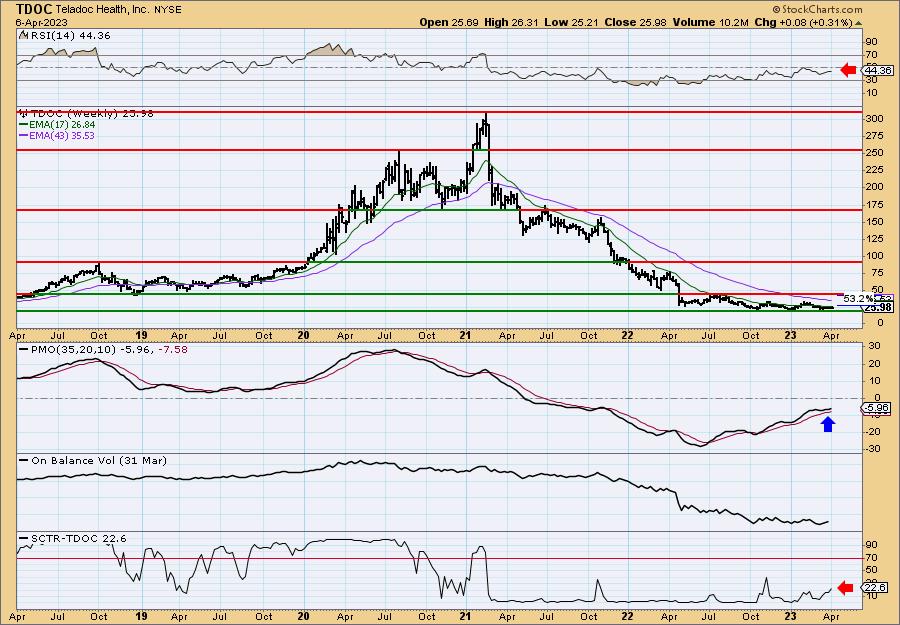
My first thought when I saw this was how many people lost their shirts as it went from $300 down to the $20 range? Hopefully they eased out on the way down, but that 2021 decline was painful! It's now established a solid basing pattern. Price is near the bottom of the trading range. If it moves to the top of the range it will be an over 53% gain. I don't know if it will get there, but certainly upside potential isn't a problem for TDOC. The weekly RSI is negative and the SCTR isn't healthy at all. On the bright side, the weekly PMO is rising after bullishly bottoming above the signal line. I'd consider this one more short-term in nature.
Voyager Therapeutics, Inc. (VYGR)
EARNINGS: 05/04/2023 (BMO)
Voyager Therapeutics, Inc. is a clinical-stage gene therapy company, which engages in the development of treatments for severe neurological diseases. Its pipeline of gene therapy programs includes VY-AADC, VY-SOD101, VY-HTT01, VY-FXN01, Tau Program, and VY-NAV01. The company was founded by Guang Ping Gao, Mark A. Kay, Krystof Bankiewicz, and Phillip Zamore in June 2013 and is headquartered in Cambridge, MA.
Predefined Scans Triggered: Elder Bar Turned Green, P&F High Pole and Entered Ichimoku Cloud.
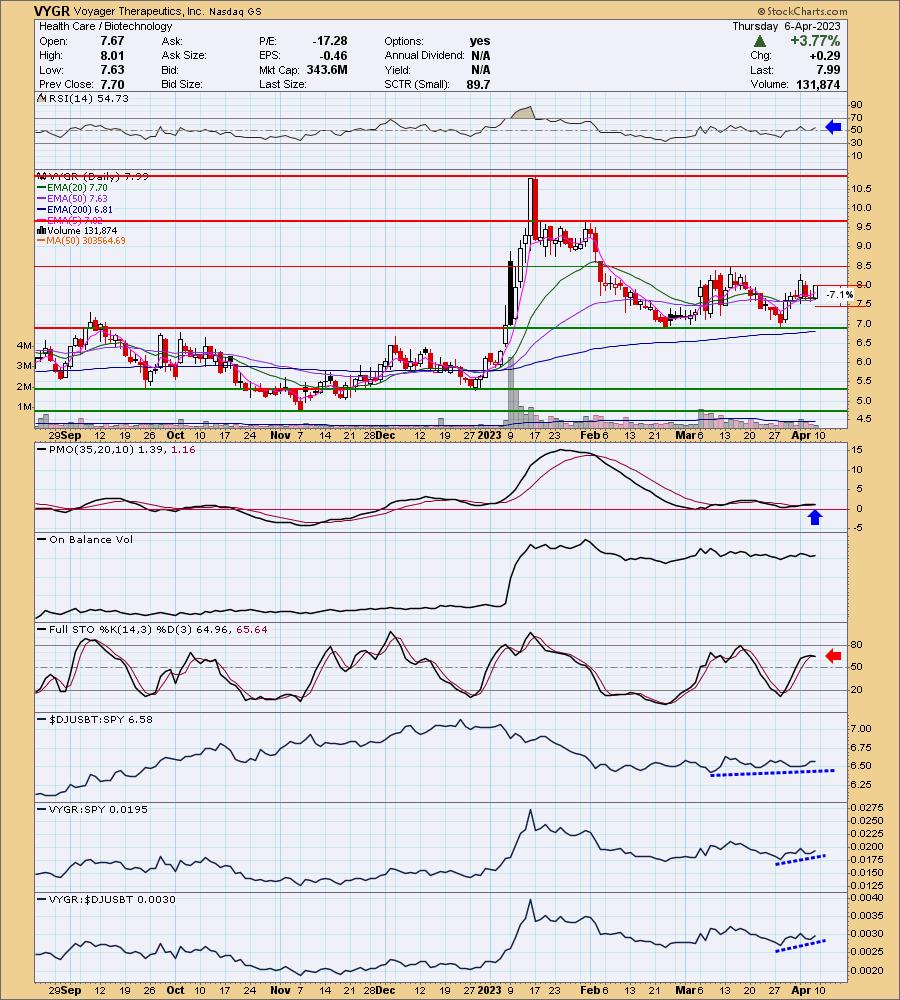
VYGR is down -4.13% in after hours trading. I don't look at after hours trading until I begin writing the section on a stock. I have to say the 4%+ loss right now gives me pause because this one hasn't broken out. It's a Biotech though and they do tend to whipsaw. On a positive note, it would offer you a good entry. The question will be whether it will weather the storm. If price does continue lower, I would change my tune on this one being bullish. Right now, it looks decent. There is a double-bottom pattern that is forming. It would be confirmed on a breakout above the March high. The indicators are good. The RSI is positive and the PMO is rising on a crossover BUY signal. Stochastics have begun to turn down, but they are still in positive territory. Relative strength is improving for the group and the stock. The stop is set below the EMAs at about 7.1% or $7.42.
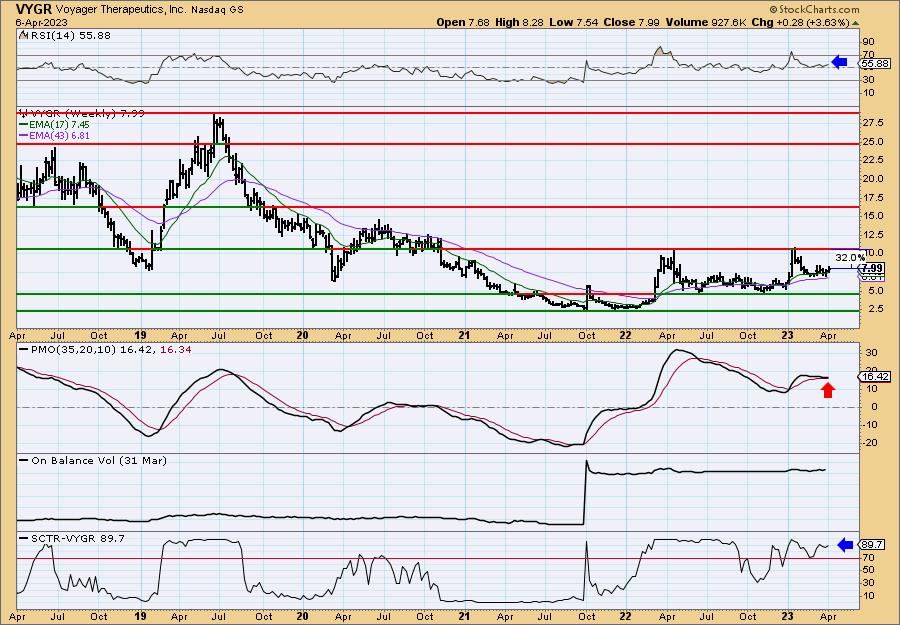
Price is forming a small rounded bottom above the 43-week EMA which I like. The weekly RSI is positive and the SCTR is a strong 89.7%. The weekly PMO is alright as it is currently on a crossover BUY signal, but the margin is very thin between it and its signal line so that could change quickly. If it can reach the top of this trading zone, it would be an over 30% gain. Since it is a Biotech, I would consider it a short-term investment out of the gate.
Don't forget, on Thursdays I look at reader-requested symbols, click HERE to send me an email. I read every email I receive and try to answer them all!
Current Market Outlook:
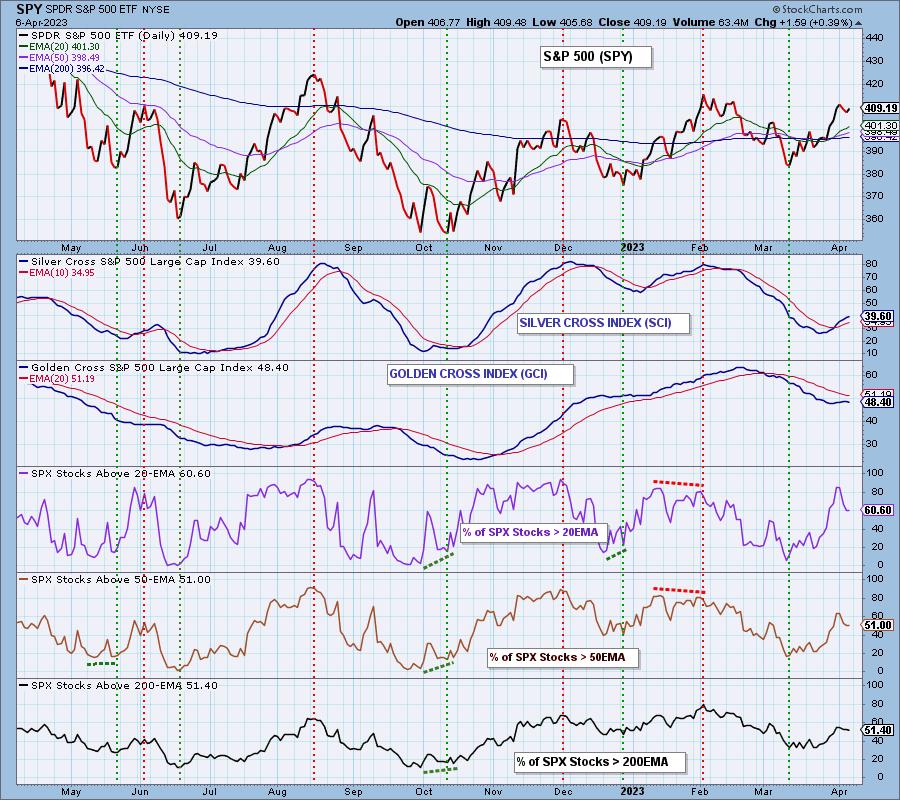
Market Environment: It is important to consider the odds for success by assessing the market tides. The following chart uses different methodologies for objectively showing the depth and trend of participation for intermediate- and long-term time frames.
- The Silver Cross Index (SCI) shows the percentage of SPX stocks on IT Trend Model BUY signals (20-EMA > 50-EMA)
- The Golden Cross Index (GCI) shows the percentage of SPX stocks on LT Trend Model BUY signals (50-EMA > 200-EMA)
Don't forget that as a "Diamonds" member, you have access to our GCI/SCI curated ChartList on DecisionPoint.com. You'll find it under "Members Only" links on the left side on the Blogs and Links Page.
Here is the current chart:
Full Disclosure: I am 26% long, 2% short.
I'm required to disclose if I currently own a stock I mention and/or may buy/short it within the next 72 hours.
"Technical Analysis is a windsock, not a crystal ball." - Carl Swenlin
(c) Copyright 2023 DecisionPoint.com
Watch the latest episode of DecisionPoint Trading Room with Carl & Erin Swenlin on Mondays 7:00p EST or on the DecisionPoint playlist on the StockCharts TV YouTube channel here!
NOTE: The stocks reported herein are from mechanical trading model scans that are based upon moving average relationships, momentum and volume. DecisionPoint analysis is then applied to get five selections from the scans. The selections given should prompt readers to do a chart review using their own analysis process. This letter is not a call for a specific action to buy, sell or short any of the stocks provided. There are NO sure things or guaranteed returns on the daily selection of "Diamonds in the Rough."
Regarding BUY/SELL Signals: The signal status reported herein is based upon mechanical trading model signals and crossovers. They define the implied bias of the price index/stock based upon moving average relationships and momentum, but they do not necessarily call for a specific action. They are information flags that should prompt chart review. Further, they do not call for continuous buying or selling during the life of the signal. For example, a BUY signal will probably (but not necessarily) return the best results if action is taken soon after the signal is generated. Additional opportunities for buying may be found as price zigzags higher, but the trader must look for optimum entry points. Conversely, exit points to preserve gains (or minimize losses) may be evident before the model mechanically closes the signal.
Helpful DecisionPoint Links:
DecisionPoint Shared ChartList and DecisionPoint Chart Gallery
Price Momentum Oscillator (PMO)
Swenlin Trading Oscillators (STO-B and STO-V)
For more links, go to DecisionPoint.com