
I just finished writing and realized I had not done an opening! Glad I caught it! Today I saw incredible strength in a new industry group. I had four stocks within that I liked, but rather than go "all in" on one industry group, I decided to mix it up.
The group is Recreational Products. I'm not sure what spurred this on, but it had the greatest advance in its SCTR among all Industry Groups that StockCharts covers. A few of these were down in after hours trading so this could be a "one off" event--another good reason not to present three of these stocks. The first three listed in Stocks to Review are the Recreational Products stocks.
I opted to include a Financial stock despite my misgivings of the sector. It isn't a Bank so that helped, but we would still exercise caution when fishing in this group. The bank crisis is not likely finished...think 2007-2008.
The final choice is from Healthcare. I've been on the lookout for strong stocks within this sector as rotation is favoring the sector. I found one that had two days of magnificent rally after weeks of being beat down.
Good Luck & Good Trading,
Erin
Today's "Diamonds in the Rough": ENVA, ICPT and LCII.
Other requests: POOL, THO, WGO, RXDX, ODFL, CAL and CUTR.

RECORDING LINK (4/7/2023):
Topic: DecisionPoint Diamond Mine (4/7/2023) LIVE Trading Room
Passcode: April#7th
REGISTRATION for 4/14/2023:
When: Apr 14, 2023 09:00 AM Pacific Time (US and Canada)
Topic: DecisionPoint Diamond Mine (4/14/2023) LIVE Trading Room
Register in advance for this webinar HERE.
After registering, you will receive a confirmation email containing information about joining the webinar.

Here is the last recording (4/10):
Welcome to DecisionPoint Diamonds, wherein I highlight ten "Diamonds in the Rough" per week. These are selected from the results of my DecisionPoint Scans which search for stocks that could benefit from the trend and condition of the market. Remember, these are not recommendations to buy or sell, but are the most interesting of the stocks that surfaced in my scans. My objective is to save you the work of the initial, tedious culling process, but you need to apply your own analysis to see if these stocks pique your interest as well. There are no guaranteed winners here!
"Predefined Scans Triggered" are taken from StockCharts.com using the "Symbol Summary" option instead of a "SharpChart" on the workbench.
Stop levels are all rounded down.
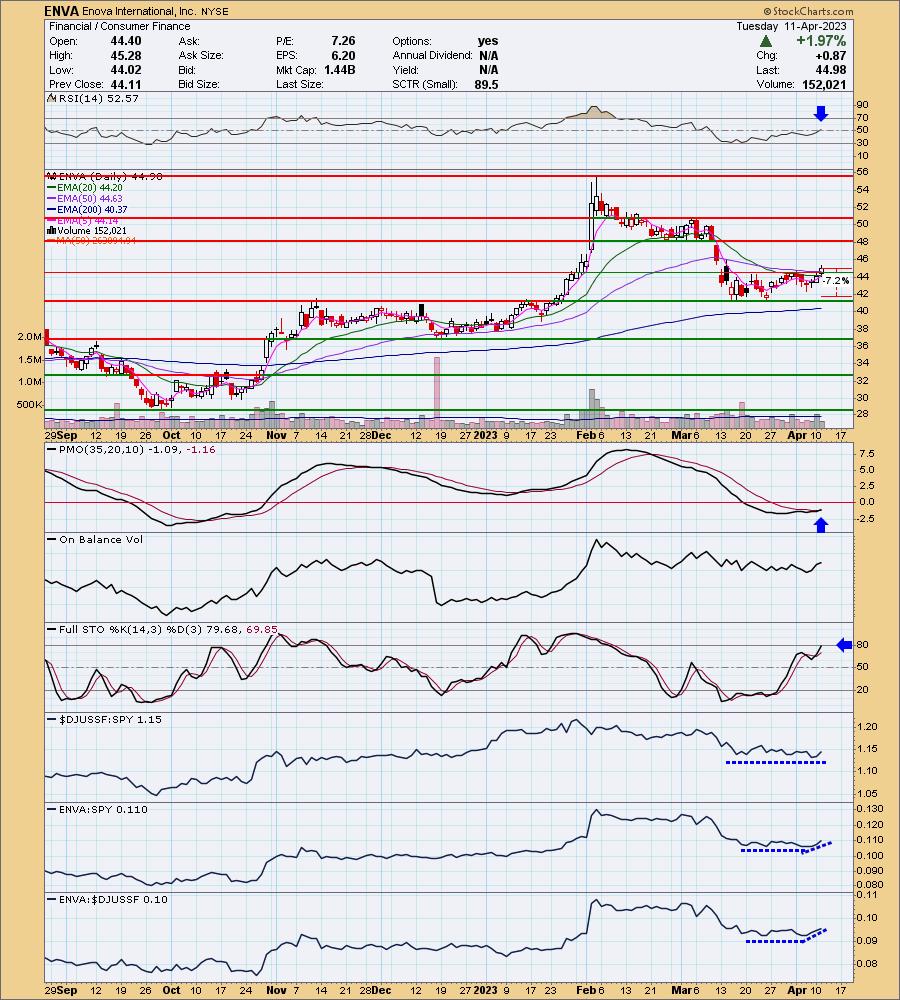
Enova International, Inc. (ENVA)
EARNINGS: 05/02/2023 (AMC)
Enova International, Inc. engages in the provision of online financial services. Its products and services include short-term consumer loan, line of credit accounts, instalment loans, receivables purchase agreements, credit services organization program, bank program, and decision management platform-as-a-service & analytics-as-a-service. It caters non-prime credit consumers and small businesses in the United States and Brazil. The company was founded by Albert Goldstein and Alexander Goldstein in 2003 and is headquartered in Chicago, IL.
Predefined Scans Triggered: New CCI Buy Signals and Moved Above Upper Bollinger Band.
ENVA is unchanged in after hours trading. I hesitated on this one because it is a member of the precarious Financial sector, but today price breakout encouraged me to pick it combined with other positive indicators. The RSI just moved into positive territory and the PMO gave us a crossover BUY Signal. Stochastics are rising strongly and should get above 80 tomorrow. Relative strength has been in line with the market which right now is a good thing overall. However, it is slowly beginning to outperform the group and SPY. The stop could be set a bit deeper below support, but that would be about an 8.25% stop which is past my threshold of 8%. As always stop levels are suggested, not set in stone. This stop is at 7.2% or $41.74.
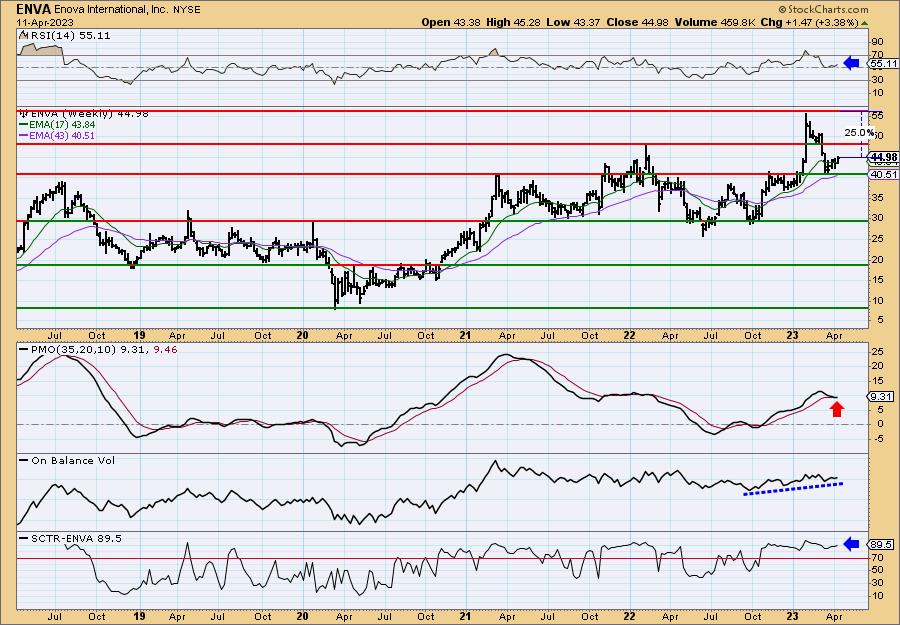
The weekly chart is mixed. On face value, given the weekly PMO is currently on a new crossover SELL signal, this should be considered a short-term investment. However, the rest of the chart is positive. Price is bouncing off strong support. The weekly RSI is positive and has been since last year. The OBV is rising with price bottoms and best is the strong StockCharts Technical Rank (SCTR) which is at the top of the "hot zone"* above 70. Upside potential is about 25%.
*We call it the "hot zone" because it implies that the stock/ETF is in the top 30% of its "universe" (large-, mid-, small-caps and ETFs) as far as trend and condition, particularly in the intermediate and long terms.
Intercept Pharmaceuticals, Inc. (ICPT)
EARNINGS: 05/04/2023 (BMO)
Intercept Pharmaceuticals, Inc. operates as a biopharmaceutical company. The firm engages in the research, development, and commercialization of novel therapeutics in treating chronic liver diseases. Its product pipeline includes OCALIVA, which is used for the treatment of biliary cholangitis, nonalcoholic steatohepatitis, sclerosing cholangitis and biliary atresia. The company was founded by Mark E. Pruzanski and Roberto Pellicciari on September 4, 2002 and is headquartered in Morristown, NJ.
Predefined Scans Triggered: New CCI Buy Signals
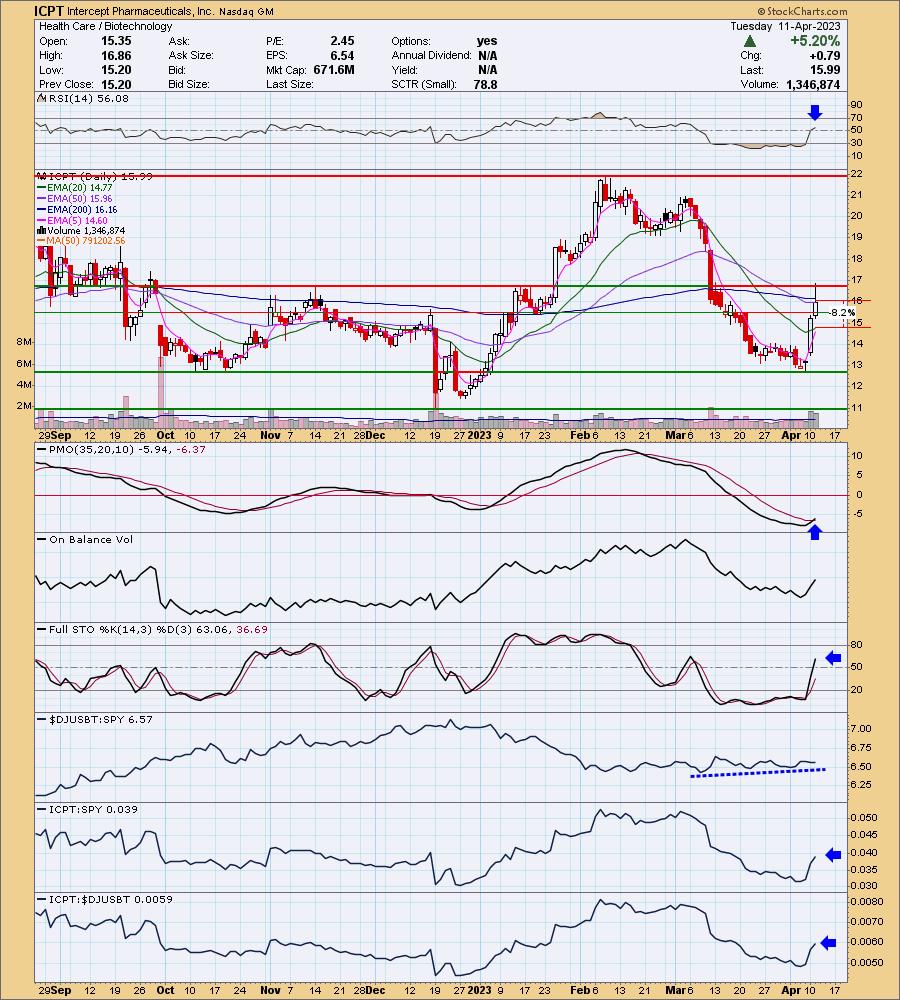
ICPT is up +4.00% in after hours trading. This one has had a powerful price thrust that has changed the entire complexion of this chart. The RSI has now moved in positive territory. The PMO just triggered a crossover BUY signal. Volume definitely came in on the rally based on the rise of the OBV. Stochastics are in positive territory and rising almost vertically. Biotechs are slowly beginning to outperform and this group has plenty of choices. ICPT is outperforming in a big way (naturally given these two days of rally) and looks on track to continue to outperform. The stop is deep, but given the 5%+ gain today, it was somewhat unavoidable. I've set it around the 20-day EMA at 8.2% or $14.67.
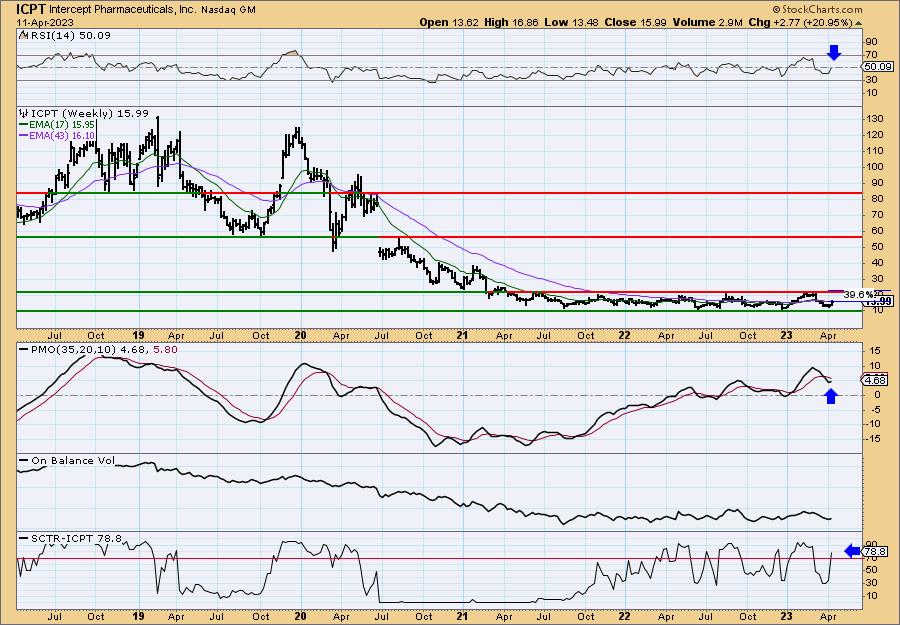
It's crazy to think this stock once traded over a hundred dollars. The weekly chart is positive and while that means this could be an intermediate-term trade, it is a Biotech so this is not a buy it and forget it stock. The weekly RSI just moved into positive territory. The weekly PMO is turning up on this week's rally. The SCTR jumped back into the hot zone above 70. Upside potential if it reaches the top of the long-term trading range is over 39%.
LCI Industries Inc. (LCII)
EARNINGS: 05/10/2023 (BMO)
LCI Industries engages in the manufacture, supply, and distribution of components for the original equipment manufacturers (OEM) of recreational vehicles and manufactured homes. It operates through the OEM and Aftermarket segments. The OEM segment offers components for buses, trailers used to haul boats, livestock, equipment and other cargo, trucks, pontoon boats, trains, manufactured homes, and modular housing. The Aftermarket segment includes training, product delivery, marketing, and technical support to customers, and the sale of replacement glass and awnings to fulfill insurance claims. The company was founded on March 20, 1984 and is headquartered in Elkhart, IN.
Predefined Scans Triggered: New CCI Buy Signals, Moved Above Upper Bollinger Band, Moved Above Ichimoku Cloud, Moved Above Upper Price Channel, Parabolic SAR Buy Signals, P&F Double Top Breakout and P&F Triple Top Breakout.
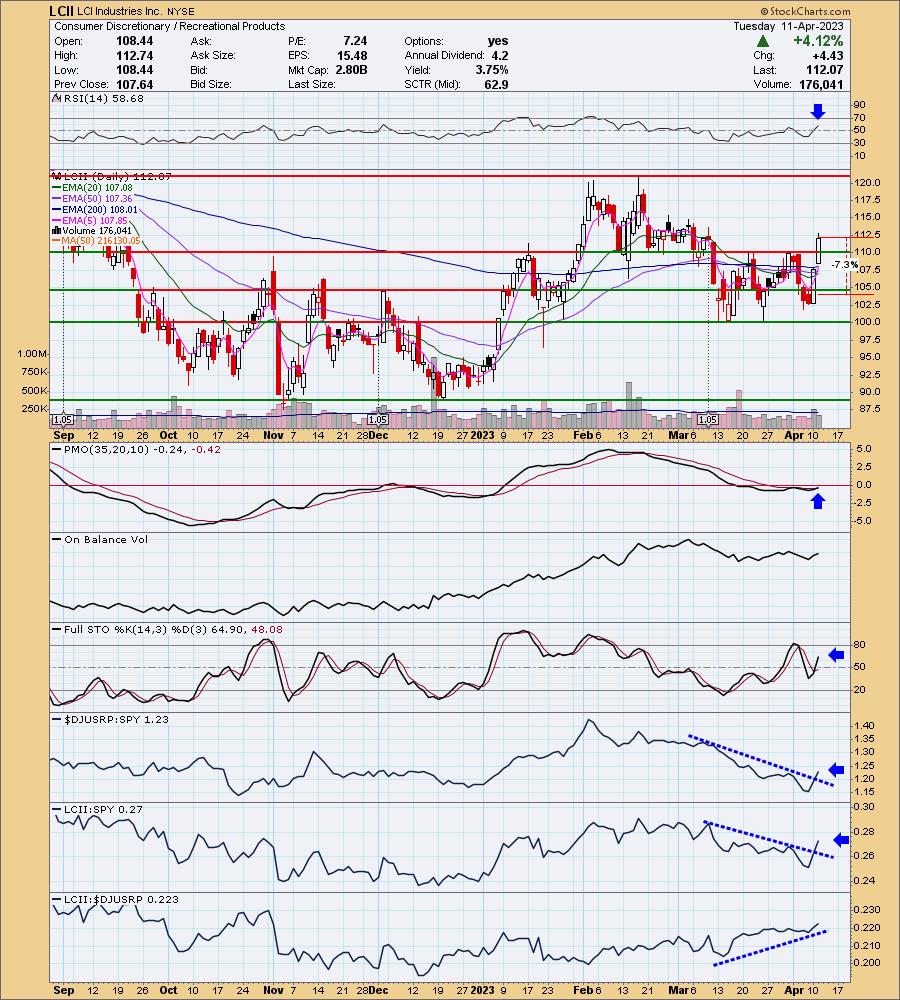
LCII is unchanged in after hours trading. Today saw a strong breakout, just like most stocks within this industry group. I picked this one based on clear outperformance of the group. The RSI is in positive territory and rising, not overbought. The PMO just triggered a crossover BUY signal. Stochastics are rising in positive territory. The stop is set at 7.3% or $103.88.
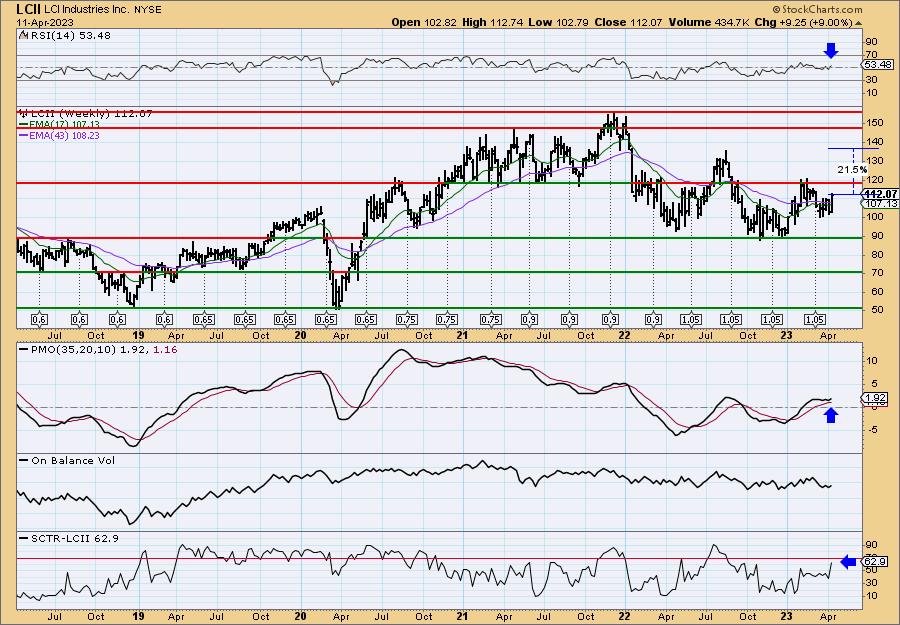
The weekly chart is above average. The weekly RSI is positive, but mostly neutral. The weekly PMO is bottoming above its signal line which is very bullish. The SCTR is average, but rising quickly. I mainly don't like how it has been stuck in a trading range. It didn't go all the way to the bottom of it this last time which is positive, but I'm not sure I trust it in the longer term. I've opted to mark the upside target at the 2022 high rather than get too optimistic.
Don't forget, on Thursdays I look at reader-requested symbols, click HERE to send me an email. I read every email I receive and try to answer them all!
Current Market Outlook:
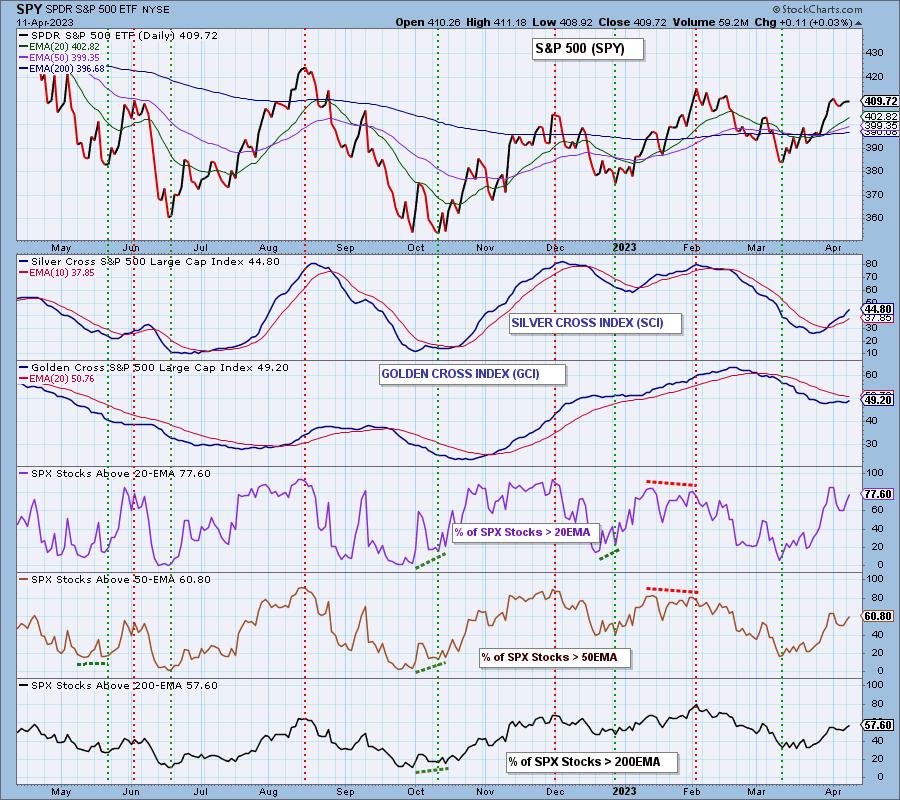
Market Environment: It is important to consider the odds for success by assessing the market tides. The following chart uses different methodologies for objectively showing the depth and trend of participation for intermediate- and long-term time frames.
- The Silver Cross Index (SCI) shows the percentage of SPX stocks on IT Trend Model BUY signals (20-EMA > 50-EMA)
- The Golden Cross Index (GCI) shows the percentage of SPX stocks on LT Trend Model BUY signals (50-EMA > 200-EMA)
Don't forget that as a "Diamonds" member, you have access to our GCI/SCI curated ChartList on DecisionPoint.com. You'll find it under "Members Only" links on the left side on the Blogs and Links Page.
Here is the current chart:
Full Disclosure: I am 26% long, 2% short.
I'm required to disclose if I currently own a stock I mention and/or may buy/short it within the next 72 hours.
"Technical Analysis is a windsock, not a crystal ball." - Carl Swenlin
(c) Copyright 2023 DecisionPoint.com
Watch the latest episode of DecisionPoint Trading Room with Carl & Erin Swenlin on Mondays 7:00p EST or on the DecisionPoint playlist on the StockCharts TV YouTube channel here!
NOTE: The stocks reported herein are from mechanical trading model scans that are based upon moving average relationships, momentum and volume. DecisionPoint analysis is then applied to get five selections from the scans. The selections given should prompt readers to do a chart review using their own analysis process. This letter is not a call for a specific action to buy, sell or short any of the stocks provided. There are NO sure things or guaranteed returns on the daily selection of "Diamonds in the Rough."
Regarding BUY/SELL Signals: The signal status reported herein is based upon mechanical trading model signals and crossovers. They define the implied bias of the price index/stock based upon moving average relationships and momentum, but they do not necessarily call for a specific action. They are information flags that should prompt chart review. Further, they do not call for continuous buying or selling during the life of the signal. For example, a BUY signal will probably (but not necessarily) return the best results if action is taken soon after the signal is generated. Additional opportunities for buying may be found as price zigzags higher, but the trader must look for optimum entry points. Conversely, exit points to preserve gains (or minimize losses) may be evident before the model mechanically closes the signal.
Helpful DecisionPoint Links:
DecisionPoint Shared ChartList and DecisionPoint Chart Gallery
Price Momentum Oscillator (PMO)
Swenlin Trading Oscillators (STO-B and STO-V)
For more links, go to DecisionPoint.com