
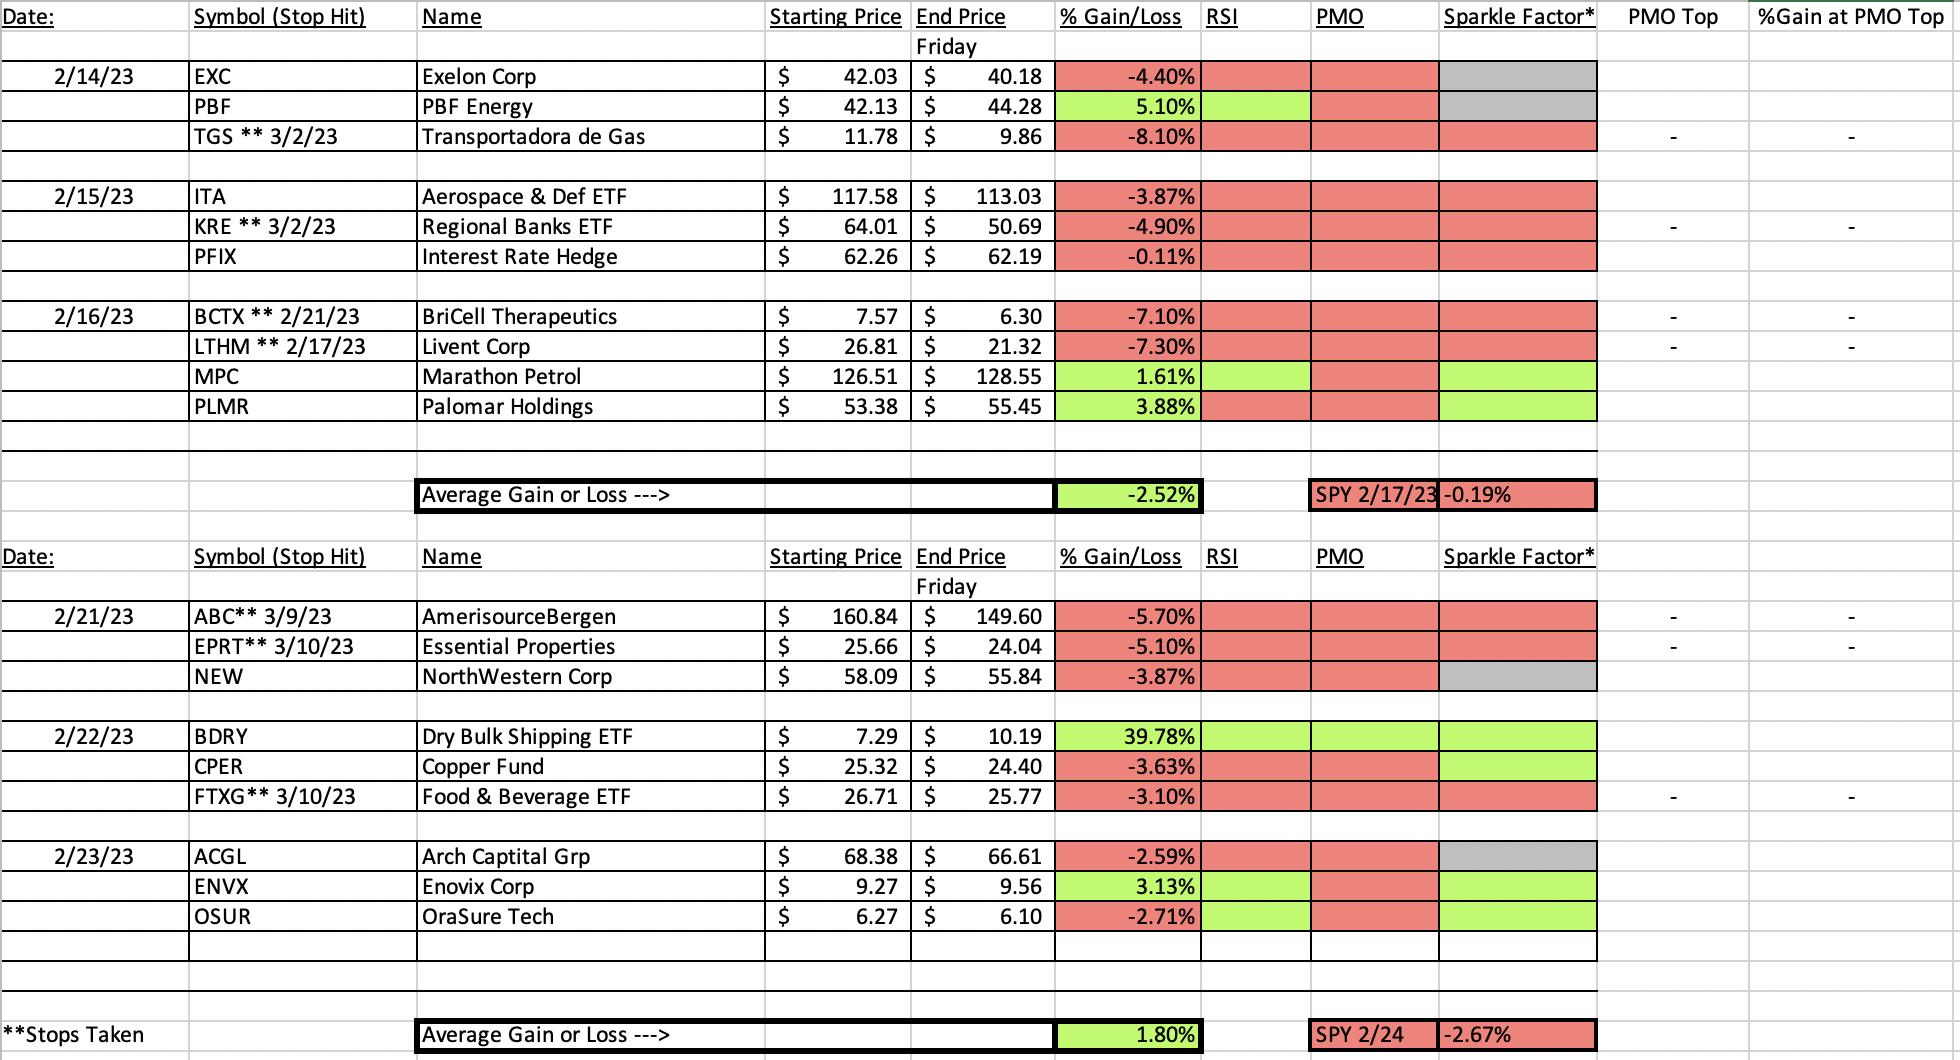
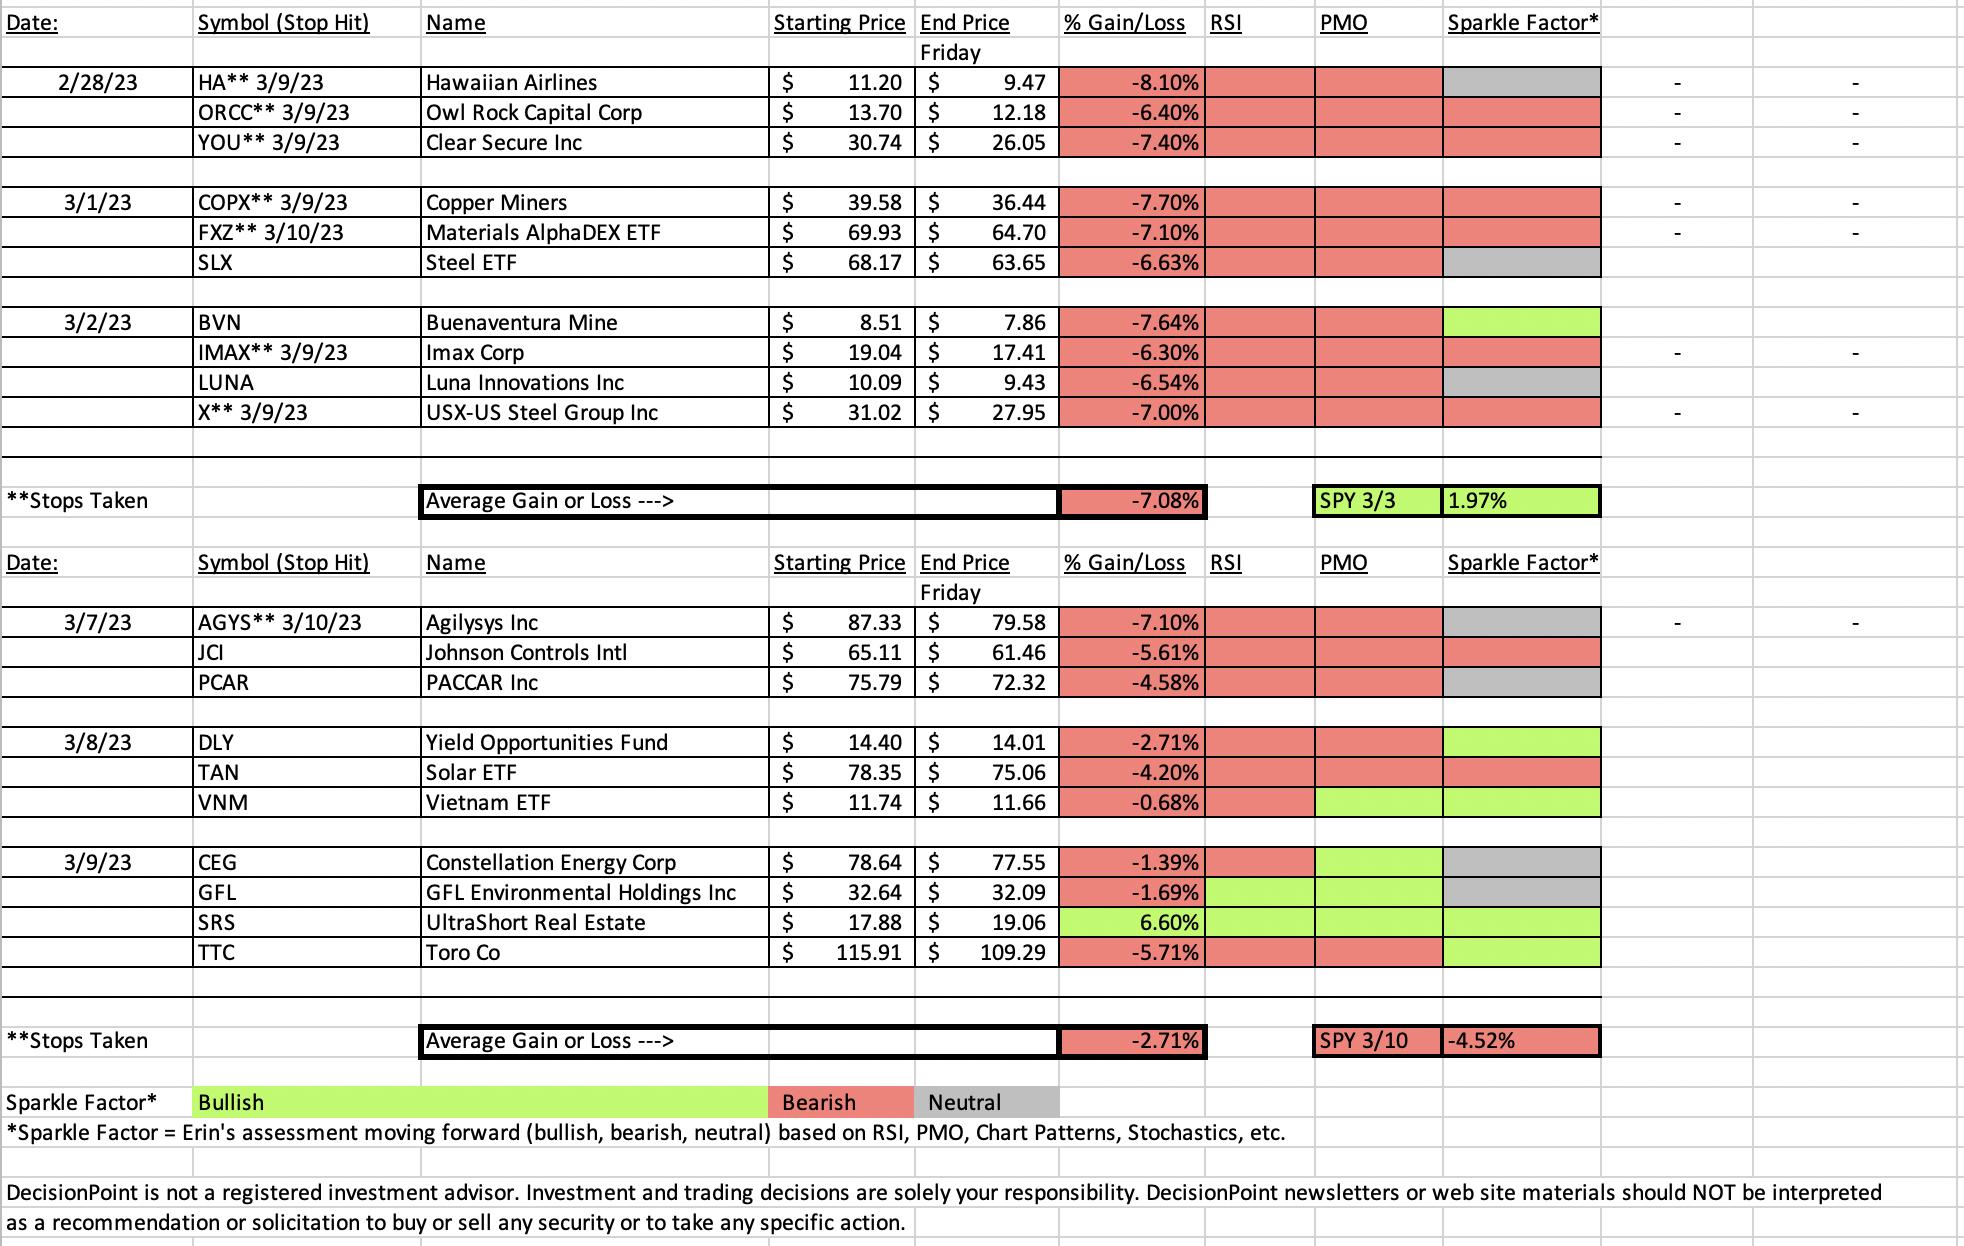
The last two days of trading were brutal for "Diamonds in the Rough", particularly our older positions. Our new positions didn't fare that well either, but on the week, our loss is far lower than the SPY's loss for the week.
After using and updating the monthly spreadsheet, I've determined that it will be too time intensive to update and publish it everyday. I will still try to notify if stops are hit within that day's report. Turns out it is quite tedious to look at every chart and determine whether RSIs and PMOs are falling or are negative. And, coming up with my take on where it will go (Sparkle Factors) is also time consuming. You WILL see them on Fridays and during the Diamond Mine trading room as usual.
You'll note that the last two columns of the spreadsheet say "PMO Top" and "%Gain". This is for stocks that initially went higher and then turned down and hit the stop. I want to record what kind of profit they at one point held. I decided a PMO Top was when I would look at that profit. Most of these stopped out positions never got going so you'll see "-" in those columns.
Have a great weekend!
Good Luck & Good Trading,
Erin

RECORDING LINK (3/10/2023):
Topic: DecisionPoint Diamond Mine (3/10/2023) LIVE Trading Room
Passcode: March@10th
REGISTRATION for 3/17/2023:
When: Mar 17, 2023 09:00 AM Pacific Time (US and Canada)
Topic: DecisionPoint Diamond Mine (3/17/2023) LIVE Trading Room
Register in advance for this webinar HERE
After registering, you will receive a confirmation email containing information about joining the webinar.

Our latest DecisionPoint Trading Room recording (3/6/2023):
A few items about the spreadsheet: I've put on the spreadsheet whether the RSI is positive (green) or negative (red). The PMO column tells you if it is rising (green) or falling (red). Finally I've added my own "Sparkle Factor" that gives you my assessment going forward, bullish (green), bearish (red) or neutral (gray). The Sparkle Factor is basically my thoughts on whether I expect it to rise or fall. A neutral means it could really go either way so it could be added to a watch list. If you're in a stock I consider "neutral" going forward, the ball is in your court.
Darling:
ProShares UltraShort Real Estate (SRS)
EARNINGS: N/A
SRS provides 2x inverse exposure to a market-cap-weighted index of large US real estate companies, including REITs. Click HERE for more information.
Predefined Scans Triggered: Elder Bar Turned Green, New CCI Buy Signals, Moved Above Ichimoku Cloud, Moved Above Upper Price Channel, Parabolic SAR Buy Signals and P&F Low Pole.
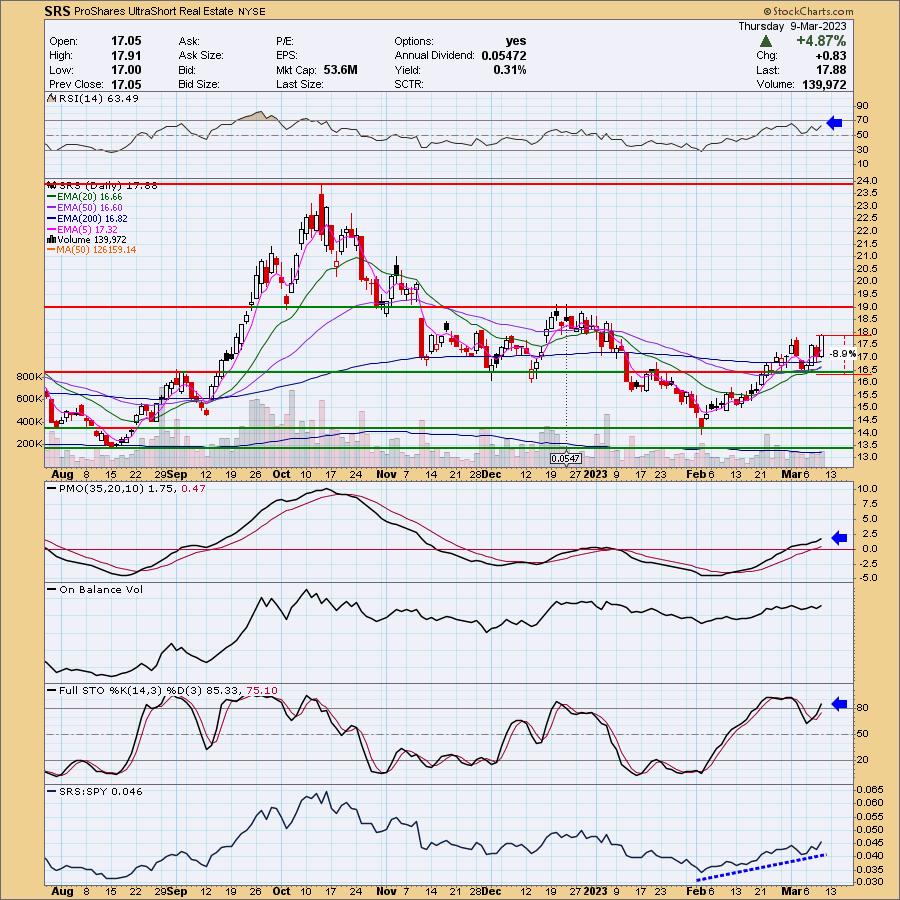
Below are the commentary and chart from yesterday (3/9):
"SRS is down -0.11% in after hours trading. This is a hedge so a large position isn't a good idea, but it can protect you if the market takes a downturn. I like the chart as Real Estate (XLRE) has been showing significant weakness and weak participation. The indicators are quite positive. The RSI is positive and the PMO is accelerating its rise. It is above the zero line and not overbought. Stochastics turned back up in positive territory and are now above 80 where we want them. Relative strength has been excellent against the market. The stop must be deep as it is a 2x inverse. An 8.9% stop is equivalent to a 4.5% stop on a short of XLRE and that is pretty thin. Fortunately we have a support level that we can set the stop beneath and it equals 8.9% or around $16.28."
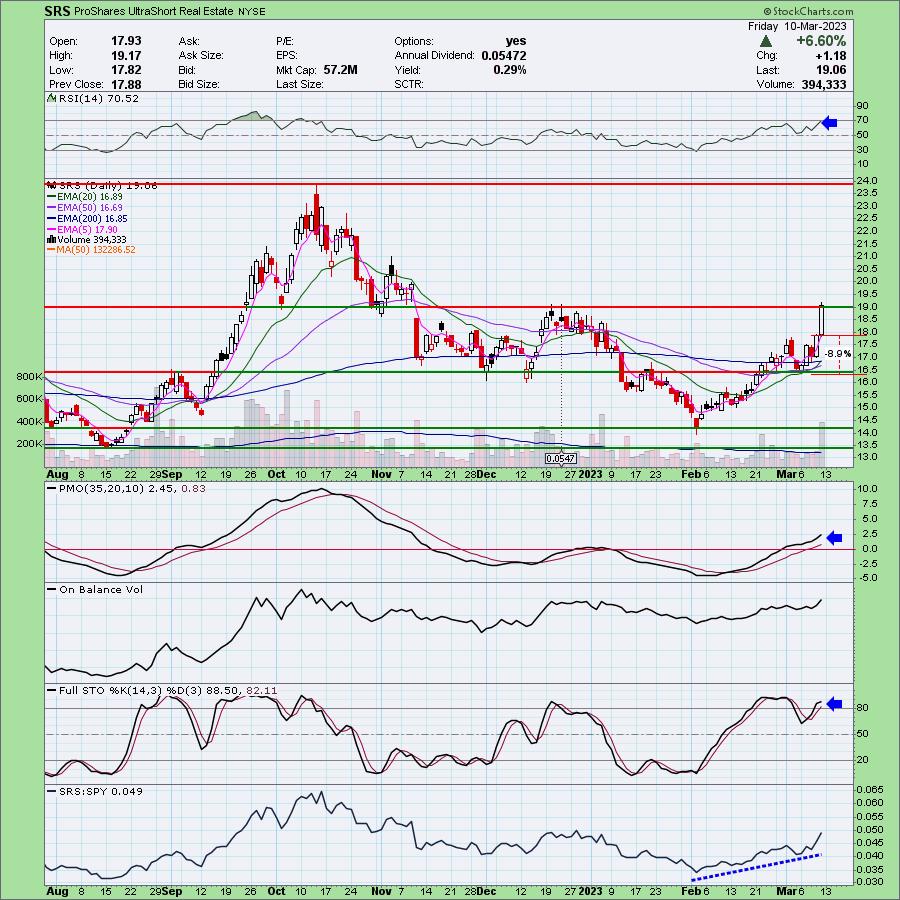
Here is today's chart:
Today we discussed how none of the sectors have rising momentum and all look quite bearish. The two most bearish in my opinion were Real Estate and Financials. Therefore it is no surprise that this ultrashort of the Real Estate sector soared today. I expect it to continue to soar, although a snapback is due for the market so an entry might avail itself on Monday or Tuesday if you don't want to get it at this price level. You can raise the stop level to around $17.50.
Don't forget, on Thursdays I look at reader-requested symbols, so shoot me an email at erin@decisionpoint.com. I read every email I receive and try to answer them all!
Dud:
Agilysys Inc. (AGYS)
EARNINGS: 05/16/2023 (AMC)
Agilysys, Inc. operates as a technology company. It offers innovative software for point-of-sale, payment gateway, reservation and table management, guest offers management, property management, inventory and procurement, analytics, document management, and mobile and wireless solutions and services to the hospitality industry. The firm also serves the gaming industry for both corporate and tribal, hotels resort and cruise, foodservice management, and the restaurant, university, and healthcare sectors. The company was founded in 1963 and is headquartered in Alpharetta, GA.
Predefined Scans Triggered: New 52-week Highs, Moved Above Upper Bollinger Band, P&F Double top Breakout and P&F triple Top Breakout.
Below are the commentary and chart from Tuesday (3/7):
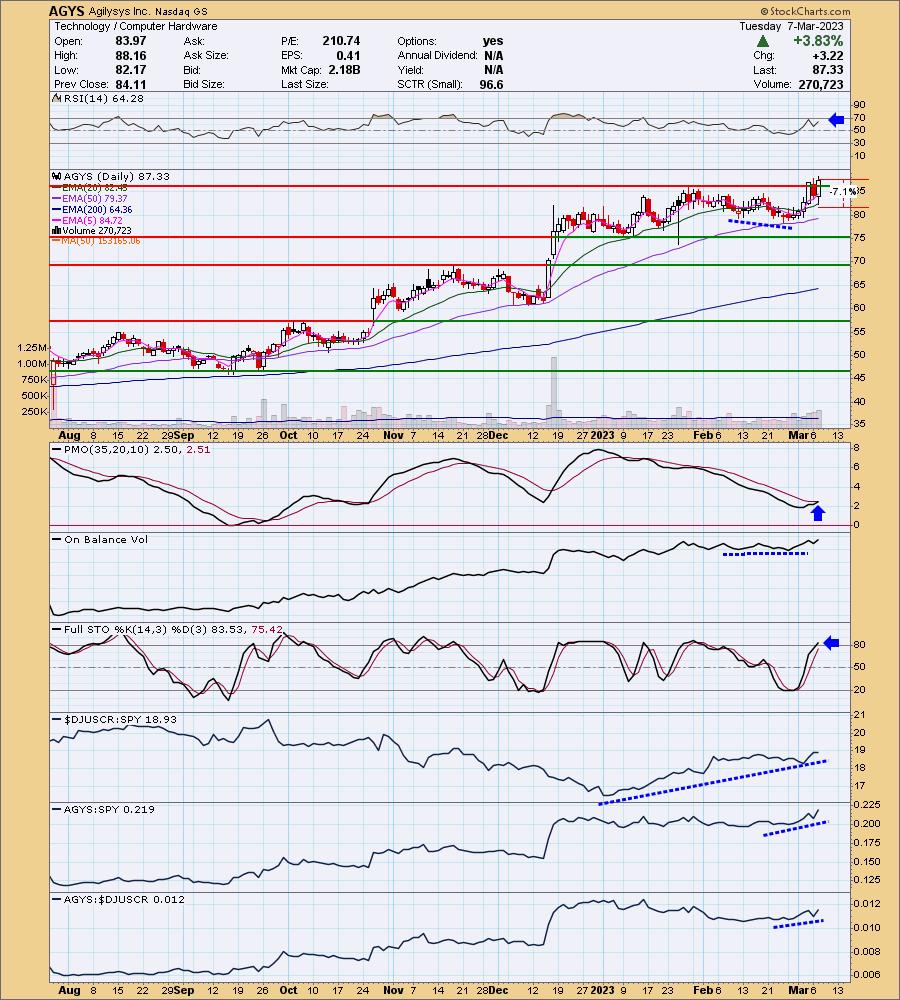
"AGYS is unchanged in after hours trading. The market had a bad day, but AGYS did not. In fact, it formed a giant bullish engulfing candlestick and maintained the breakout from Friday. The RSI is positive and the PMO is about to trigger a crossover BUY signal. The OBV holds a slight positive divergence with price lows. Typically those divergences will lead to extended rallies. Stochastics have reached above 80 and relative strength shows a group and this stock beginning to outperform again as relative performance did cool last month. I've set a stop below the 20-day EMA at 7.1% or $81.12."
Here is today's chart:
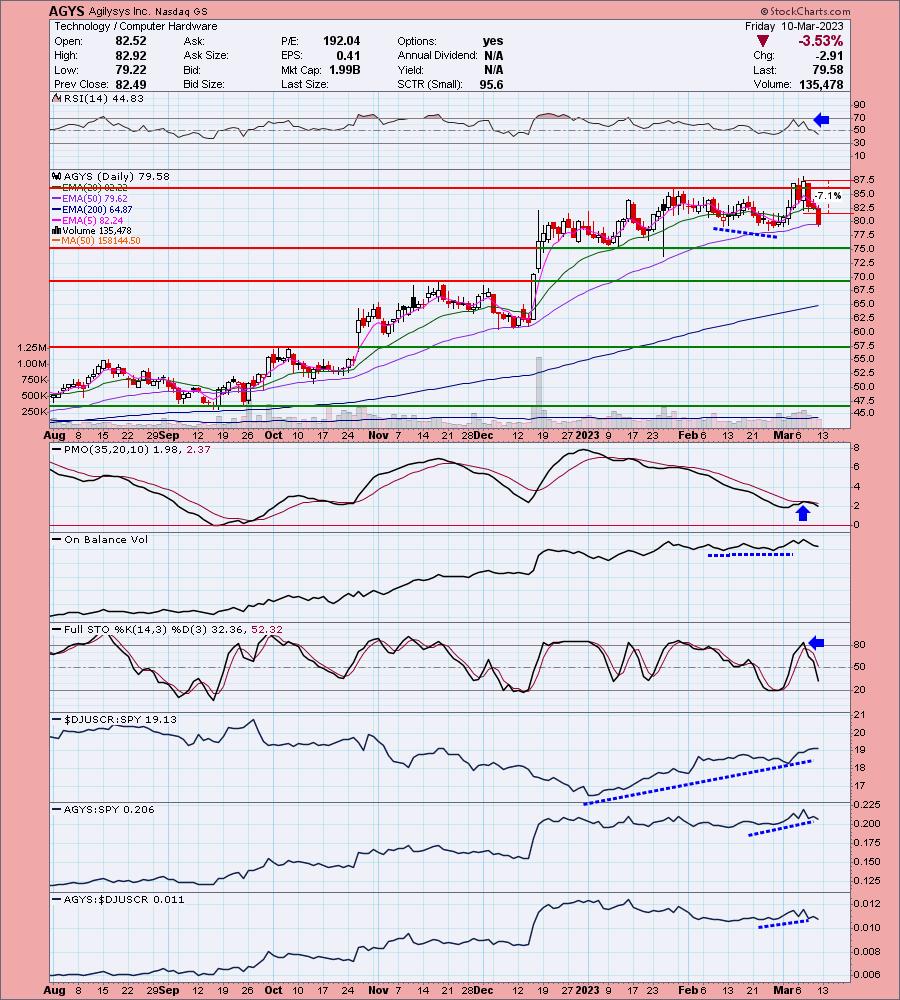
After a second successful breakout, price hit the skids with the rest of the market. Price even dipped below the 50-day EMA. Understandably, the indicators have reversed direction and this is no longer bullish. It could be worth the watch list since it is arriving at two support levels and could reverse. I would need the PMO to begin turning up or at least decelerate its decline.
THIS WEEK's Sector Performance:
DecisionPoint Sector Scoreboard (Mechanical Trend Model Signals):
Click Here to view Carl's annotated Sector ChartList!
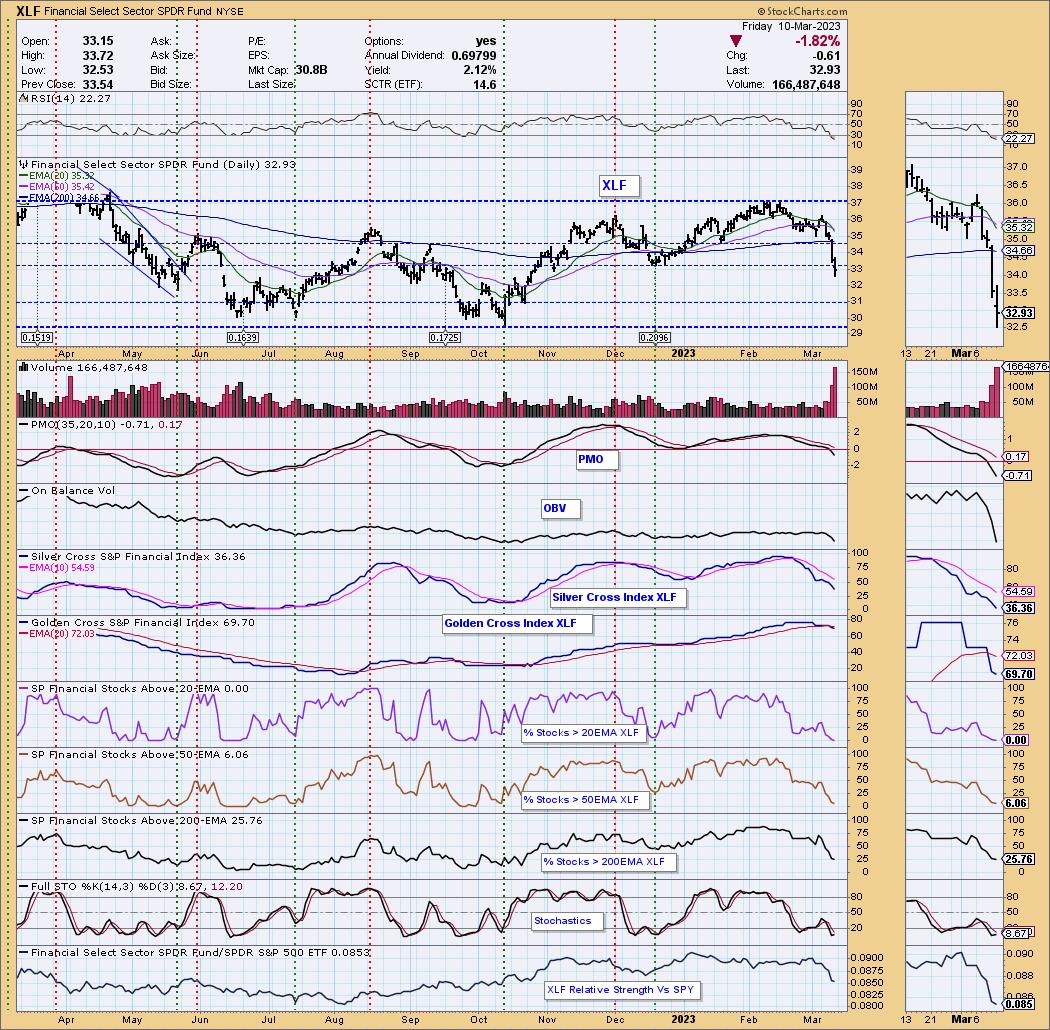
Sector to Watch: Financials (XLF) ** SHORT **
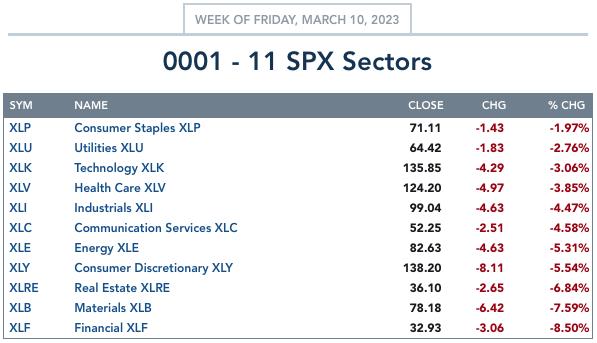
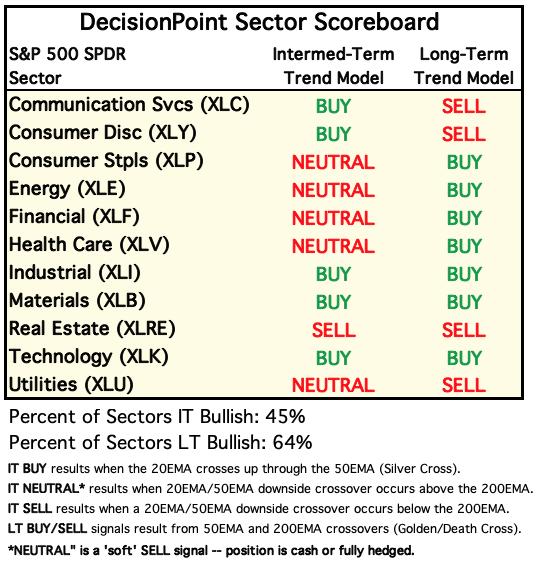
As noted in the opening, all sectors are bearish, so the "Sector to Watch" will actually be a short. There are two vehicles that I found that you can use to trade Financials on the short side, SEF and SKF which is the ultrashort 2x ETF. It's a really ugly chart primarily due to the slide in Banks thanks to Silvergate. Still, I don't think this decline is over given how support was slashed at 33.00. Today saw a "Dark Cross" of the 20/50-day EMAs which generated an IT Trend Model Neutral Signal. It is "neutral" (meaning in cash or fully hedged) because the crossover occurred above the 200-day EMA.
Note participation is barely there. No stocks have price above their 20-day EMA and only a few with price above the 50-day EMA. The Silver Cross Index is low, but not as low as it could go. The Golden Cross Index is overbought and should begin to tumble as a significant number of stocks lost support at the 50/200-day EMAs. The next support line is at 31.00, but I could see 29.00 being tested before this is all over with.
Industry Group to Watch: Renewable Energy ($DWCREE) - Not really...
This is the only industry group with a rising PMO. However, I don't think this one looks healthy. The Solar ETF (TAN) which was a "Diamond in the Rough" on Wednesday is failing and its PMO is falling. Consequently this chart is for information purposes, not a suggestion that TAN will reverse next week. The only reason $DWCREE has a rising PMO is the the amazing price thrust last week. The PMO is only beginning to digest that move. It is decelerating and I expect it will turn over next week. This is a clear rounded top.
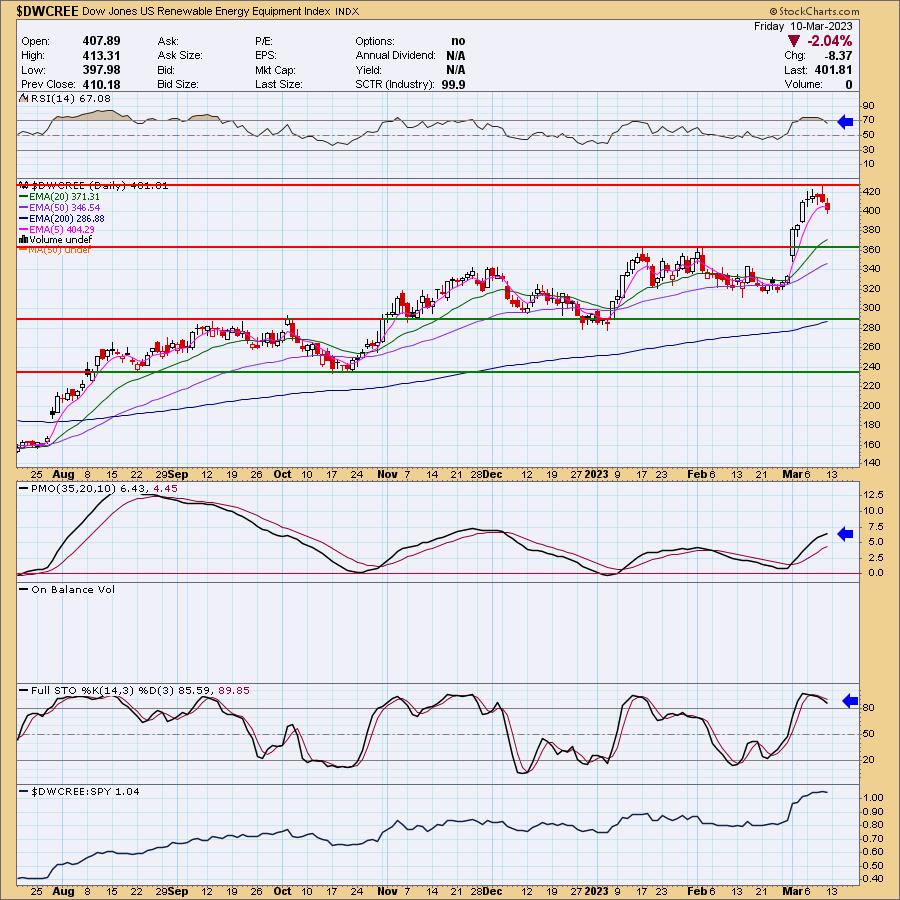
I'm looking for a snapback early next week which will offer us all an opportunity to sell at better prices. I'm going to put on a short position with either the Financial inverses I mentioned or a position in REK or SEF.
Go to our Sector ChartList on DecisionPoint.com to get an in-depth view of all the sectors. On StockCharts.com you can find the Industry Summary.
Good Luck & Good Trading!
- Erin
erin@decisionpoint.com
Full Disclosure: I'm 25% long, 0% short. As noted in the conclusion, I plan on adding hedges next week.
Watch the latest episode of the DecisionPoint Trading Room with Carl & Erin Swenlin on Mondays 3:00p EST!
Technical Analysis is a windsock, not a crystal ball. --Carl Swenlin
NOTE: The stocks reported herein are from mechanical trading model scans that are based upon moving average relationships, momentum and volume. DecisionPoint analysis is then applied to get selections from the scans. The selections given should prompt readers to do a chart review using their own analysis process. This letter is not a call for a specific action to buy, sell or short any of the stocks provided. There are NO sure things or guaranteed returns on the selection of "diamonds in the rough."
Helpful DecisionPoint Links:
DecisionPoint Shared ChartList and DecisionPoint Chart Gallery
Price Momentum Oscillator (PMO)
Swenlin Trading Oscillators (STO-B and STO-V)
(c) Copyright 2023 DecisionPoint.com