
I got a very interesting Mailbag question today regarding the location of PMO crossovers. It essentially went like this:
With the PMO rising, if it were to have a crossover BUY below the zero line, am I correct that you might be more hesitant? Should I use a rising or positive RSI as confirmation and not worry about the PMO if it crosses below zero?
My answer:
"A PMO crossover is good no matter where it occurs. A stock that has been beat down will not have a PMO above zero, but when it does turn in oversold territory, it is a good sign that the stock is ready to rebound. Because it is below the zero line, we have to mitigate risk with stops or babysitting at the very least.
A PMO crossover right above the zero line is certainly best, it tells us the stock is ready to move after a period of consolidation or a pullback. With it above zero, we have less risk than when it is below zero.
I don't turn down a PMO BUY signal. The location simply tells us our risk factor as below zero line stocks are vulnerable to pullbacks/corrections.
Using indicators to confirm a PMO crossover like a positive RSI, high SCTR, your risk is lowered if they are confirming a crossover."
Don't forget to sign up for tomorrow's Diamond Mine trading room! The link to register is below the Diamonds logo. You'll also find recording links there too, including the latest DP Trading Room recording. REMEMBER, save your confirmation email with the link to join to avoid any delays!
Good Luck & Good Trading,
Erin
Today's "Diamonds in the Rough": CEG, GFL, SRS and TTC.
Other requests: IOVA, BRKR, CHRW, DAL, IMO, SLRC, TMCI, VYGR, JYNT and EXPD.

RECORDING LINK (3/3/2023):
Topic: DecisionPoint Diamond Mine (3/3/2023) LIVE Trading Room
Recording Link
Passcode: March#3rd
REGISTRATION for 3/10/2023:
When: Mar 10, 2023 09:00 AM Pacific Time (US and Canada)
Topic: DecisionPoint Diamond Mine (3/10/2023) LIVE Trading Room
Register in advance for this webinar HERE
After registering, you will receive a confirmation email containing information about joining the webinar.

Here is the last recording (3/6):
Welcome to DecisionPoint Diamonds, wherein I highlight ten "Diamonds in the Rough" per week. These are selected from the results of my DecisionPoint Scans which search for stocks that could benefit from the trend and condition of the market. Remember, these are not recommendations to buy or sell, but are the most interesting of the stocks that surfaced in my scans. My objective is to save you the work of the initial, tedious culling process, but you need to apply your own analysis to see if these stocks pique your interest as well. There are no guaranteed winners here!
"Predefined Scans Triggered" are taken from StockCharts.com using the "Symbol Summary" option instead of a "SharpChart" on the workbench.
Stop levels are all rounded down.
Constellation Energy Corp. (CEG)
EARNINGS: 05/10/2023 (BMO)
Constellation Energy Corp. engages in the generation, supply, and marketing of clean energy electricity, and renewable energy products and solutions. It operates under the following geographical segments: Mid-Atlantic, Midwest, New York, Texas, and Other Power Regions Segment. The company is headquartered in Baltimore, MD.
Predefined Scans Triggered: Bullish MACD Crossovers, Parabolic SAR Buy Signals and P&F Low Pole.
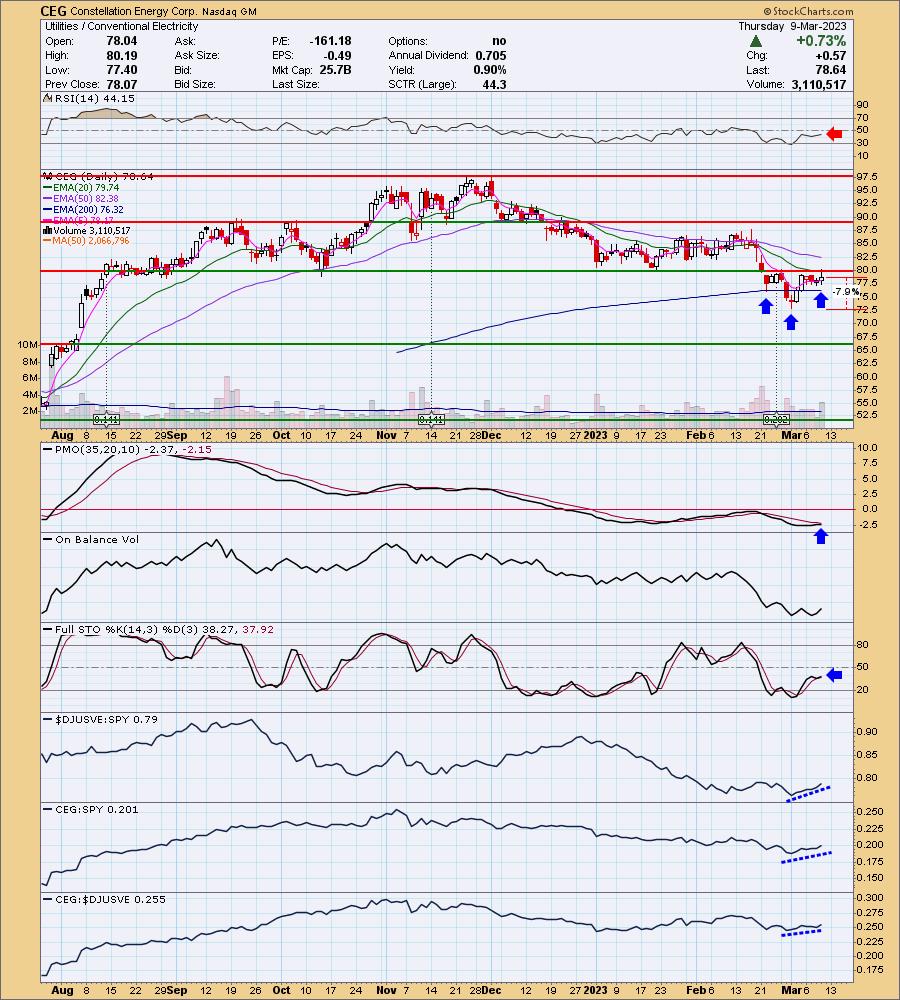
CEG is down -0.78% in after hours trading. Here we have a bullish reverse head and shoulders pattern. The pattern won't be confirmed until we get a breakout above $80, but indicators are firming up suggesting the pattern will be confirmed soon. The RSI is still a problem in negative territory, but the PMO is about to give us a crossover BUY signal. Stochastics have turned back up, but are also still in negative territory. Relative strength is improving across the board for the group and CEG. The stop is set rather deep at 7.9% or $72.42, but it could be tightened up to the 200-day EMA if you want less risk.
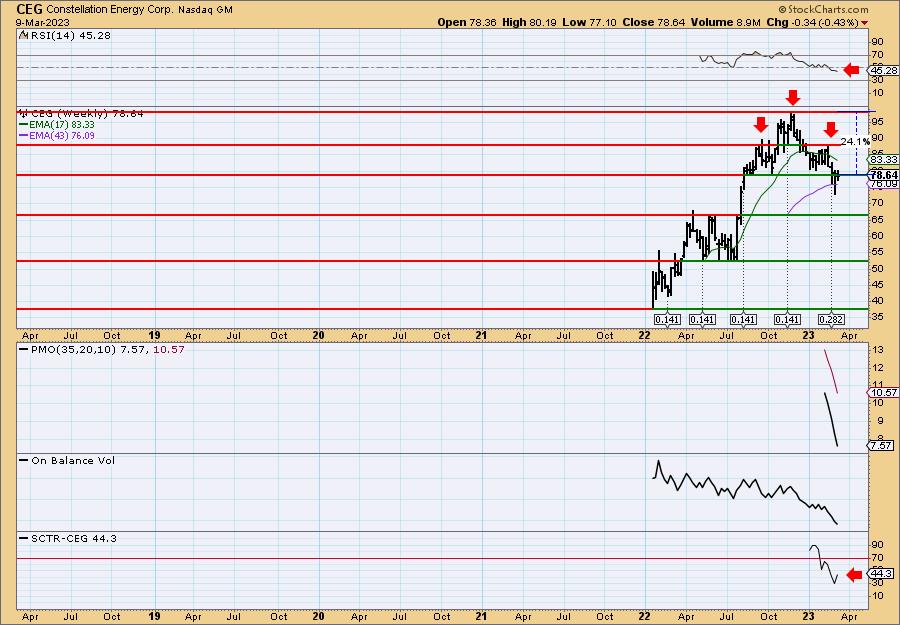
Speaking of head and shoulders patterns, we have a huge one on the weekly chart. It hasn't closed beneath the neckline yet so a reversal isn't out of the question. Still with a negative weekly RSI, falling weekly PMO and low StockCharts Technical Rank (SCTR), we would consider this a short-term trade.
GFL Environmental Holdings Inc (GFL)
EARNINGS: 05/03/2023 (AMC)
GFL Environmental, Inc. engages in the provision of ecological solutions. It operates through the following segments: Solid Waste, Infrastructure and Soil Remediation, Liquid Waste, and Corporate. The Solid Waste segment includes hauling, landfill, transfers, and material recovery facilities. The Infrastructure and Soil Remediation provides remediation of contaminated soils as well as complementary services, including civil, demolition, excavation, and shoring services. The Liquid Waste segment collects, transports, processes, recycles, and disposes liquid wastes from commercial and industrial customers. The company was founded by Patrick Dovigi on December 19, 2007 and is headquartered in Vaughan, Canada.
Predefined Scans Triggered: P&F Double Top Breakout.
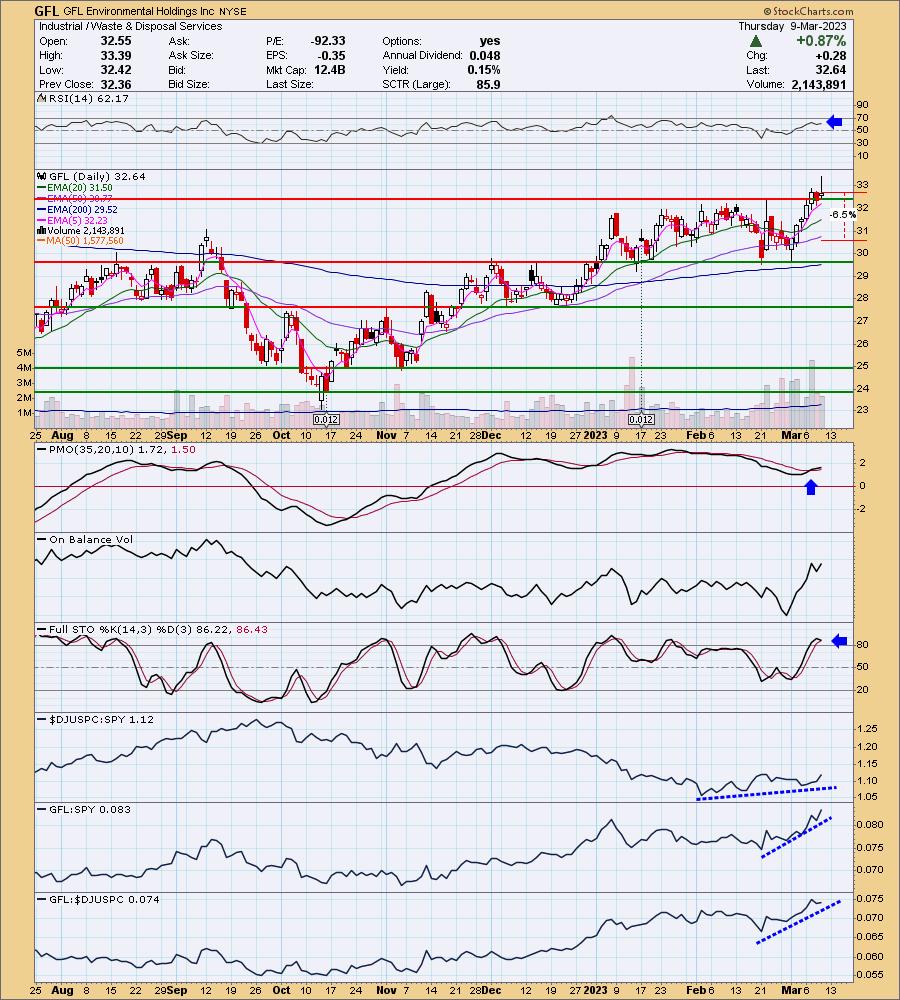
GFL is down -0.67% in after hours trading. It broke out on Tuesday and pulled back to the breakout point. Today the rally saw continuation and support hold. The RSI is positive and the PMO triggered a crossover BUY signal above the zero line, but not in overbought territory. Stochastics are rising and certainly volume is coming in based on the steeply rising OBV. Relative strength for the group is improving, but GFL has been showing great relative strength since the end of February. The stop is set below the 50-day EMA at 6.5% around $30.51.
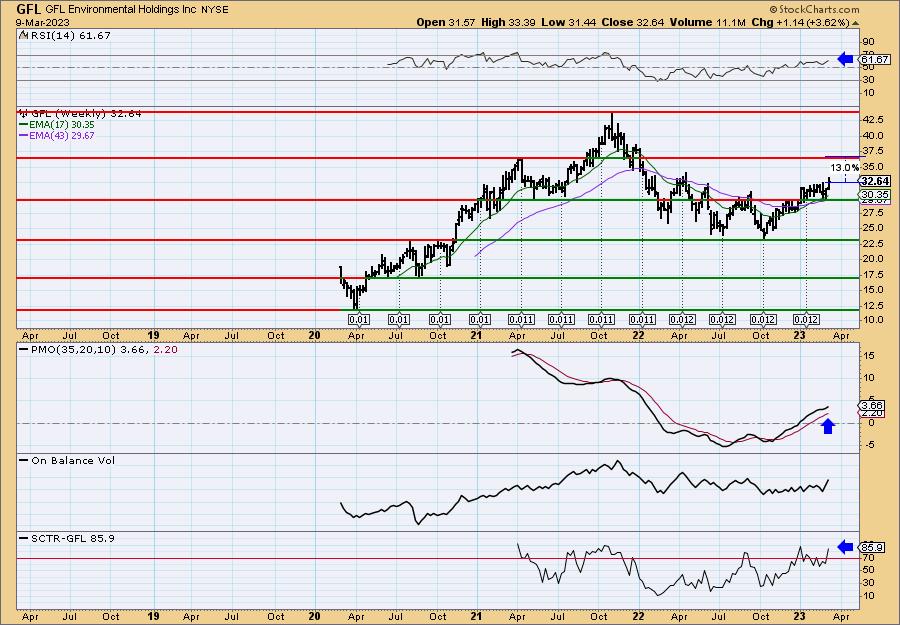
I've marked the gain should price reach overhead resistance at the April 2021 top. However, it only has one "touch", the top so it isn't that strong. We think it will likely do more than 13%, but that is where you need to pay particular attention (about $37). The indicators look great. The weekly RSI is positive and the weekly PMO has bottomed above its signal line. The weekly PMO is also rising and not overbought. The SCTR is in the "hot zone" above 70.*
*We call it the "hot zone" because it implies that the stock/ETF is in the top 30% of its "universe" (large-, mid-, small-caps and ETFs) as far as trend and condition, particularly in the intermediate and long terms.
ProShares UltraShort Real Estate (SRS)
EARNINGS: N/A
SRS provides 2x inverse exposure to a market-cap-weighted index of large US real estate companies, including REITs. Click HERE for more information.
Predefined Scans Triggered: Elder Bar Turned Green, New CCI Buy Signals, Moved Above Ichimoku Cloud, Moved Above Upper Price Channel, Parabolic SAR Buy Signals and P&F Low Pole.
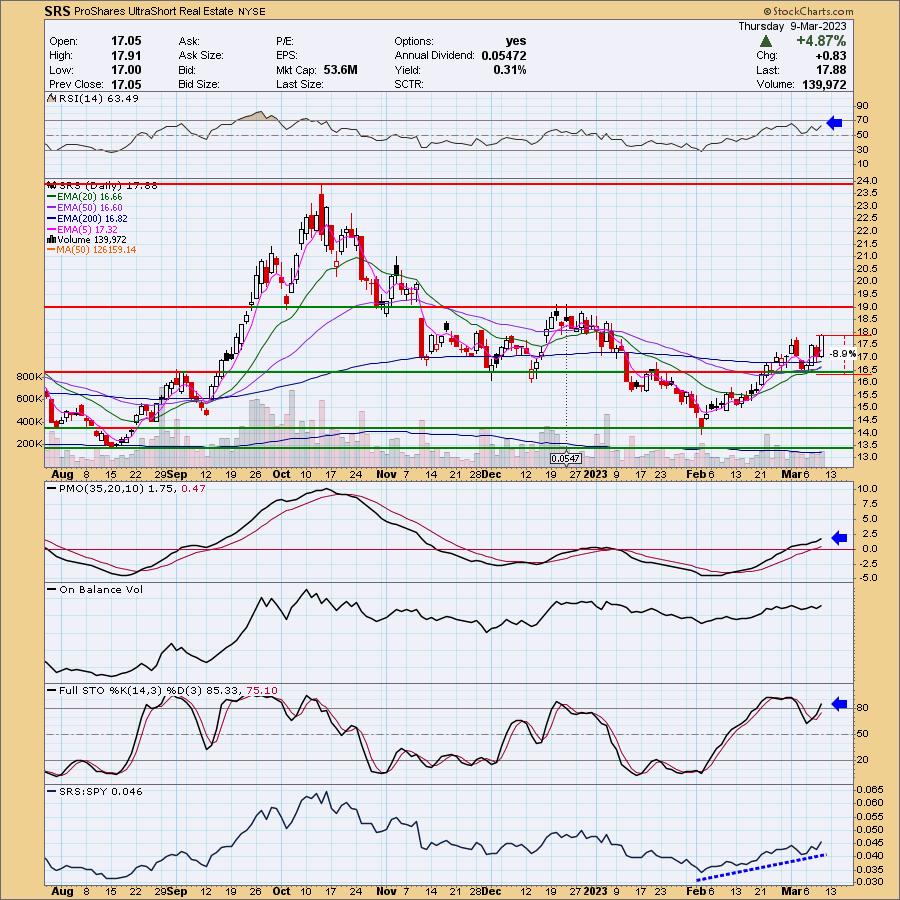
SRS is down -0.11% in after hours trading. This is a hedge so a large position isn't a good idea, but it can protect you if the market takes a downturn. I like the chart as Real Estate (XLRE) has been showing significant weakness and weak participation. The indicators are quite positive. The RSI is positive and the PMO is accelerating its rise. It is above the zero line and not overbought. Stochastics turned back up in positive territory and are now above 80 where we want them. Relative strength has been excellent against the market. The stop must be deep as it is a 2x inverse. An 8.9% stop is equivalent to a 4.5% stop on a short of XLRE and that is pretty thin. Fortunately we have a support level that we can set the stop beneath and it equals 8.9% or around $16.28.
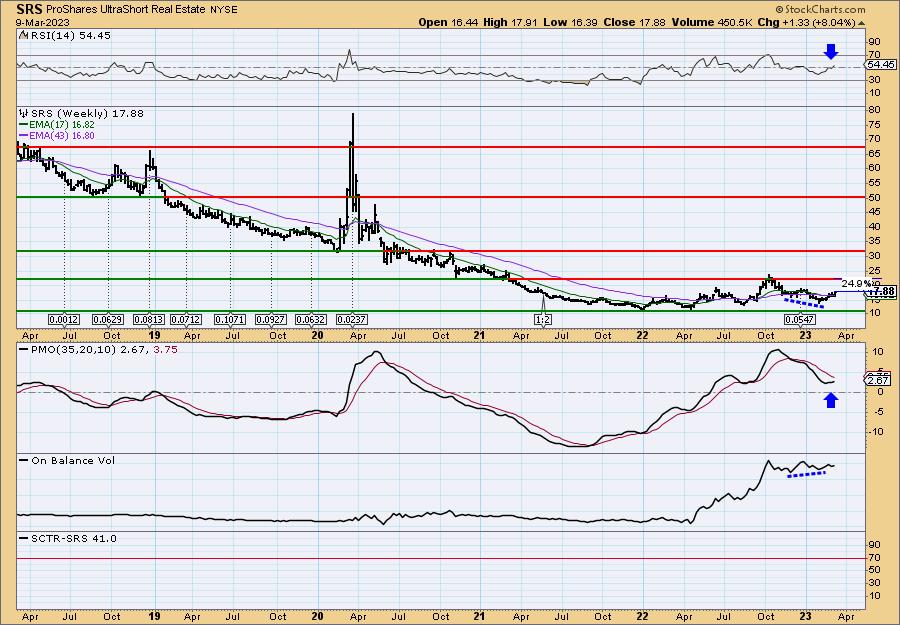
The weekly RSI has moved into positive territory and the weekly PMO is rising again, bottoming just above the zero line. I see a slight positive divergence with the OBV which suggests an extended rally ahead. Should it reach overhead resistance it would be a 24.9% gain.
Toro Co. (TTC)
EARNINGS: 03/09/2023 (BMO) ** REPORTED THIS MORNING **
The Toro Co. is in the business of designing, manufacturing, marketing, and selling professional turf maintenance equipment and services. It operates through the following segments: Professional and Residential. The Professional segment consists of turf and landscape equipment, rental, specialty, and underground construction equipment, snow & ice management equipment, and irrigation and lighting products. The Residential segment includes walk power mowers, zero-turn riding mowers, snow throwers, replacement parts, and home solutions products, including grass trimmers, hedge trimmers, leaf blowers, blower-vacuums, chainsaws, string trimmers, and underground, hose, and hose-end retail irrigation products sold in Australia and New Zealand. The company was founded by John Samuel Clapper and Henry Clay McCartney on July 10, 1914, and is headquartered in Bloomington, MN.
Predefined Scans Triggered: Moved Above Upper Bollinger Band, Stocks in a New Uptrend (Aroon), Moved Above Upper Price Channel and Rising Three Methods.
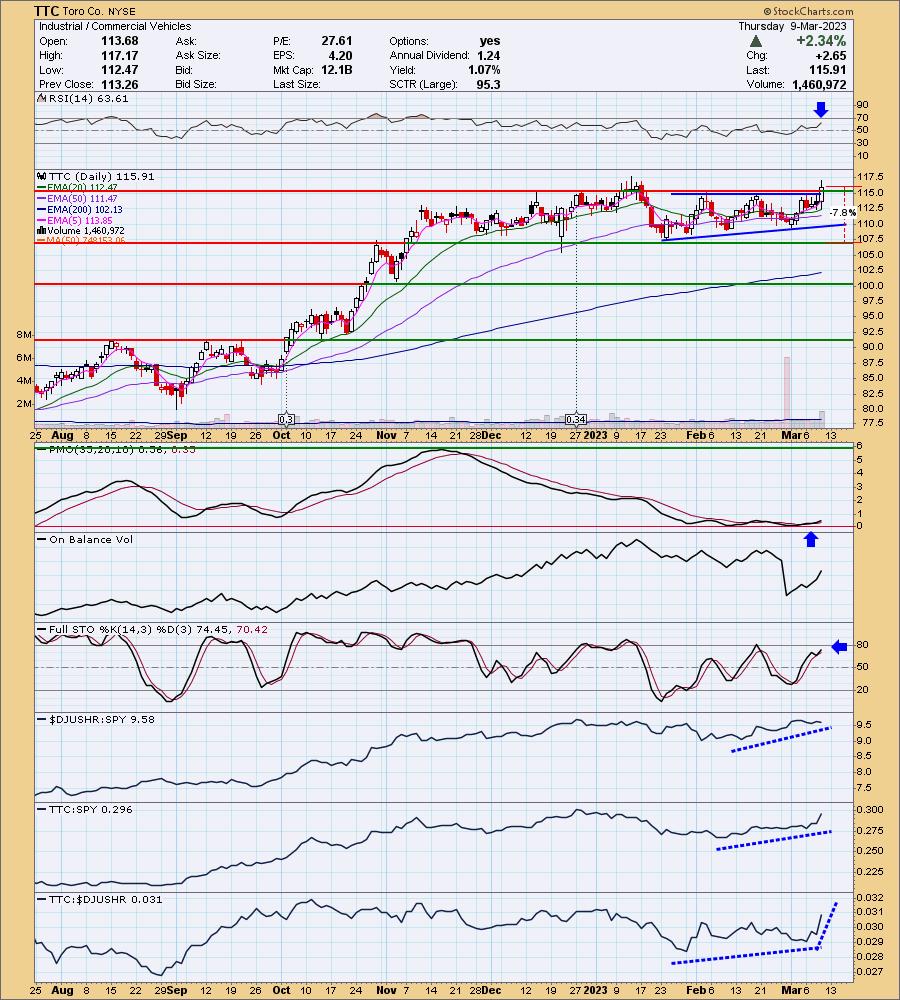
TTC is up +0.08% in after hours trading. Today it had a nice rally on earnings. The rally confirmed a bullish ascending triangle. The RSI is positive and the PMO just had a crossover BUY signal just above the zero line. Stochastics are rising and should reach above 80 soon. Relative strength looks healthy for the group and is really improving for TTC. The stop is set below support at 7.8% or $106.86.
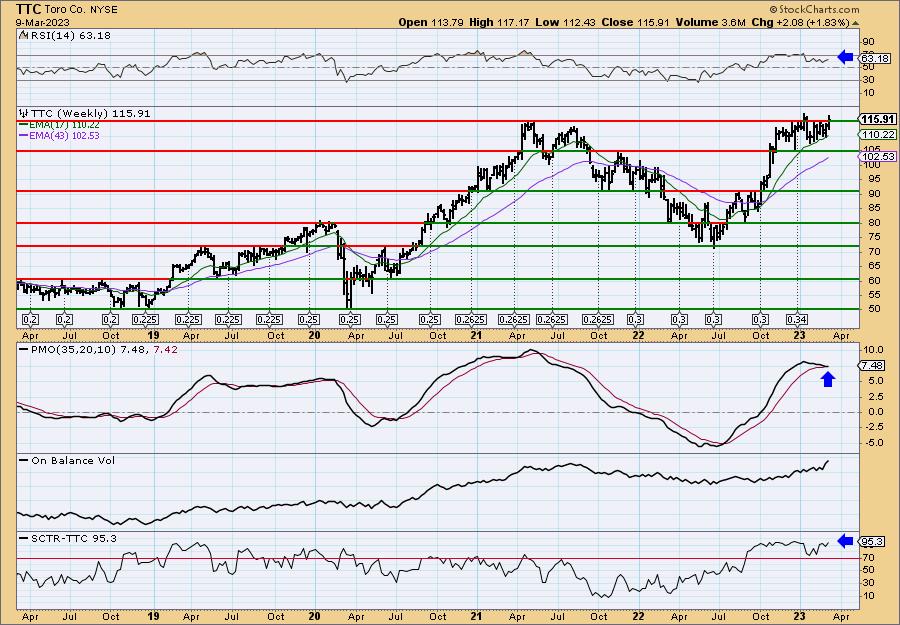
This breakout is taking price to new all-time highs. The weekly RSI is firmly positive. The weekly PMO is concerning as it prepares for a crossover SELL signal in overbought territory. We saw something similar in 2021 where the weekly PMO kissed the signal line. Price was able to continue higher. In this current case, the weekly RSI is not overbought which I believe offers a slight bullish bias. The SCTR is far strong than it was last time as well. I think the weekly PMO will avoid a SELL signal and move even higher. Still, consider this a short-term trade until the weekly PMO turns up. Given it is at all-time highs, consider an upside target of about 17% or $135.61.
Don't forget, on Thursdays I look at reader-requested symbols, click HERE to send me an email. I read every email I receive and try to answer them all!
Current Market Outlook:
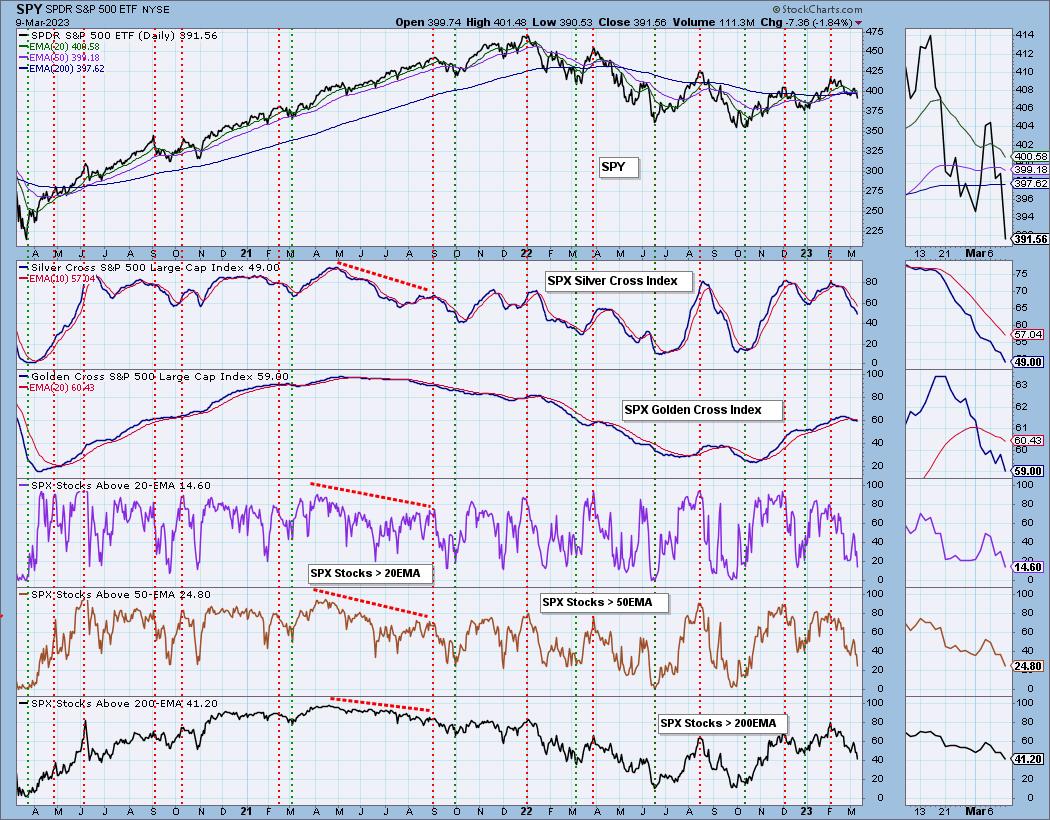
Market Environment: It is important to consider the odds for success by assessing the market tides. The following chart uses different methodologies for objectively showing the depth and trend of participation for intermediate- and long-term time frames.
- The Silver Cross Index (SCI) shows the percentage of SPX stocks on IT Trend Model BUY signals (20-EMA > 50-EMA)
- The Golden Cross Index (GCI) shows the percentage of SPX stocks on LT Trend Model BUY signals (50-EMA > 200-EMA)
Don't forget that as a "Diamonds" member, you have access to our GCI/SCI curated ChartList on DecisionPoint.com. You'll find it under "Members Only" links on the left side on the Blogs and Links Page.
Here is the current chart:
Full Disclosure: I am 25% long, 0% short.
I'm required to disclose if I currently own a stock I mention and/or may buy/short it within the next 72 hours.
"Technical Analysis is a windsock, not a crystal ball." - Carl Swenlin
(c) Copyright 2023 DecisionPoint.com
Watch the latest episode of DecisionPoint Trading Room with Carl & Erin Swenlin on Mondays 7:00p EST or on the DecisionPoint playlist on the StockCharts TV YouTube channel here!
NOTE: The stocks reported herein are from mechanical trading model scans that are based upon moving average relationships, momentum and volume. DecisionPoint analysis is then applied to get five selections from the scans. The selections given should prompt readers to do a chart review using their own analysis process. This letter is not a call for a specific action to buy, sell or short any of the stocks provided. There are NO sure things or guaranteed returns on the daily selection of "Diamonds in the Rough."
Regarding BUY/SELL Signals: The signal status reported herein is based upon mechanical trading model signals and crossovers. They define the implied bias of the price index/stock based upon moving average relationships and momentum, but they do not necessarily call for a specific action. They are information flags that should prompt chart review. Further, they do not call for continuous buying or selling during the life of the signal. For example, a BUY signal will probably (but not necessarily) return the best results if action is taken soon after the signal is generated. Additional opportunities for buying may be found as price zigzags higher, but the trader must look for optimum entry points. Conversely, exit points to preserve gains (or minimize losses) may be evident before the model mechanically closes the signal.
Helpful DecisionPoint Links:
DecisionPoint Shared ChartList and DecisionPoint Chart Gallery
Price Momentum Oscillator (PMO)
Swenlin Trading Oscillators (STO-B and STO-V)
For more links, go to DecisionPoint.com