
Reader requests were thin today, but one theme was certainly visible, Semiconductors and Home Builders. These groups have been consistently outperforming the market overall. I am covering one of each today.
Jason is my cousin and he is always interested in what Coupang (CPNG) is doing. Since requests came in thin, I ran a few scans and his favorite stock landed in the results. I figured it was a good time to cover my cousin's request.
The last stock is in the Software industry group, Coinbase (COIN). It had a terrible 14%+ decline today so I thought I would cover this request to give this subscriber some information on its current setup. It isn't one I would usually cover, but despite its big decline, there is hope for it.
Don't forget to sign up for tomorrow's Diamond Mine trading room! I look forward to seeing you then!
ANNOUNCEMENT: The DP Diamonds Recap will be published on Sunday rather than tomorrow. I'm headed to wine country after the Diamond Mine tomorrow and plan to enjoy some time away from the market.
Good Luck & Good Trading,
Erin
Today's "Diamonds in the Rough": COIN, CPNG, MDC and MRVL.
Other requests: K, CPB, AMKR, DOX, KBH, LSCC, PGTI.

RECORDING LINK (3/17/2023):
Topic: DecisionPoint Diamond Mine (3/17/2023) LIVE Trading Room
Passcode: March#17th
REGISTRATION for 3/24/2023:
When: Mar 24, 2023 09:00 AM Pacific Time (US and Canada)
Topic: DecisionPoint Diamond Mine (3/24/2023) LIVE Trading Room
Register in advance for this webinar HERE.
After registering, you will receive a confirmation email containing information about joining the webinar.

Here is the last recording (3/20):
Welcome to DecisionPoint Diamonds, wherein I highlight ten "Diamonds in the Rough" per week. These are selected from the results of my DecisionPoint Scans which search for stocks that could benefit from the trend and condition of the market. Remember, these are not recommendations to buy or sell, but are the most interesting of the stocks that surfaced in my scans. My objective is to save you the work of the initial, tedious culling process, but you need to apply your own analysis to see if these stocks pique your interest as well. There are no guaranteed winners here!
"Predefined Scans Triggered" are taken from StockCharts.com using the "Symbol Summary" option instead of a "SharpChart" on the workbench.
Stop levels are all rounded down.
Coinbase Global Inc. (COIN)
EARNINGS: 05/09/2023 (AMC)
Coinbase Global, Inc. engages in technology and financial infrastructure products and services. It offers crypto-powered technologies including self-custody wallets, decentralized apps and services, and open community engagement platforms. The company was founded by Brian Armstrong in 2012 and is headquartered in San Francisco, CA.
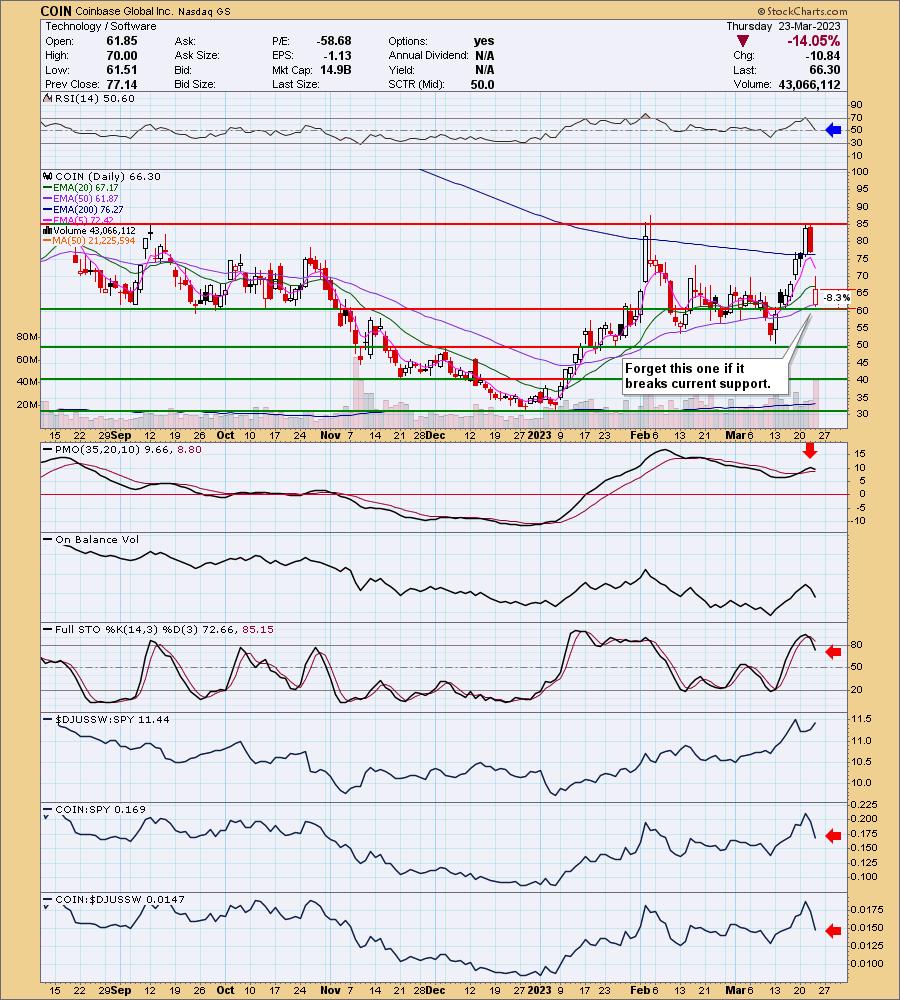
Predefined Scans Triggered: Gap Downs, Elder Bar Turned Red, Hollow Red Candles, P&F High Pole and P&F Long Tail Down.
COIN is up +0.15% in after hours trading. The StockCharts predefined scans that triggered (listed above) were nearly all bearish. A Hollow Red Candle is a bullish result. Basically, price came down hit strong support and bounced to close higher than the open, but unfortunately lower than the day before. This decline took the PMO down and basically destroyed relative strength. Stochastics and the RSI are in positive territory but declining. The main reason I included it was the hollow red candlestick and the strong support level that held. If you're not in this one, you have the luxury of waiting to see if it will retest current support. If you own it, you have to hold your nose or opt out and jump back in if it continues to hold support. The stop is set at 8.3% (below that support level) at $60.79.
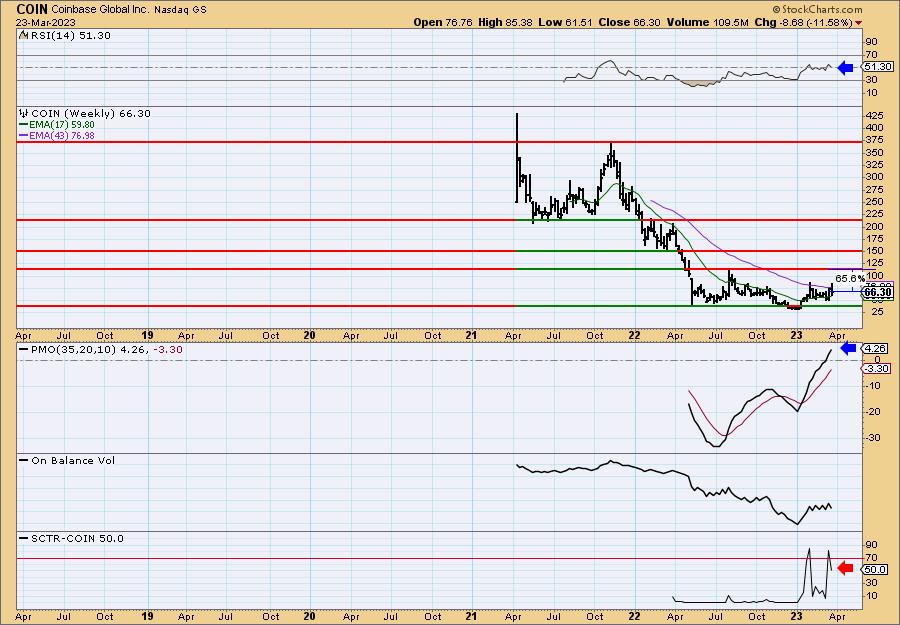
The weekly chart is still fairly bullish. The weekly RSI is positive and the weekly PMO is rising after overcoming the zero line. The SCTR lost quite a few percentage points on this week's decline, but it could recover quickly on just about any upside reversal. Remember, we want to see the SCTR in the "hot zone"* above 70. Upside potential is mouth-watering, but as we can see this one is volatile.
*We call it the "hot zone" because it implies that the stock/ETF is in the top 30% of its "universe" (large-, mid-, small-caps and ETFs) as far as trend and condition, particularly in the intermediate and long terms.
Coupang Inc. (CPNG)
EARNINGS: 05/10/2023 (AMC)
Coupang, Inc. engages in operating an e-commerce platform. It operates through the Product Commerce and Growth Initiatives segments. The Product Commerce segment provides core retail and marketplace offerings and Rocket Fresh, as well as advertising products associated with these offerings. The Growth Initiatives segment includes nascent offerings and services, including Coupang Eats, Coupang Play, international and fintech initiatives. The company was founded in 2010 and is headquartered in Seattle, WA.
Predefined Scans Triggered: None.
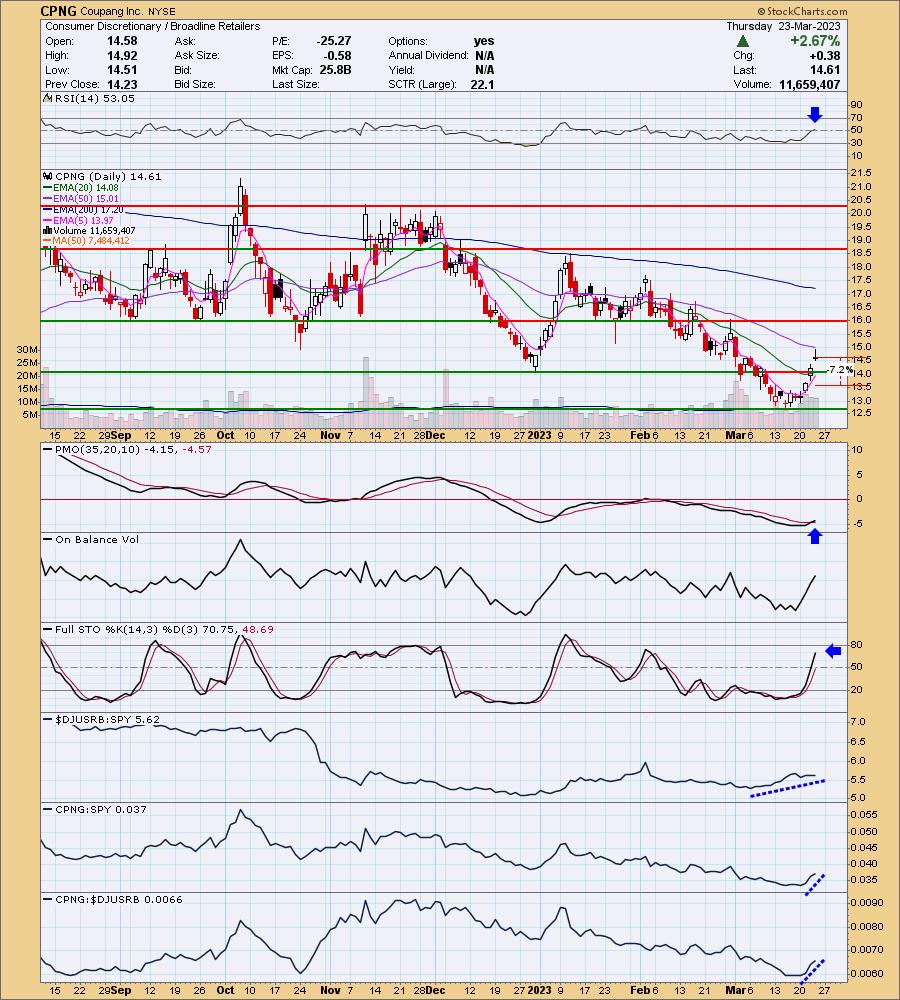
CPNG is up +0.07% in after hours trading. Price has been rallying this week and it has definitely changed the technical picture. The RSI is now in positive territory above net neutral (50). The PMO just triggered a crossover BUY signal and Stochastics look great as they rise strongly in positive territory. The industry group is performing slightly better than the SPY. CPNG started to reverse its weak performance against the group and SPY almost two weeks ago. This looks like a solid rally. I've set the stop about halfway between the last low and December low around 7.2% or $13.55.
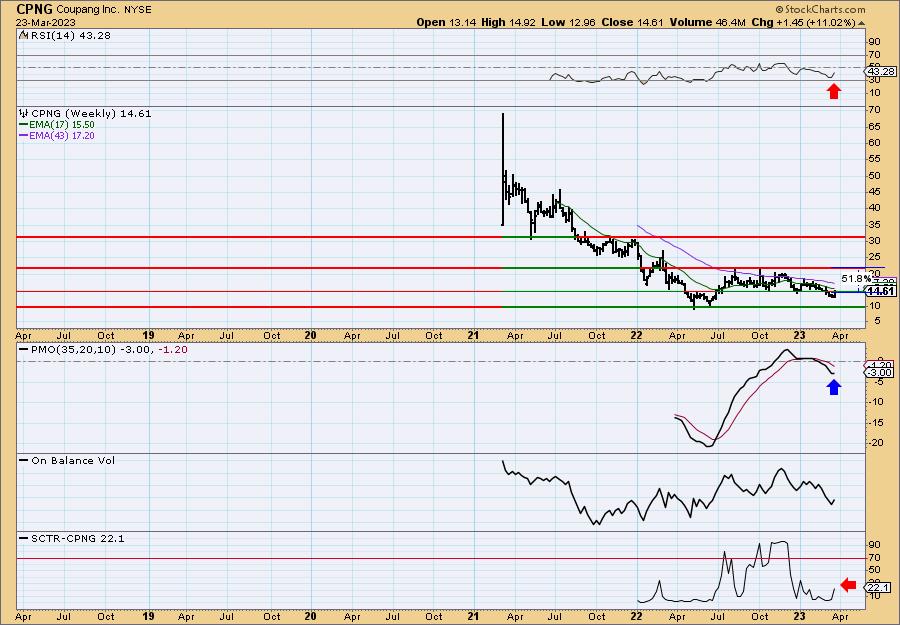
CPNG is about to recapture its prior trading range. The weekly RSI is negative, but the weekly PMO is turning back up. The SCTR isn't good at 22.1%, but given how beat down this stock has been, we shouldn't be surprised. If it can get back to its prior trading range that would be an over 51% gain.
MDC Holdings, Inc. (MDC)
EARNINGS: 04/27/2023 (BMO)
M.D.C. Holdings, Inc. engages in proving homebuilding and financial services. It operates through the following business segments: West, Mountain, and East. The West segment includes operations in Arizona, California, Nevada, New Mexico, Oregon, Texas, and Washington. The Mountain segment refers to the operations in Colorado, Idaho, and Utah. The East segment operates in Alabama, Florida, Maryland, Pennsylvania, Tennessee, and Virginia. The company was founded by Larry A. Mizel in 1972 and is headquartered in Denver, CO.
Predefined Scans Triggered: Filled Black Candlesticks.
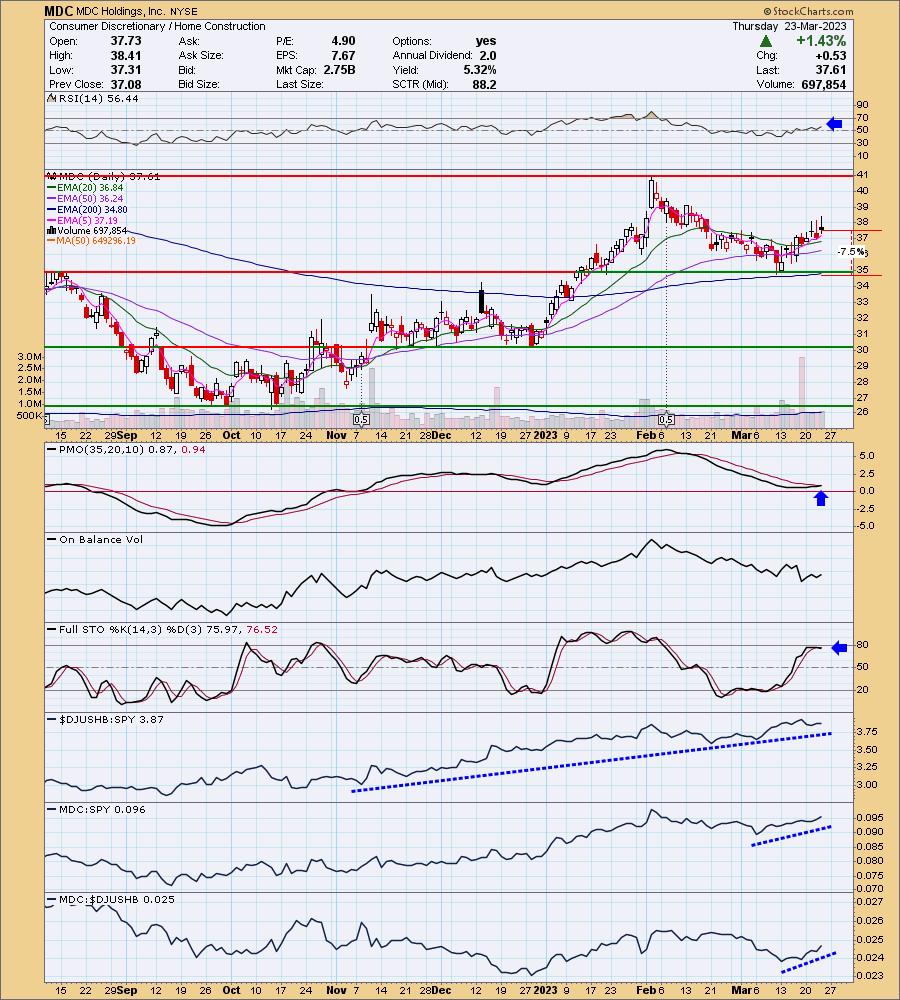
MDC is unchanged in after hours trading. Unfortunately, the only predefined scan triggered was a bearish one, but I do like the chart. There is a bearish filled black candlestick that would imply price will move lower tomorrow. It's a one-day pattern so it doesn't necessarily mean a decline past that. Home Builders have seen strength and we presented a few not too long ago. This subscriber requested this and KB Homes (KBH). Both look great, I just liked the way MDC bottomed above the November/December highs and 200-day EMA and it didn't have an over 7.5% gain today. I would look for a digestion period on KBH.
The RSI is positive and rising. The PMO just triggered a crossover BUY signal today. Stochastics aren't above 80, but they are in very positive territory just below 80. The stop is set below support at 7.5% or $34.78.
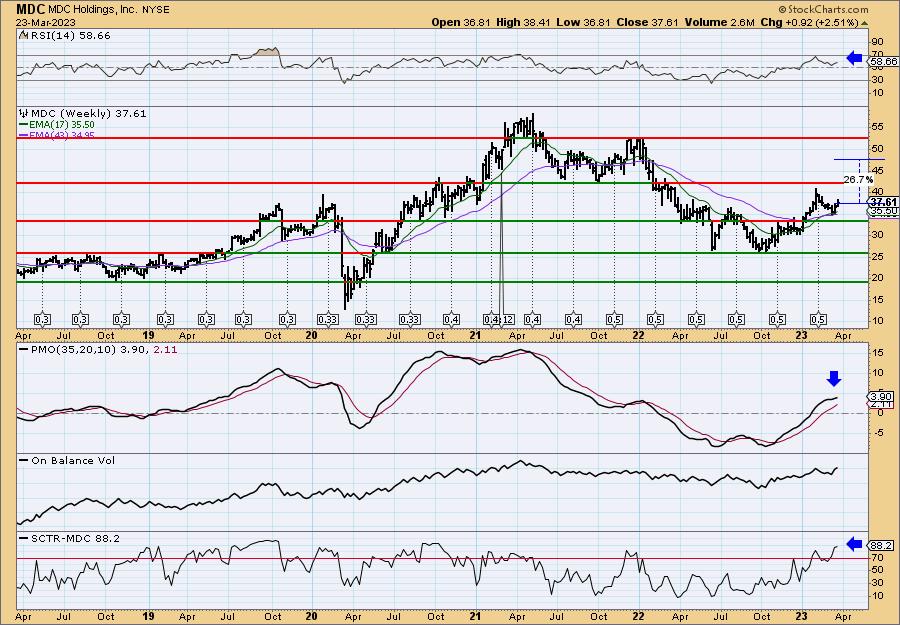
I really like the weekly chart. The current bounce comes just above strong support and that suggests more upside. The weekly RSI is positive and the weekly PMO is accelerating its rise. The OBV is confirming the rally and the SCTR is an excellent 88.2%. Upside potential is set midway between the next two resistance levels.
Marvell Technology Inc (MRVL)
EARNINGS: 05/25/2023 (AMC)
Marvell Technology, Inc. engages in the provision of data infrastructure semiconductor solutions. It offers compute, networking, storage, and custom solutions. The firm designs, develops, and sells integrated circuits. The company was founded by Wei Li Dai, Pantas Sutardja, and Sehat Sutardja in 1995 and is headquartered in Wilmington, DE.
Predefined Scans Triggered: Elder Bar Turned Green, Bullish MACD Crossovers, P&F Low Pole and Entered Ichimoku Cloud.
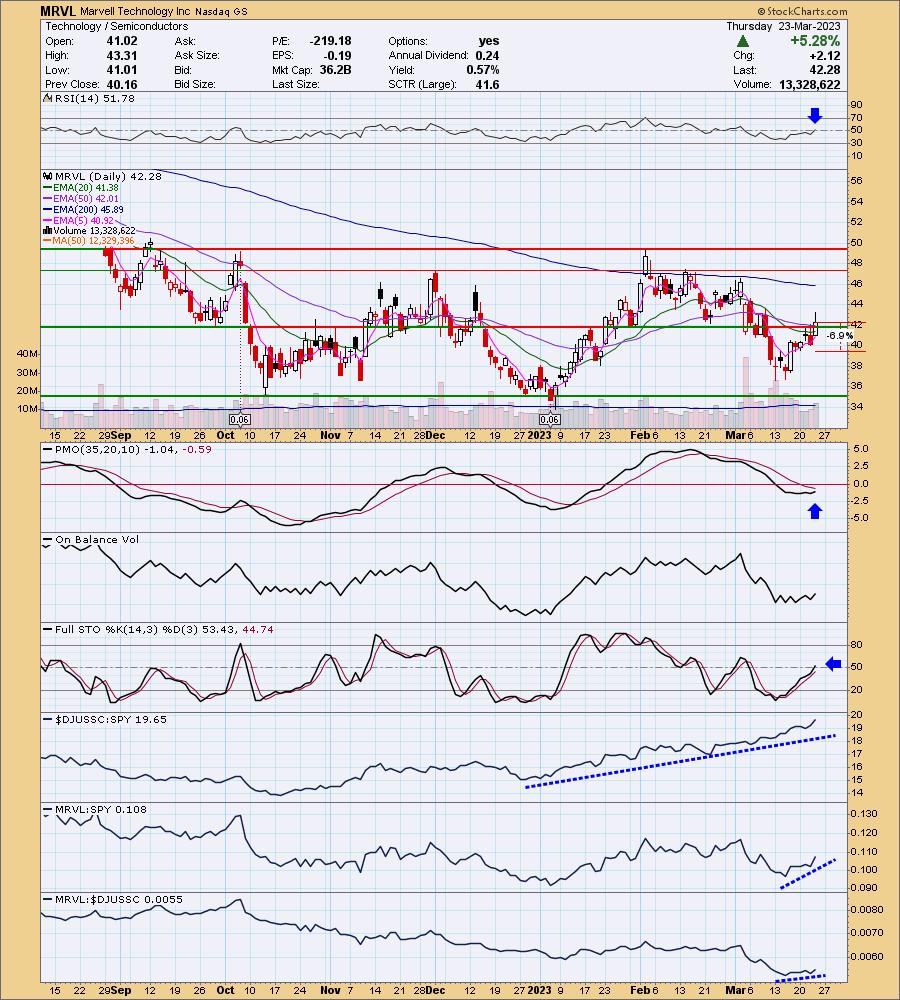
MRVL is down -0.92% in after hours trading. MRVL had a great day with a breakout above resistance at $42 and both the 20/50-day EMAs. The RSI just hit positive territory and the PMO is turning up. Stochastics just moved above 50. Relative strength of Semiconductors has been steadily increasing all year long. MRVL hasn't been the best performer in the group, but it is starting to show new strength and it is doing quite well against the SPY. The stop is set below this week's low at 6.9% around $39.36.
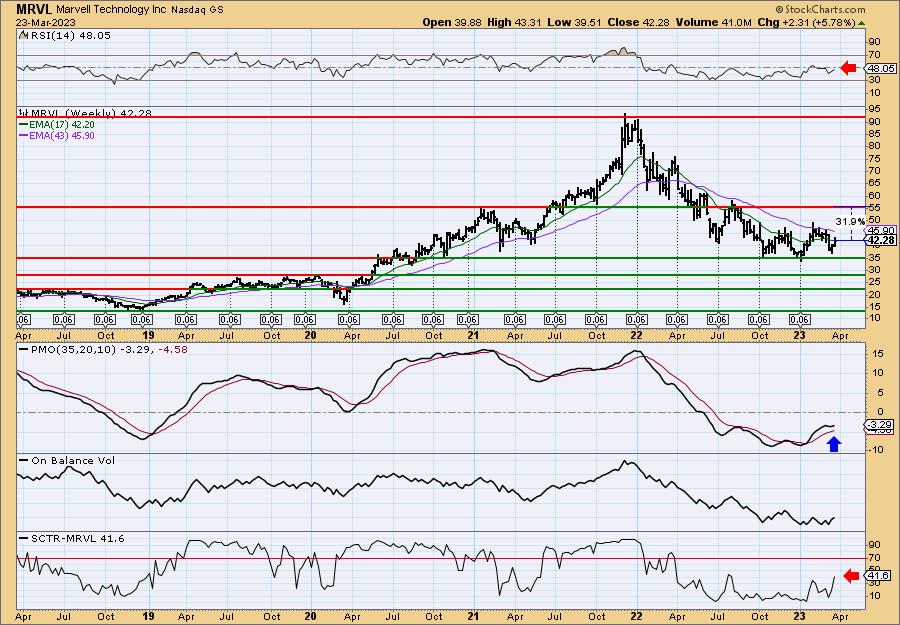
I didn't annotate it as it just became apparent to me, there is a reverse head and shoulders pattern on the weekly chart. The weekly RSI is rising, but is still in negative territory. The weekly PMO looks excellent as it has bottomed above the signal line which is especially bullish. Upside potential if it reaches the early 2021 price high is almost 32%.
Don't forget, on Thursdays I look at reader-requested symbols, click HERE to send me an email. I read every email I receive and try to answer them all!
Current Market Outlook:
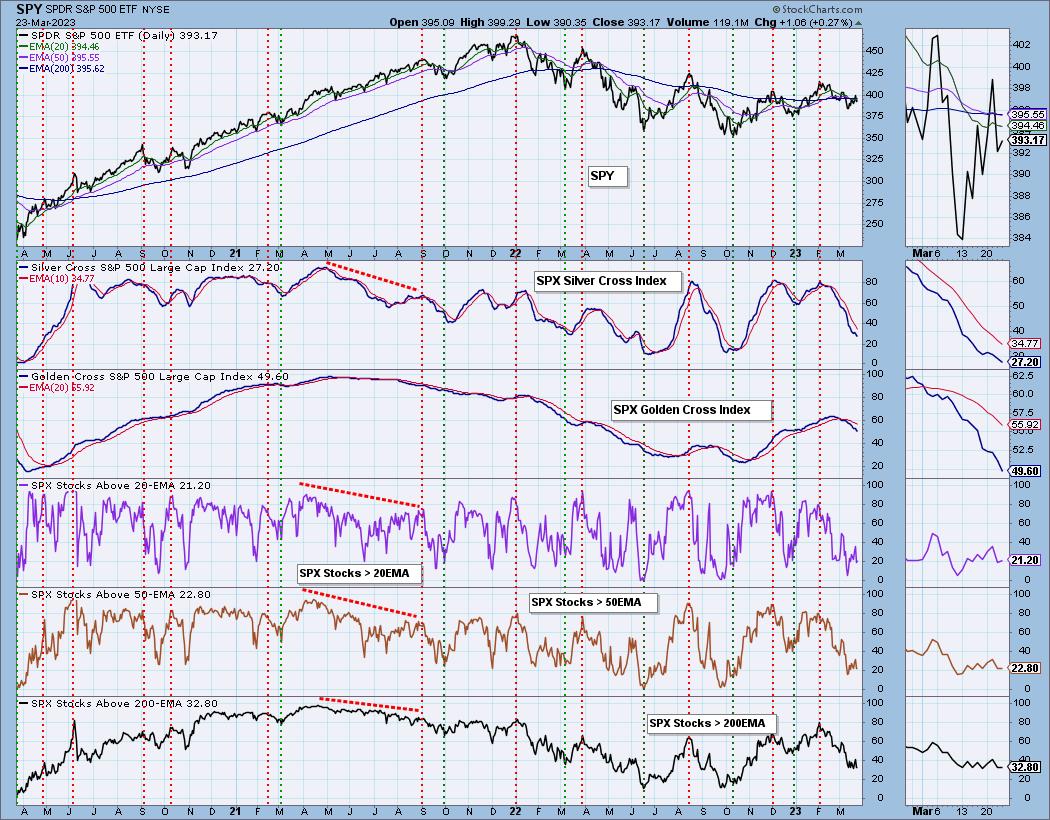
Market Environment: It is important to consider the odds for success by assessing the market tides. The following chart uses different methodologies for objectively showing the depth and trend of participation for intermediate- and long-term time frames.
- The Silver Cross Index (SCI) shows the percentage of SPX stocks on IT Trend Model BUY signals (20-EMA > 50-EMA)
- The Golden Cross Index (GCI) shows the percentage of SPX stocks on LT Trend Model BUY signals (50-EMA > 200-EMA)
Don't forget that as a "Diamonds" member, you have access to our GCI/SCI curated ChartList on DecisionPoint.com. You'll find it under "Members Only" links on the left side on the Blogs and Links Page.
Here is the current chart:
Full Disclosure: I am 15% long, 2% short.
I'm required to disclose if I currently own a stock I mention and/or may buy/short it within the next 72 hours.
"Technical Analysis is a windsock, not a crystal ball." - Carl Swenlin
(c) Copyright 2023 DecisionPoint.com
Watch the latest episode of DecisionPoint Trading Room with Carl & Erin Swenlin on Mondays 7:00p EST or on the DecisionPoint playlist on the StockCharts TV YouTube channel here!
NOTE: The stocks reported herein are from mechanical trading model scans that are based upon moving average relationships, momentum and volume. DecisionPoint analysis is then applied to get five selections from the scans. The selections given should prompt readers to do a chart review using their own analysis process. This letter is not a call for a specific action to buy, sell or short any of the stocks provided. There are NO sure things or guaranteed returns on the daily selection of "Diamonds in the Rough."
Regarding BUY/SELL Signals: The signal status reported herein is based upon mechanical trading model signals and crossovers. They define the implied bias of the price index/stock based upon moving average relationships and momentum, but they do not necessarily call for a specific action. They are information flags that should prompt chart review. Further, they do not call for continuous buying or selling during the life of the signal. For example, a BUY signal will probably (but not necessarily) return the best results if action is taken soon after the signal is generated. Additional opportunities for buying may be found as price zigzags higher, but the trader must look for optimum entry points. Conversely, exit points to preserve gains (or minimize losses) may be evident before the model mechanically closes the signal.
Helpful DecisionPoint Links:
DecisionPoint Shared ChartList and DecisionPoint Chart Gallery
Price Momentum Oscillator (PMO)
Swenlin Trading Oscillators (STO-B and STO-V)
For more links, go to DecisionPoint.com