
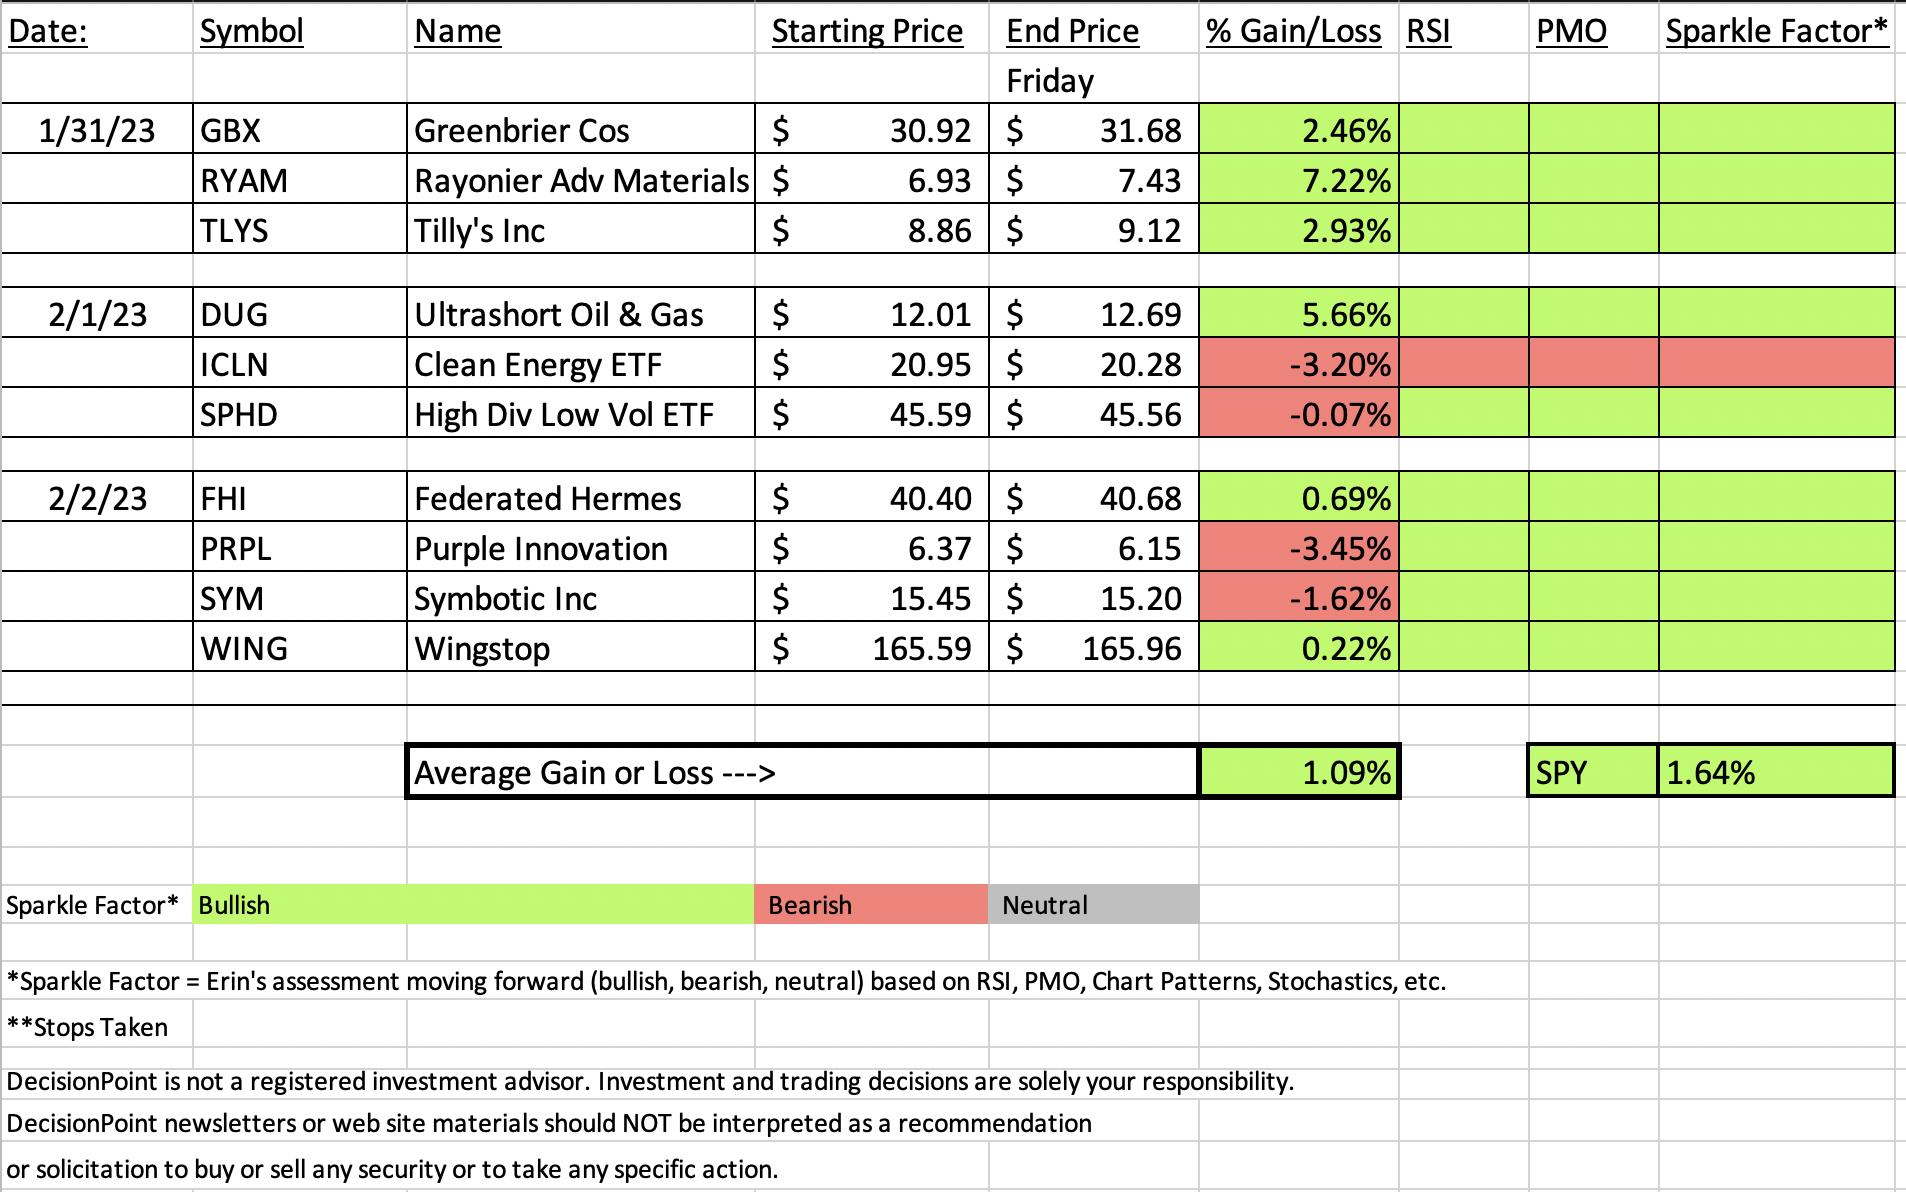
As I reviewed this week's spreadsheet and filled in which had rising PMOs and positive RSIs, I only found one of this week's "Diamonds in the Rough" turning into coal rather than sparkle. It was a pick that I debated mainly because I had given a similar pick last week and while I felt good about the chart, I knew that one week of the run was over. Still, we always say that winners can keep on winning. Not the case for this ETF.
All others look good moving forward, including the biggest loser which turned out to be yesterday's pick of Purple (PRPL). Rather than go over PRPL, I will cover the Clean Energy ETF (ICLN) as this week's "Dud". PRPL is still above support on this pullback and unlike ICLN, the PMO is still rising.
The biggest winner changed from this morning. Originally Symbotic (SYM) was killing its competition but fell to finish down over 1.6%. Full disclosure: I own this one. Not the best finish, but the chart hasn't broken down. The actual "Darling" was one of the stocks I tried to get in, but I was too picky on my entry and missed out, Rayonier Advanced Materials (RYAM). I may enter it anyway next week.
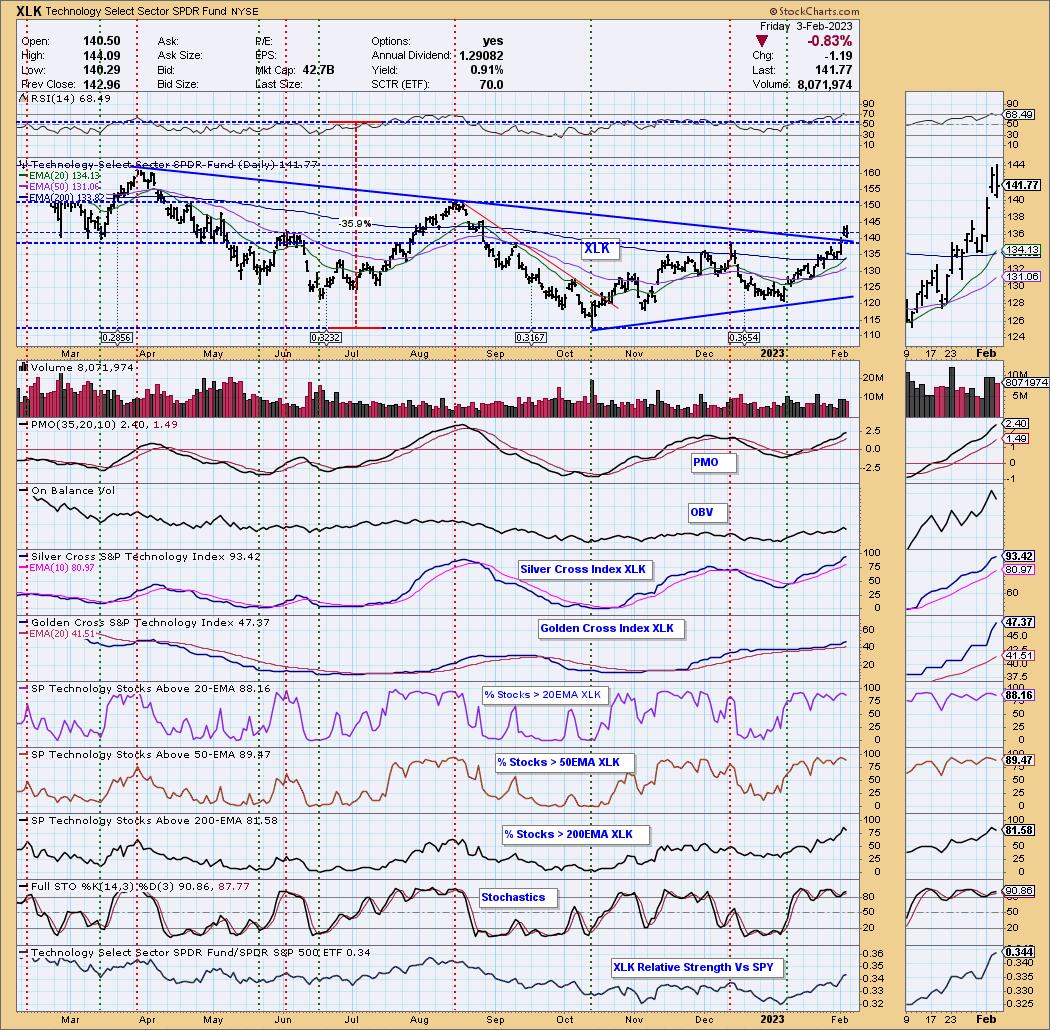
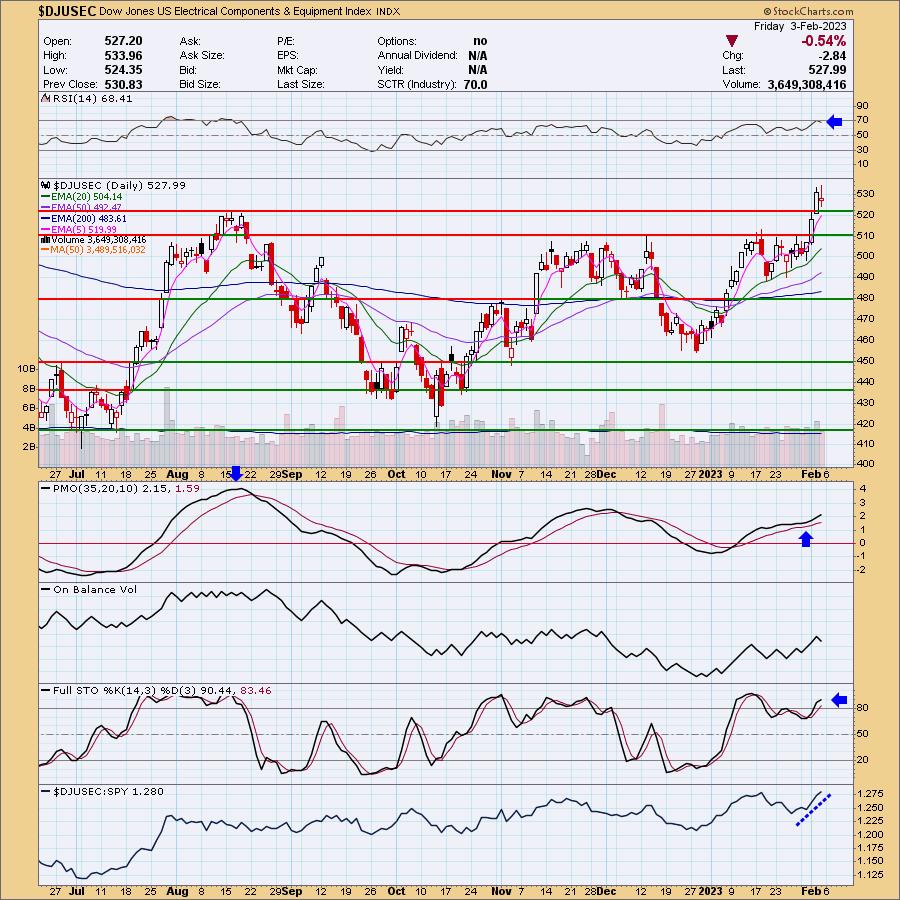
This week's Sector to Watch is different from what I picked this morning. Industrials (XLI) were piquing my interest this morning, but all said and done, Technology (XLK) looks the best going into next week. I had originally gone with Airlines (JETS) in the Industrial sector, but an after market review had me change my mind to a much better industry group that happens to be in the Tech sector, Electrical Components & Equipment ($DJUSEC). Unfortunately I couldn't find an ETF that aligns with this industry group, but I do have a few stocks within, BDC and VSH.
Have a great weekend!
Good Luck & Good Trading,
Erin

RECORDING LINK (2/3/2023):
Topic: DecisionPoint Diamond Mine (2/3/2023) LIVE Trading Room
Passcode: February#3
REGISTRATION for 2/10/2023:
When: Feb 10, 2023 09:00 AM Pacific Time (US and Canada)
Topic: DecisionPoint Diamond Mine (2/10/2023) LIVE Trading Room
Register in advance for this webinar HERE
After registering, you will receive a confirmation email containing information about joining the webinar.

Our latest DecisionPoint Trading Room recording (1/30/2023):
A few items about the spreadsheet: I've put on the spreadsheet whether the RSI is positive (green) or negative (red). The PMO column tells you if it is rising (green) or falling (red). Finally I've added my own "Sparkle Factor" that gives you my assessment going forward, bullish (green), bearish (red) or neutral (gray). The Sparkle Factor is basically my thoughts on whether I expect it to rise or fall. A neutral means it could really go either way so it could be added to a watch list. If you're in a stock I consider "neutral" going forward, the ball is in your court.
Darling:
Rayonier Advanced Materials Inc. (RYAM)
EARNINGS: 02/28/2023 (AMC)
Rayonier Advanced Materials, Inc. engages in the production and sale of cellulose products, which is a natural polymer commonly used in the production of cellphones and computer screens, filters, and pharmaceuticals. It operates through the following segments: High Purity Cellulose, Paperboard, High-Yield Pulp, and Corporate. The High Purity Cellulose segment manufactures and markets high purity cellulose, which is sold as either cellulose specialties or commodity products in U.S., Canada, and France. The Paperboard segment is composed of paperboard, which is used for printing documents, brochures, promotional materials, packaging, paperback book or catalog covers, file folders, tags, and tickets. The High-Yield Pulp segment is involved in the production of pulp and newsprint in Canada. The Corporate segment consists of the senior management, accounting, information systems, human resources, treasury, tax, and legal administrative functions that provide support services to the operating business units. The company was founded in 1926 and is headquartered in Jacksonville, FL.
Predefined Scans Triggered: Elder Bar Turned Green and Bullish MACD Crossovers.
Below are the commentary and chart from Tuesday (1/31):
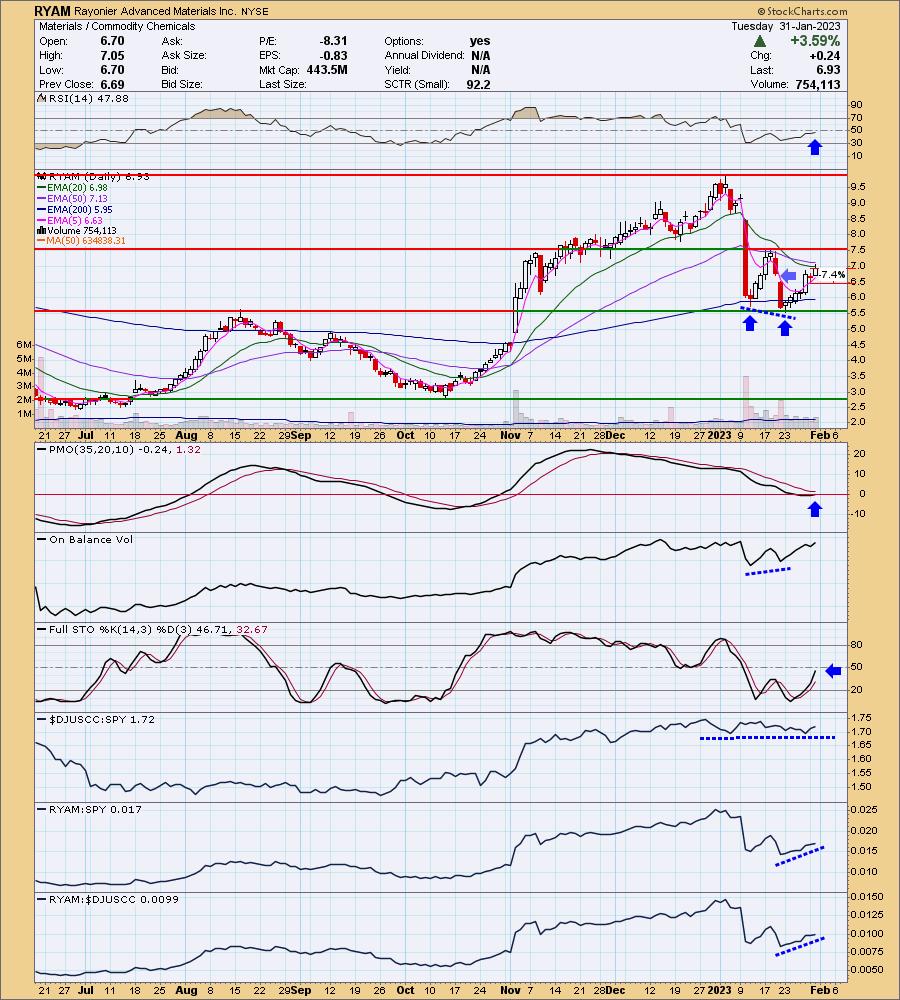
"RYAM is down -0.87% in after hours trading. This has a similar look to GBX, but it is a lower priced stock so upside potential is higher...of course, so is downside potential. Always position size wisely on low priced stocks. Here we have a double-bottom, but unlike GBX, it hasn't been confirmed with a breakout above the confirmation line at $7.50. The RSI is negative but rising. The PMO has just turned up. I also spotted a positive OBV divergence going into this rally. Stochastics are below net neutral (50), but are rising quickly. The group isn't that great relatively, but RYAM is increasing relative strength. The stop is set below the gap I pointed out with my light blue arrow around 7.4% or $6.41."
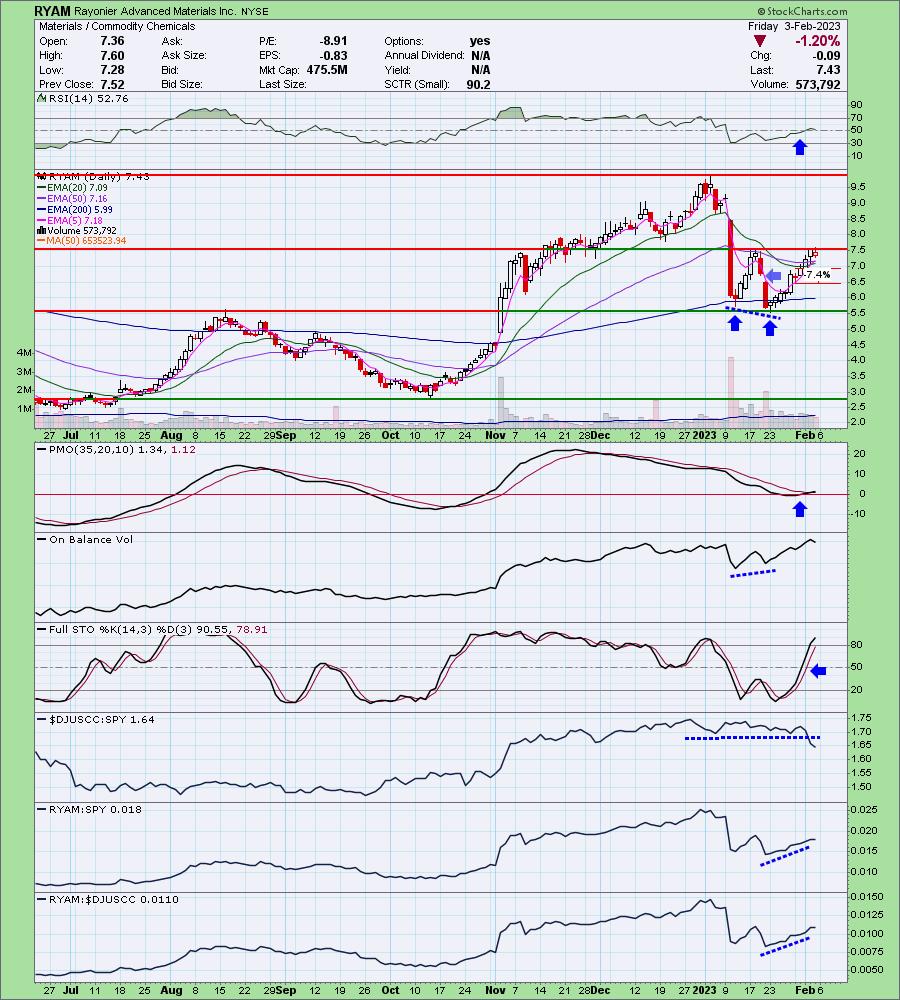
Here is today's chart:
It did fall today, but it does offer a new entry. I would like to see the breakout, but I might enter next week on a pullback if the PMO can stay rising. The set up is excellent with the double-bottom. I don't know why it got stung in early January, but it is making a comeback and based on the indicators it should continue higher.
Don't forget, on Thursdays I look at reader-requested symbols, so shoot me an email at erin@decisionpoint.com. I read every email I receive and try to answer them all!
Dud:
iShares Global Clean Energy ETF (ICLN)
EARNINGS: N/A
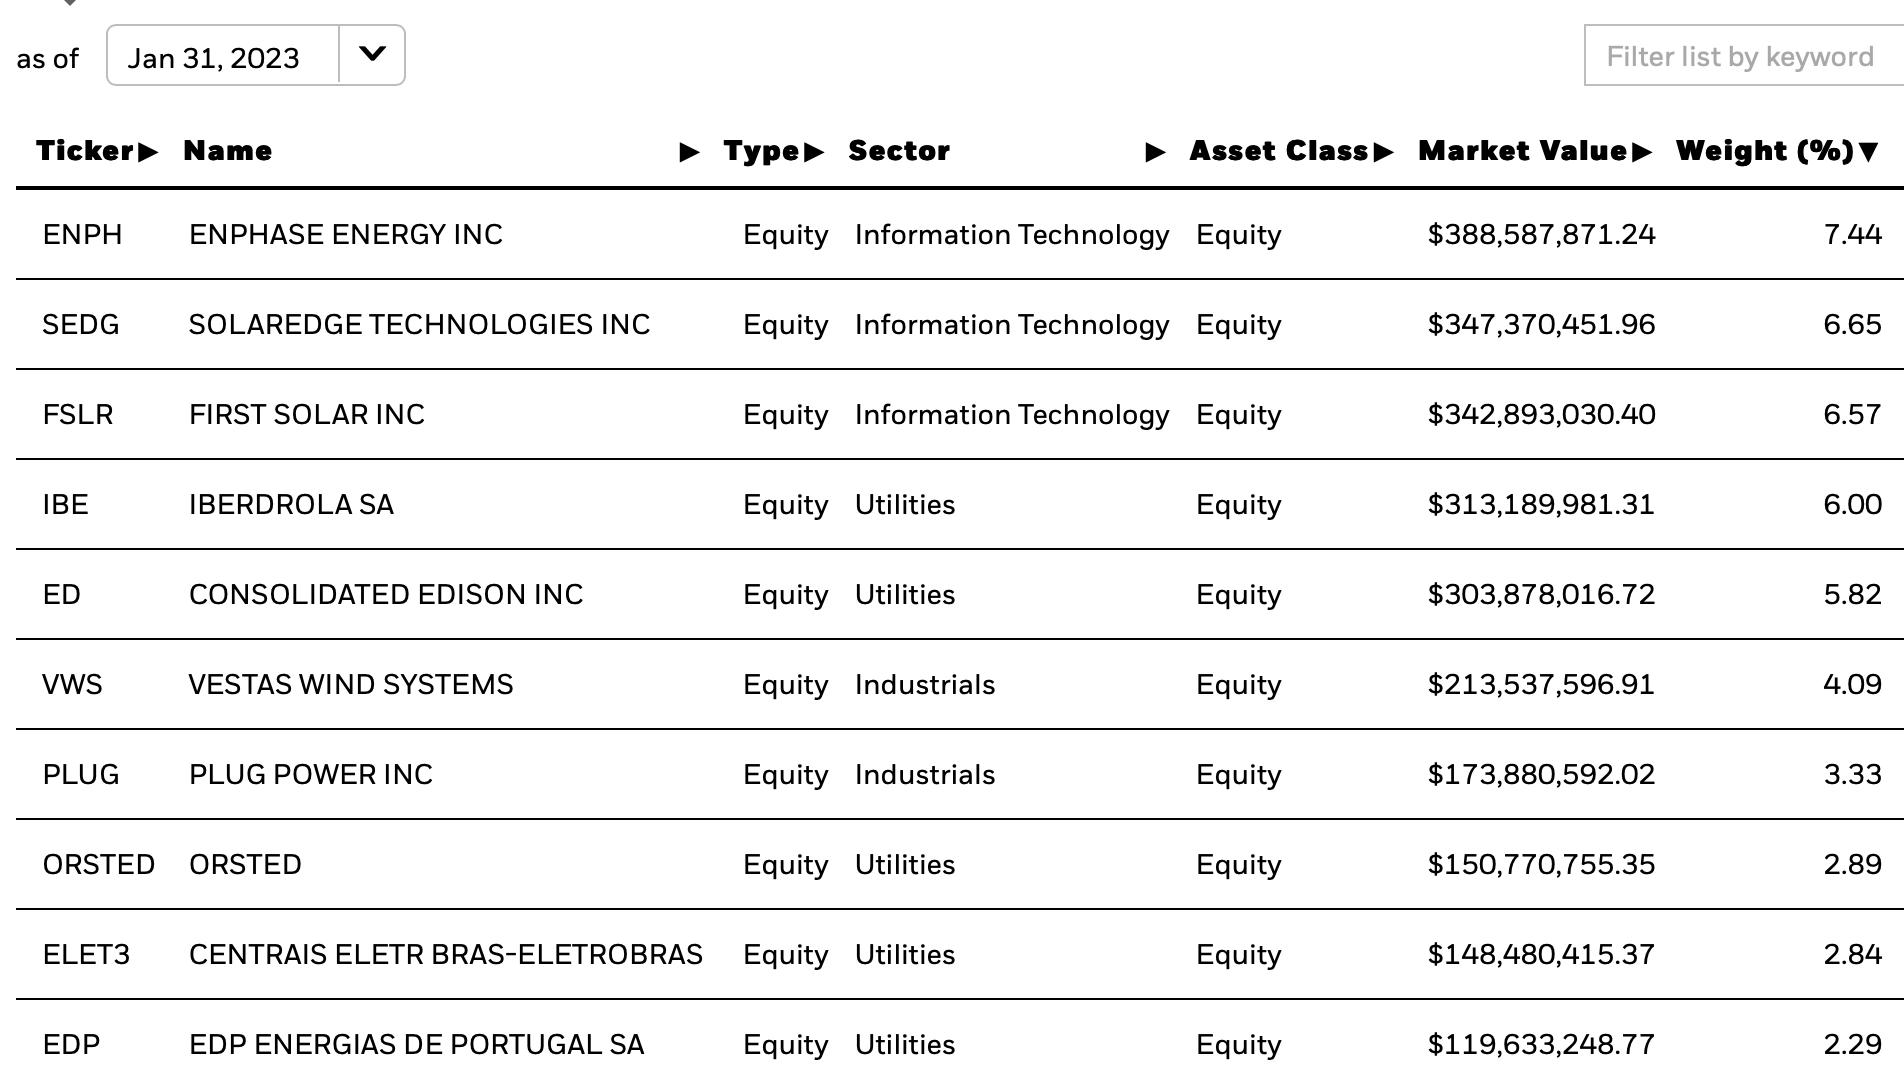
ICLN tracks a tiered index of global companies involved in clean energy businesses. Click HERE for more information.
Predefined Scans Triggered: Improving Chaikin Money Flow and Parabolic SAR Buy Signals.
Below are the commentary and chart from Wednesday (2/1):
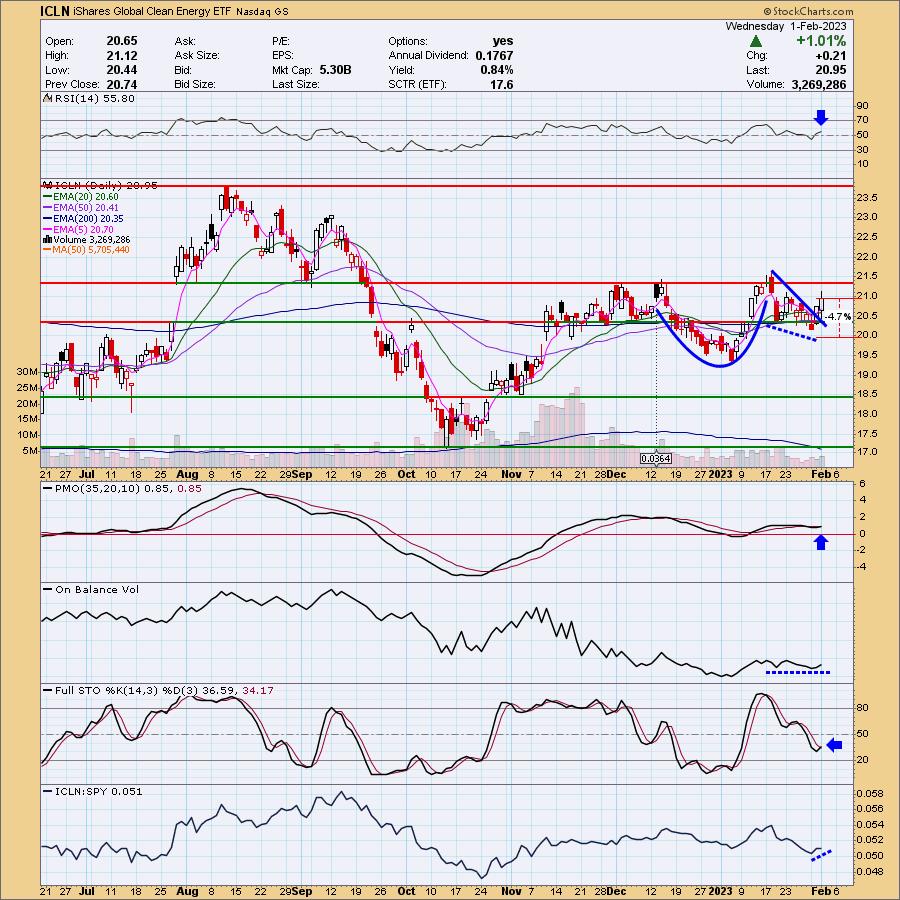
"ICLN is up +0.53% in after hours trading. Price bounced off support at key moving averages and late November/early December lows. This is a cup and handle looking pattern that would imply price will break above the rim of the cup. The handle also is a confirmed bullish falling wedge. The RSI is positive and rising. The PMO is in the process of generating a crossover BUY signal. Stochastics look a bit suspect as they are in a declining trend, but they did turn up. Relative strength is just now starting to improve. The OBV holds a mild positive divergence with price lows. The stop can be set tightly if you wish around 4.7% or $19.96."
Here is today's chart:
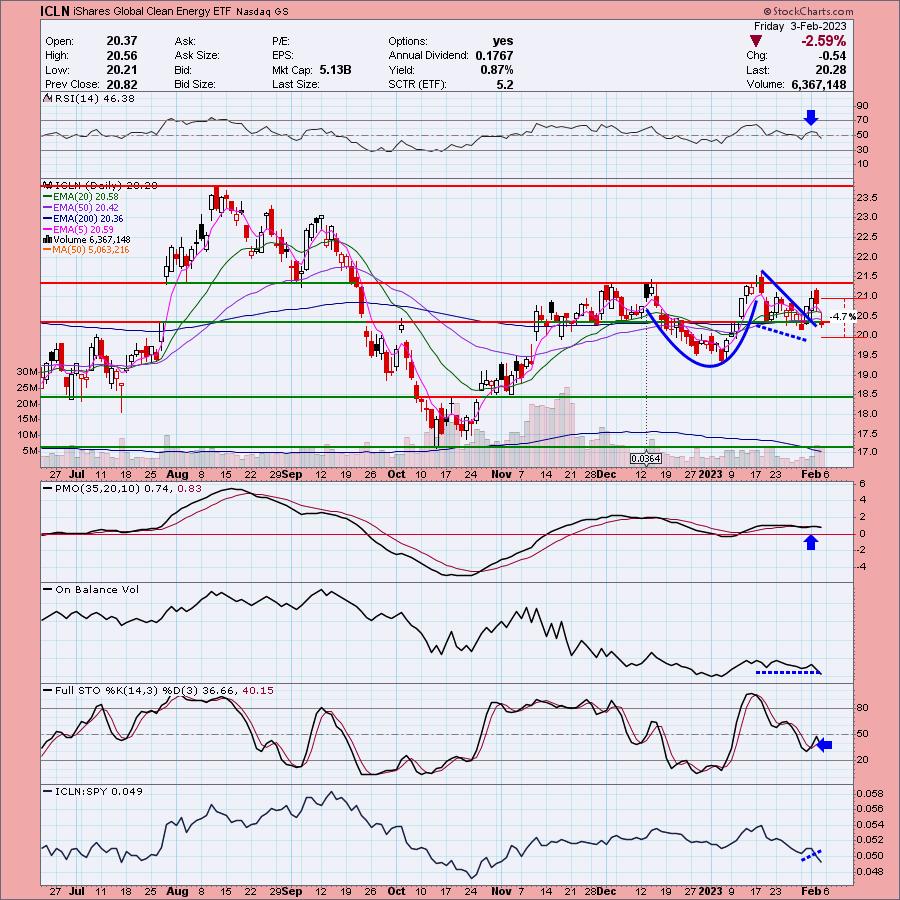
This was my attempt at a reversal candidate. QCLN, a different clean energy ETF, has done well and looks good moving forward, I figured this one would follow suit, but the manager of this fund isn't doing as well as the other. The chart has fallen apart in just one day. The RSI has moved into negative territory, price broke support on a gap down and the PMO has reversed into a SELL signal. In spite of the cup with handle, this one doesn't look good moving forward.
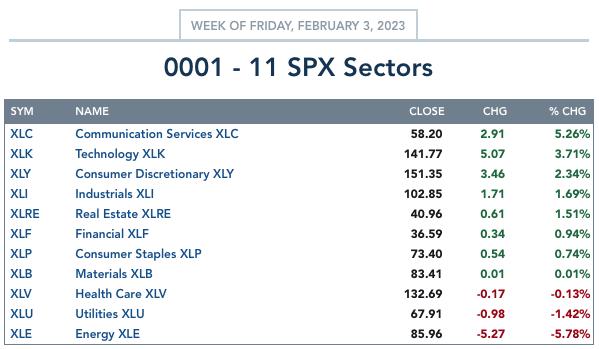
THIS WEEK's Sector Performance:
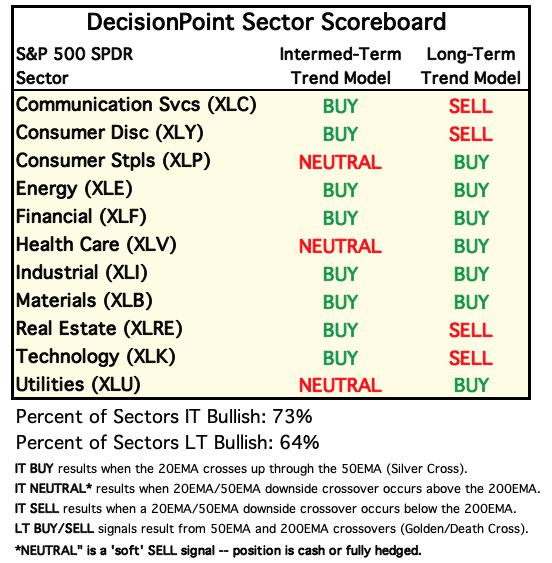
DecisionPoint Sector Scoreboard (Mechanical Trend Model Signals):
Click Here to view Carl's annotated Sector ChartList!
Sector to Watch: Technology (XLK)
It's not a perfect chart, but when compared to the rest of the sector charts, it's easy to see why it is next week's Sector to Watch (again). The only issue I have with the chart is price pulling back and closing the prior gap. Gap closures usually lead to a continuation in the same direction. However, we have overriding factors. The RSI is positive (today's pullback actually helped that). The PMO is rising and not yet overbought. Both the Silver Cross Index and Golden Cross Index continue to rise. Participation is strong with %Stocks > 20/50/200-day EMAs all above 80%. Stochastics are oscillating above 80. Relative strength is of course, excellent given it is leading the market higher. The success of this sector is tied to the market, so any market hiccups will mean problems for this sector. I think it'll be okay, but exercise caution or adjust position sizes.
Industry Group to Watch: Electrical Components & Equipment ($DJUSEC)
The Computer Hardware group looked good, but it was too overbought. This looked best as we had a breakout and subsequent pullback to the breakout point. That implies a move back up after the strong three day rally is digested. The RSI is no longer overbought. The PMO has accelerated higher and isn't really overbought. Stochastics are above 80 and relative strength is improving. There were lots of stocks to review in that group. I found two that I liked, Beldon Inc (BDC) and Vishay Intertech (VSH).
Go to our Sector ChartList on DecisionPoint.com to get an in-depth view of all the sectors. On StockCharts.com you can find the Industry Summary.
Good Luck & Good Trading!
- Erin
erin@decisionpoint.com
Full Disclosure: I'm 18% exposed.
Watch the latest episode of the DecisionPoint Trading Room with Carl & Erin Swenlin on Mondays 3:00p EST!
Technical Analysis is a windsock, not a crystal ball. --Carl Swenlin
NOTE: The stocks reported herein are from mechanical trading model scans that are based upon moving average relationships, momentum and volume. DecisionPoint analysis is then applied to get five selections from the scans. The selections given should prompt readers to do a chart review using their own analysis process. This letter is not a call for a specific action to buy, sell or short any of the stocks provided. There are NO sure things or guaranteed returns on the daily selection of "diamonds in the rough."
Helpful DecisionPoint Links:
DecisionPoint Shared ChartList and DecisionPoint Chart Gallery
Price Momentum Oscillator (PMO)
Swenlin Trading Oscillators (STO-B and STO-V)
(c) Copyright 2023 DecisionPoint.com