
I was very impressed with today's reader requests as most of them could've made the cut. I should mention that I tend to avoid bringing stocks to the table on Thursday that are overly volatile or have had giant rallies that day. Volatility adds a lot of risk and giant rallies lead to pullbacks the next day (typically).
Question: I had two emails this week that basically asked the same thing:
I see that you're at 18% exposure now up from 15%. What are you and your father looking for to become believers in the durability of this rally?
Answer: I would have liked to have increased my exposure, but it's been a rocky uphill road and as I mentioned earlier, I don't like volatility if I can avoid it. "Treacherous" was an adjective used by a subscriber to describe the market right now. He's right. What do I need to see? Consensus among my indicators. They've been very messy. If the market keeps doing its thing though, I will be inching in. Maybe not to the 30% level, but certainly some expansion.
Good Luck & Good Trading,
Erin
Today's "Diamonds in the Rough": FHI, PRPL, SYM and WING.
Other requests: FOUR, ASO, SSO, TGTX, SGHC, COIN, SNAP, NDLS, URBN, WMG and WNC.

RECORDING LINK (1/27/2023):
Topic: DecisionPoint Diamond Mine (1/27/2023) LIVE Trading Room
Passcode: January#27
REGISTRATION for 2/3/2023:
When: Feb 3, 2023 09:00 AM Pacific Time (US and Canada)
Topic: DecisionPoint Diamond Mine (2/3/2023) LIVE Trading Room
Register in advance for this webinar HERE
After registering, you will receive a confirmation email containing information about joining the webinar.

Here is the last recording (1/30):
Welcome to DecisionPoint Diamonds, wherein I highlight ten "Diamonds in the Rough" per week. These are selected from the results of my DecisionPoint Scans which search for stocks that could benefit from the trend and condition of the market. Remember, these are not recommendations to buy or sell, but are the most interesting of the stocks that surfaced in my scans. My objective is to save you the work of the initial, tedious culling process, but you need to apply your own analysis to see if these stocks pique your interest as well. There are no guaranteed winners here!
"Predefined Scans Triggered" are taken from StockCharts.com using the "Symbol Summary" option instead of a "SharpChart" on the workbench.
Stop levels are all rounded down.
Federated Hermes, Inc. (FHI)
EARNINGS: 04/27/2023 (AMC)
Federated Hermes, Inc. is engaged in the provision of investment management products and related financial services. It sponsors, markets and provides investment-related services to sponsored investment companies, federated funds, and separate accounts which include separately managed accounts, institutional accounts, sub-advised funds and other managed products in both domestic and international markets. The company was founded by John F. Donahue and Richard B. Fisher in October 1955 and is headquartered in Pittsburgh, PA.
Predefined Scans Triggered: P&F Bullish Catapult, New 52-week Highs, P&F Ascending Triple Top Breakout and P&F Double Top Breakout.
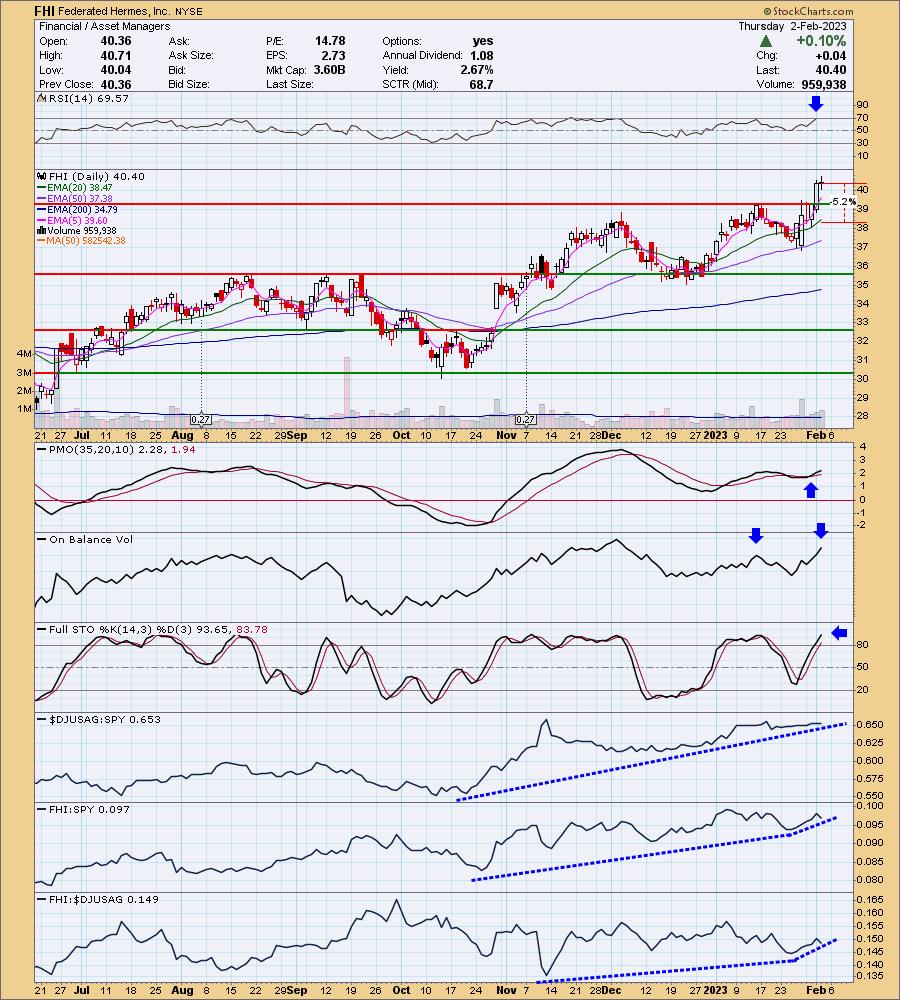
FHI is unchanged in after hours trading. FHI broke out yesterday and consolidated the move today. The RSI is almost in overbought territory so another static day or small pullback could occur sooner rather than later. However, the PMO is on a BUY signal and not overbought. Volume is coming in as needed. Note that the current OBV reading is higher than at the previous price top. Excellent confirmation. Stochastics are rising above 80 and relative strength, while a bit stagnant right now for the industry group, is getting better for FHI against both the group and market. The stop is set under the 20-day EMA around 5.2% or $38.29.
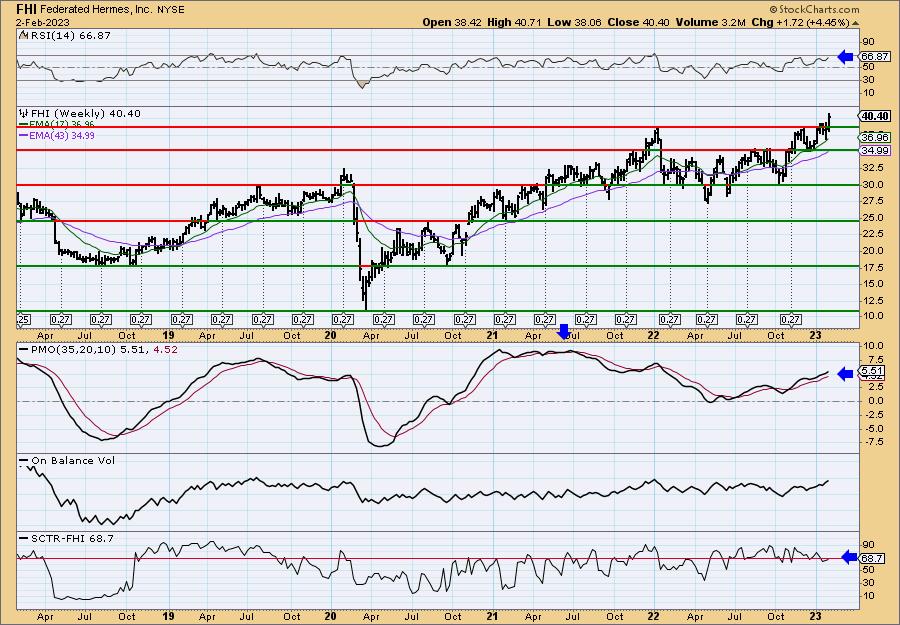
The breakout to new highs and strong indicators suggest FHI will move even higher. The weekly RSI is positive and the weekly PMO is rising and not overbought. The SCTR is acceptable at 68.7%. Since it is at all-time highs, consider an upside target around 15% or $46.46.
Purple Innovation, Inc. (PRPL)
EARNINGS: 02/28/2023 (AMC)
Purple Innovation, Inc. engages in the design and manufacture of comfort technology products. It offers mattresses, bed pillows, seat cushions, mattress protector, and bamboo sheets. The company was founded by Terry V. Pearce and Tony Marion Pearce in 1989 and is headquartered in Lehi, Utah.
Predefined Scans Triggered: Moved Above Upper Bollinger Band, P&F Double Top Breakout and P&F Triple Top Breakout.
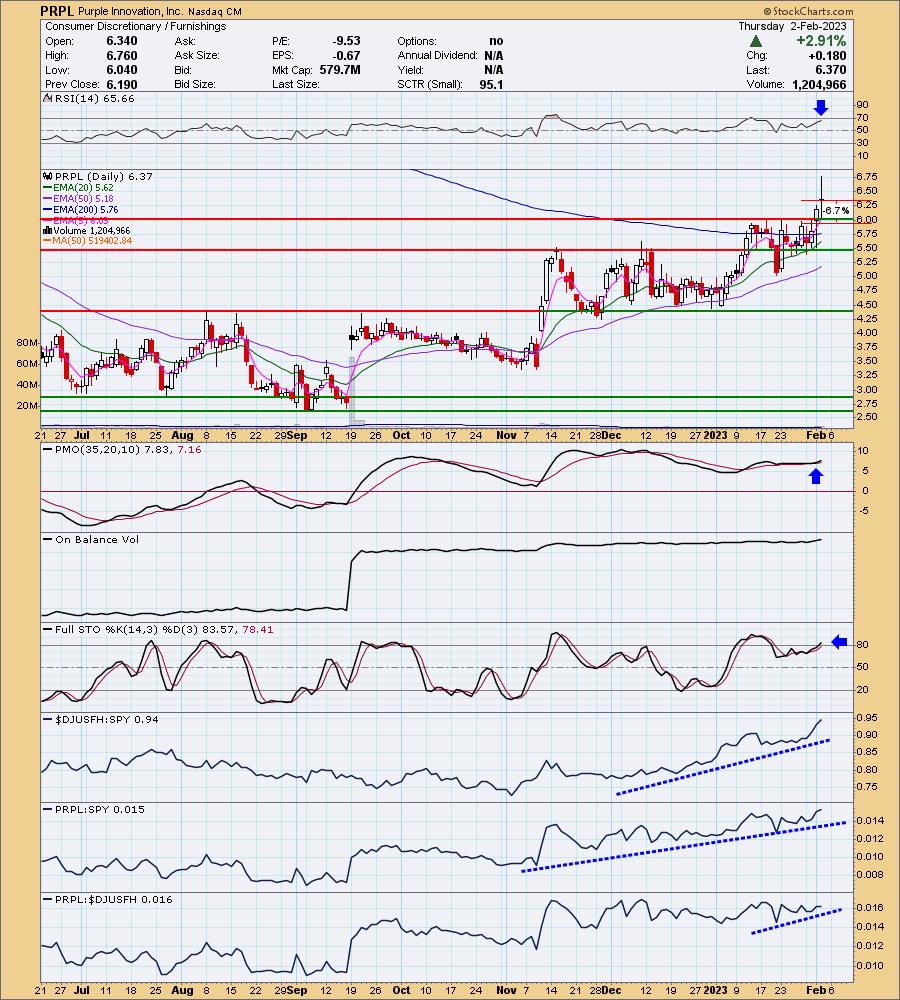
PRPL is down -2.04% in after hours trading so a better entry may be had. This looks like a breakout from a bullish ascending triangle (flat top, rising bottoms). The RSI is in positive territory and the PMO is accelerating higher. Stochastics just moved above 80. Relative strength for the group is excellent and overall PRPL has been trending up in relative strength. The stop is set below support at about 6.7% or $6.37.
I really liked the upside potential on this chart. This is a classic basing pattern and typically breakouts from these type of patterns leads to quite a bit of upside. Notice this was the case coming at the end of 2019. Big picture it eventually broke to those new all-time highs. The weekly RSI is positive and the weekly PMO is rising and not overbought. The SCTR is excellent at 95.1%, meaning PRPL is in the top 5% of all small-cap stocks as far as trend and condition primary in the intermediate and long terms. Upside potential is over 35% in my estimation.

Symbotic Inc. (SYM)
EARNINGS: N/A
Symbotic, Inc. operates as an automation technology company, which engages in a robotics and automation-based product movement technology platform. It focuses on rebuilding the traditional warehouse, powered by a fleet of autonomous robots with artificial intelligence enabled software, to create a first of its kind physical structure that can power a customer's entire supply chain technology platform. The company was founded by Richard B. Cohen on December 11, 2020 and is headquartered in Wilmington, MA.
Predefined Scans Triggered: Parabolic SAR Sell Signals and Strong Volume Gainers
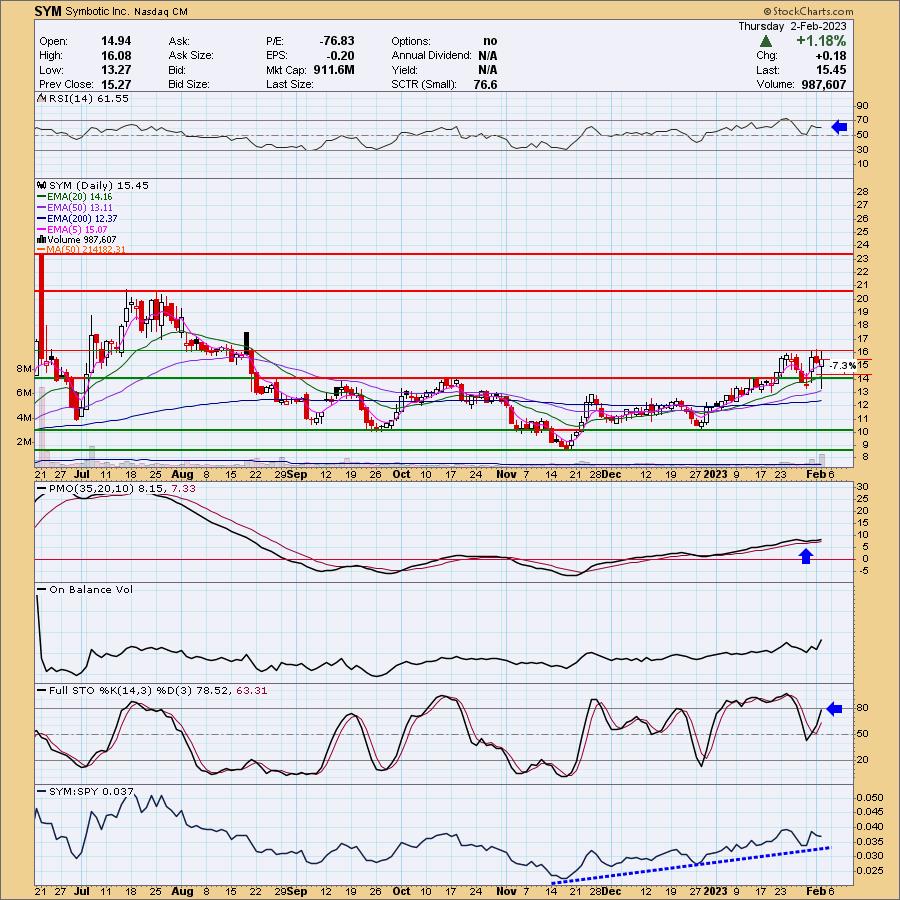
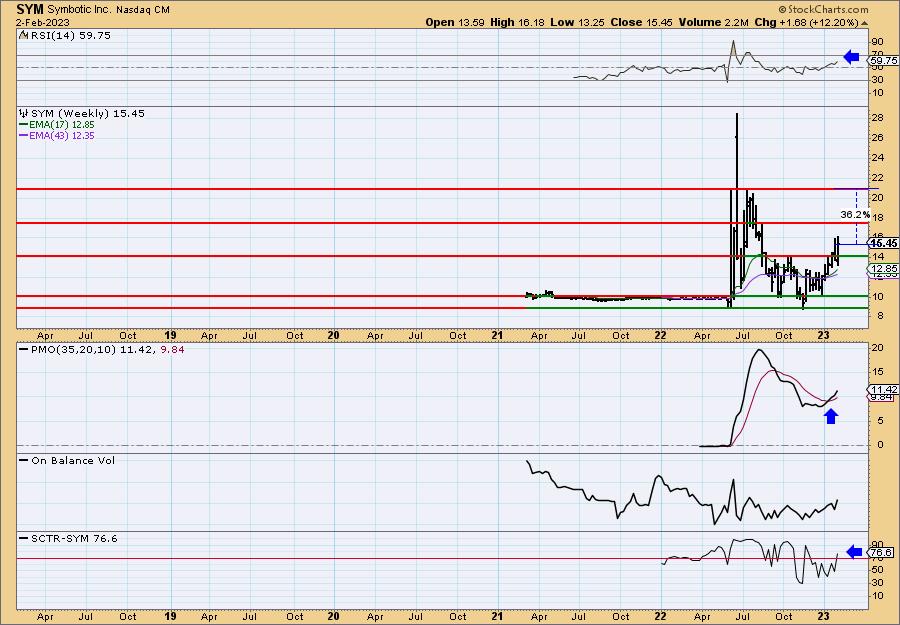
SYM is down -1.29% in after hours trading. I had to look up what this company did since it isn't listed in a sector or industry group. It appears to me to be in the Tech sector with a little Industrials. I liked this one for the new momentum that is coming in after a PMO bottom above the signal line. I'd really like to see a breakout, but it is holding above support. The RSI is positive and Stochastics are rising above 80. Relative strength against the SPY has been exceptional. The stop is set near the 20-day EMA at 7.3% or $14.32.
I like the cup shape on the weekly chart. It has the look of a bullish reverse head and shoulders that is on its way to reaching its upside target near the level I have marked for upside potential. The weekly RSI is positive and the weekly PMO looks excellent as it rises on a BUY signal. It is also far from being overbought. Upside potential is around 36%.
Wingstop Inc. (WING)
EARNINGS: 02/22/2023 (BMO)
Wingstop, Inc. is a franchisor and operator of restaurants, which engages in the provision of cooked-to-order, hand-sauced, and tossed chicken wings. It operates through Franchise and Company segments. The Franchise segment consists of domestic and international franchise restaurants. The Company segment comprises company-owned restaurants. The company was founded in 1994 and is headquartered in Addison, TX.
Predefined Scans Triggered: Moved Above Upper Keltner Channel and P&F Double Top Breakout.
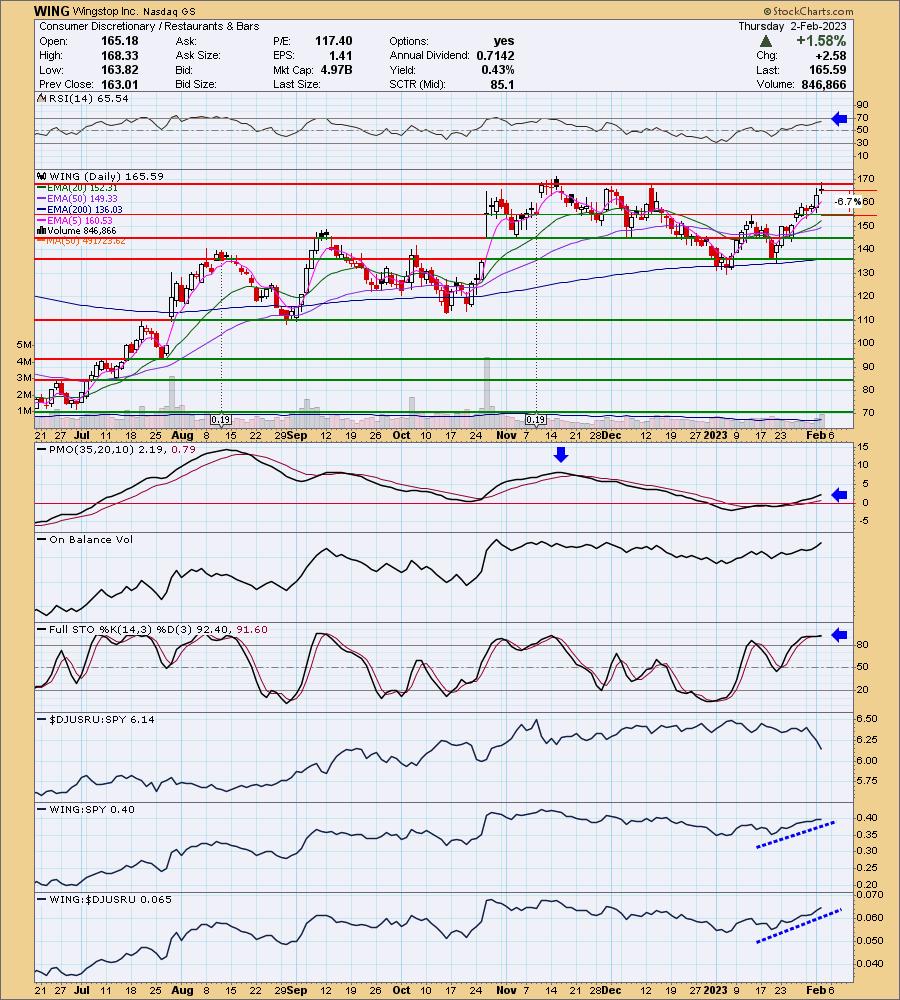
WING is down -0.07% in after hours trading. It has been in a trading range for three months. I generally avoid that, particularly since I don't have the breakout yet. However, the indicators are looking great with the exception of the industry group which is not performing well at all. The RSI is positive and not overbought. Price is busting out of a bullish double-bottom pattern. The PMO is rising slowly and deliberately higher. It isn't overbought. The OBV is confirming the rally. WING has excellent relative strength against both the group and market. The stop is set below the confirmation line of the double-bottom around 6.7% or $154.49.
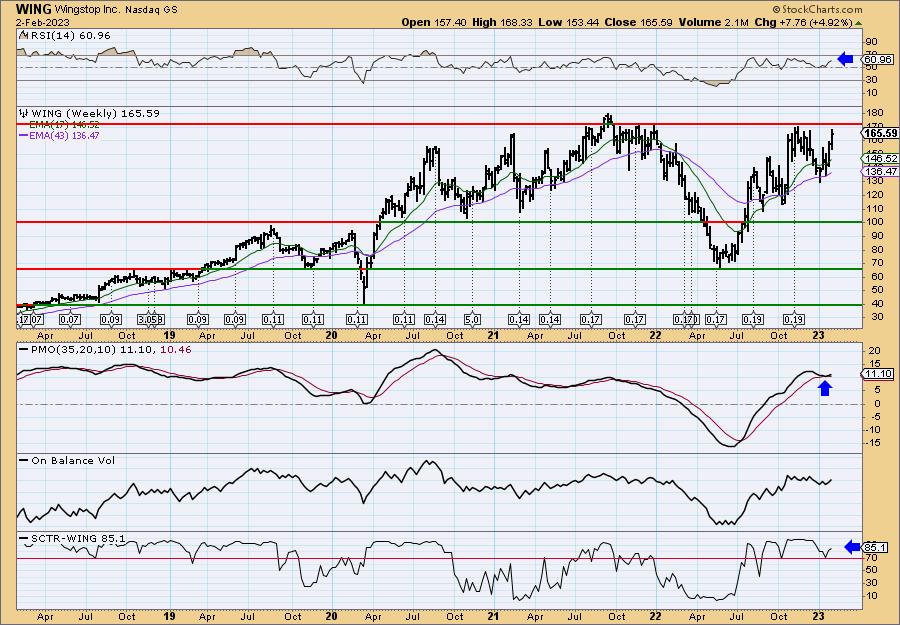
Price is flirting with all-time highs. That might worry me, but the indicators are so strong. The weekly RSI has been staying mostly in positive territory since mid-2022. The weekly PMO just turned up above its signal line. The SCTR is very strong at 85.1%. Since it is near all-time highs, consider an upside target around $190.43.
Don't forget, on Thursdays I look at reader-requested symbols, click HERE to send me an email. I read every email I receive and try to answer them all!
Current Market Outlook:
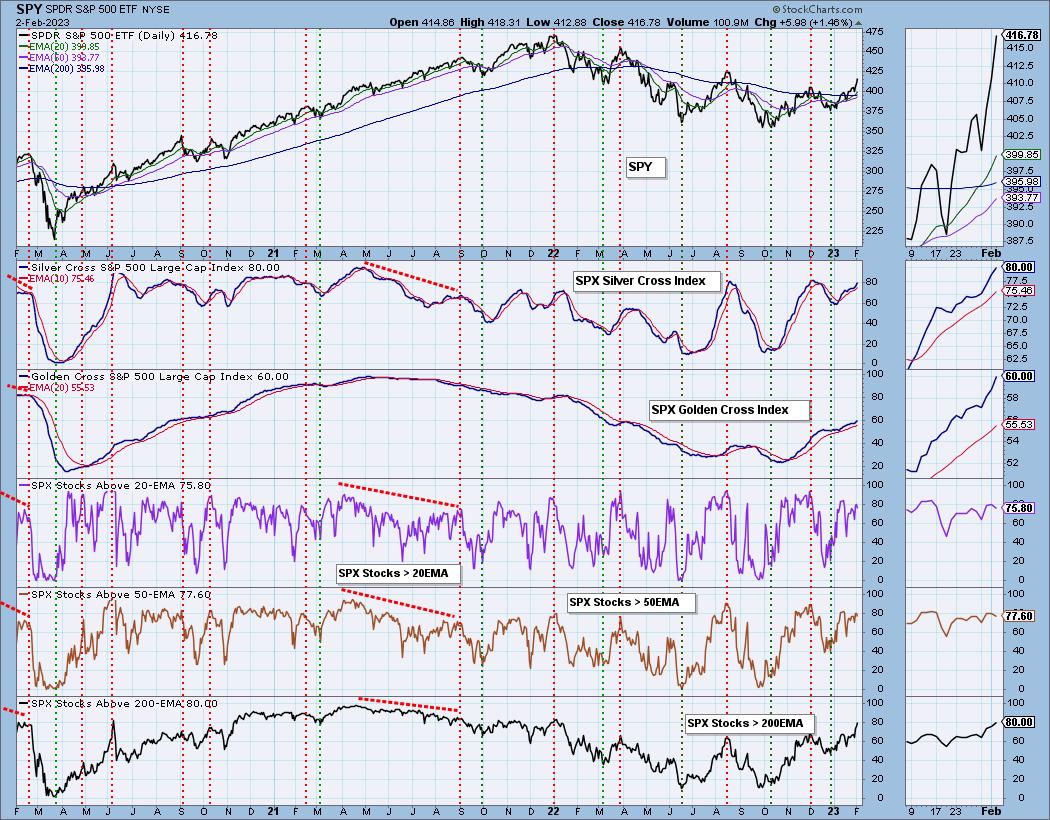
Market Environment: It is important to consider the odds for success by assessing the market tides. The following chart uses different methodologies for objectively showing the depth and trend of participation for intermediate- and long-term time frames.
- The Silver Cross Index (SCI) shows the percentage of SPX stocks on IT Trend Model BUY signals (20-EMA > 50-EMA)
- The Golden Cross Index (GCI) shows the percentage of SPX stocks on LT Trend Model BUY signals (50-EMA > 200-EMA)
Don't forget that as a "Diamonds" member, you have access to our GCI/SCI curated ChartList on DecisionPoint.com. You'll find it under "Members Only" links on the left side on the Blogs and Links Page.
Here is the current chart:
Full Disclosure: I am 18% exposed.
I'm required to disclose if I currently own a stock I mention and/or may buy/short it within the next 72 hours.
"Technical Analysis is a windsock, not a crystal ball." - Carl Swenlin
(c) Copyright 2023 DecisionPoint.com
Watch the latest episode of DecisionPoint Trading Room with Carl & Erin Swenlin on Mondays 7:00p EST or on the DecisionPoint playlist on the StockCharts TV YouTube channel here!
NOTE: The stocks reported herein are from mechanical trading model scans that are based upon moving average relationships, momentum and volume. DecisionPoint analysis is then applied to get five selections from the scans. The selections given should prompt readers to do a chart review using their own analysis process. This letter is not a call for a specific action to buy, sell or short any of the stocks provided. There are NO sure things or guaranteed returns on the daily selection of "Diamonds in the Rough."
Regarding BUY/SELL Signals: The signal status reported herein is based upon mechanical trading model signals and crossovers. They define the implied bias of the price index/stock based upon moving average relationships and momentum, but they do not necessarily call for a specific action. They are information flags that should prompt chart review. Further, they do not call for continuous buying or selling during the life of the signal. For example, a BUY signal will probably (but not necessarily) return the best results if action is taken soon after the signal is generated. Additional opportunities for buying may be found as price zigzags higher, but the trader must look for optimum entry points. Conversely, exit points to preserve gains (or minimize losses) may be evident before the model mechanically closes the signal.
Helpful DecisionPoint Links:
DecisionPoint Shared ChartList and DecisionPoint Chart Gallery
Price Momentum Oscillator (PMO)
Swenlin Trading Oscillators (STO-B and STO-V)
For more links, go to DecisionPoint.com