
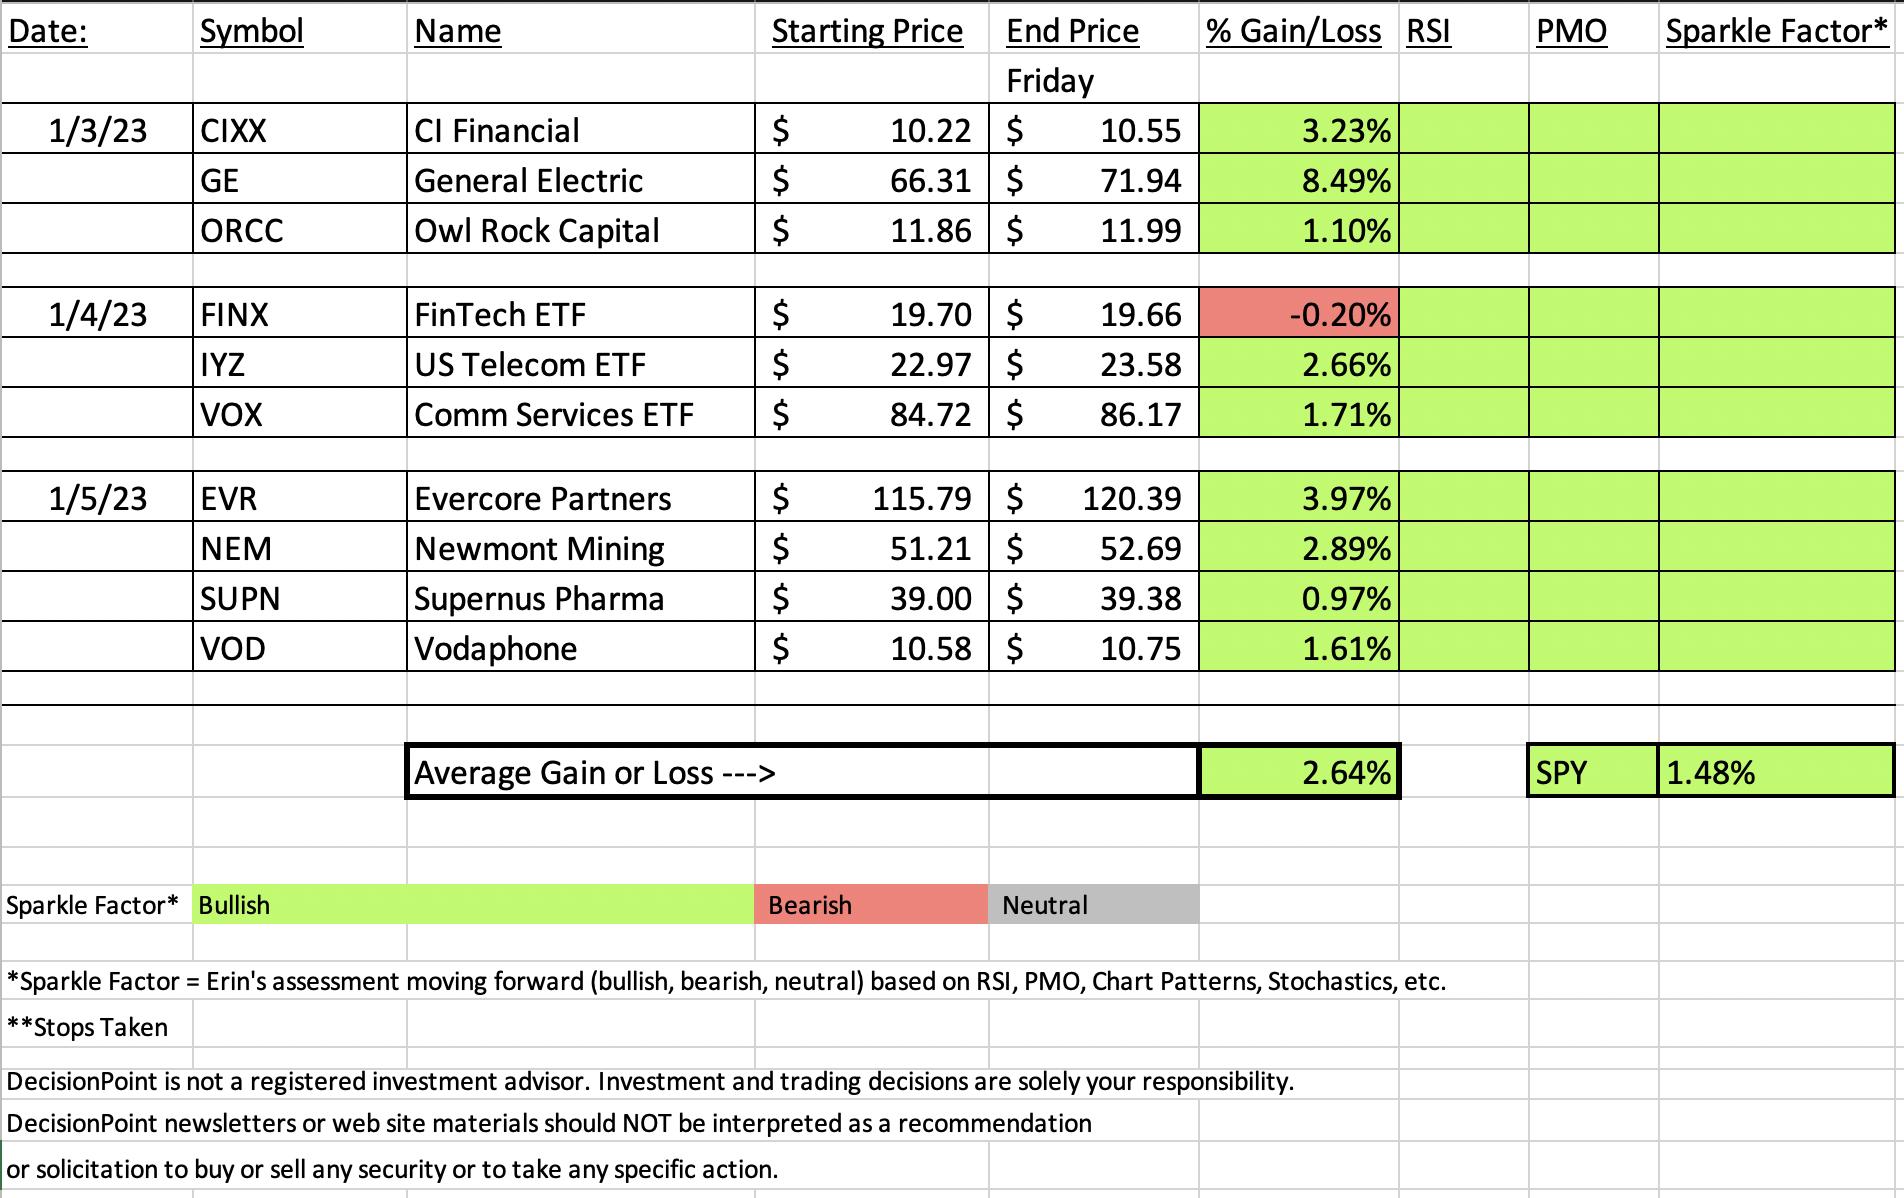
The market had a great week, but beware of today's short covering rally. We are not all in on this bear market rally. The market was up a healthy +1.48%. DP Diamonds on their shorter week were up +2.64.
As noted in the title, you'll only find one red square on the spreadsheet and that is due to a small -0.20% drop on the FinTech ETF (FINX). Every "Diamond in the Rough" has rising PMOs and positive RSIs. Consequently, we didn't see any deterioration on these charts, leaving us with "green" Sparkle Factors across the board. A green Sparkle Factor means it is at a minimum a "hold" and possible "buy".
I am keeping my exposure low. Currently it is at 10% with no hedge. I'm looking to expand next week, but only if the market looks ready to breakout. I don't want to be in while it consolidates sideways.
Reminder that the FREE DecisionPoint Trading Room will start 30 minutes early on Monday. It will air as always at 3p ET. Hope to see you there! Registration is now open for next week's Diamond Mine trading room.
Good Luck & Good Trading,
Erin

RECORDING LINK (1/6/2023):
Topic: DecisionPoint Diamond Mine (1/6/2023) LIVE Trading Room
Start Time: Jan 6, 2023 09:00 AM PT
Passcode: January#6
REGISTRATION for 1/13/2022:
When: Jan 13, 2023 09:00 AM Pacific Time (US and Canada)
Topic: DecisionPoint Diamond Mine (1/13/2023) LIVE Trading Room
Register in advance for this webinar HERE
After registering, you will receive a confirmation email containing information about joining the webinar.

Our latest DecisionPoint Trading Room recording:
A few items about the spreadsheet: I've put on the spreadsheet whether the RSI is positive (green) or negative (red). The PMO column tells you if it is rising (green) or falling (red). Finally I've added my own "Sparkle Factor" that gives you my assessment going forward, bullish (green), bearish (red) or neutral (gray). The Sparkle Factor is basically my thoughts on whether I expect it to rise or fall. A neutral means it could really go either way so it could be added to a watch list. If you're in a stock I consider "neutral" going forward, the ball is in your court.
Darling:
General Electric Co. (GE)
EARNINGS: 01/24/2023 (BMO)
General Electric Capital Corp. provides financial products and services. Its services include commercial loans and leases, fleet management, financial programs, credit cards, personal loans, and other financial services. The firm's solutions include energy finance and aviation finance. The company was founded in 1932 and is headquartered in Boston, MA.
Predefined Scans Triggered: P&F Double Top Breakout and P&F Bearish Signal Reversal.
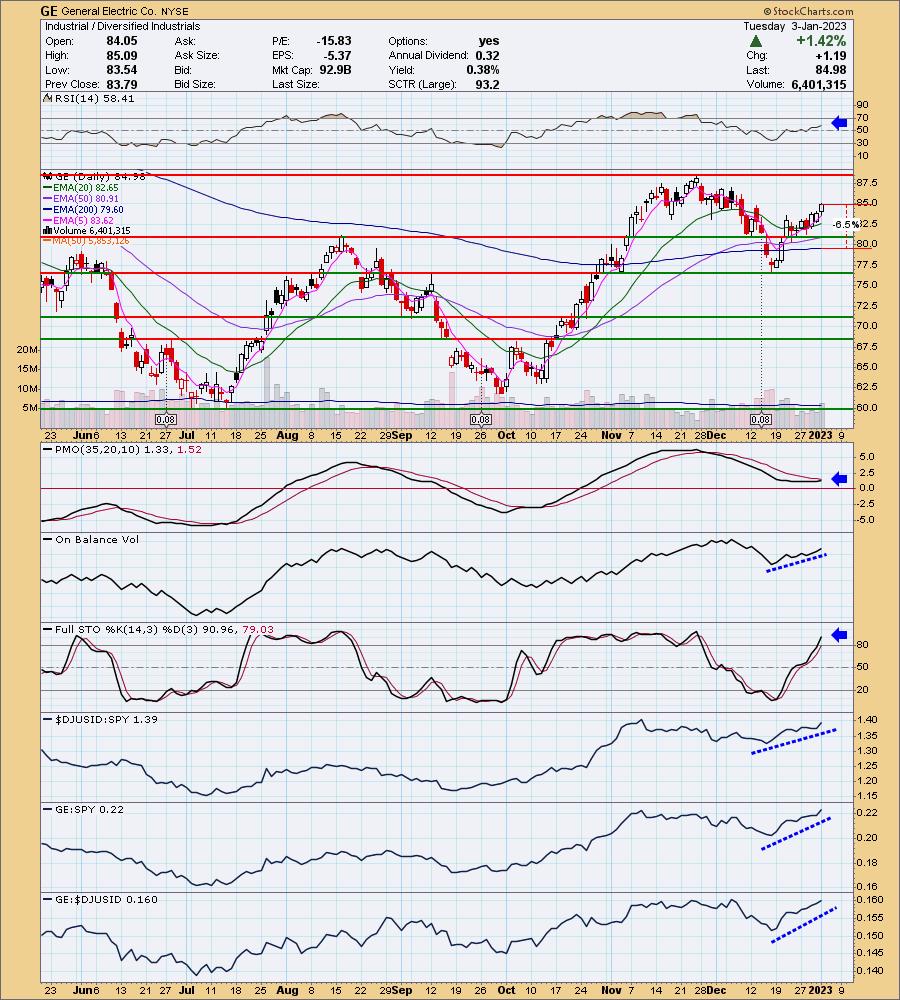
Here are the commentary and chart from Tuesday (1/3):
"GE is up +0.14% in after hours trading. I wish we had more upside potential on the daily chart given overhead resistance is quite close, but the bullish indicators suggest a breakout there. The RSI is positive and rising. The PMO is beginning to rise and should trigger a crossover BUY signal momentarily. The OBV is confirming this new rally, showing volume is coming in. Stochastics are above 80 and still rising. Relative strength for the group is very good and GE is a leader among the group based on its rising relative strength against the group. Hence it is outperforming the SPY. The stop is set at a comfortable 6.5% beneath the 200-day EMA around $79.45."
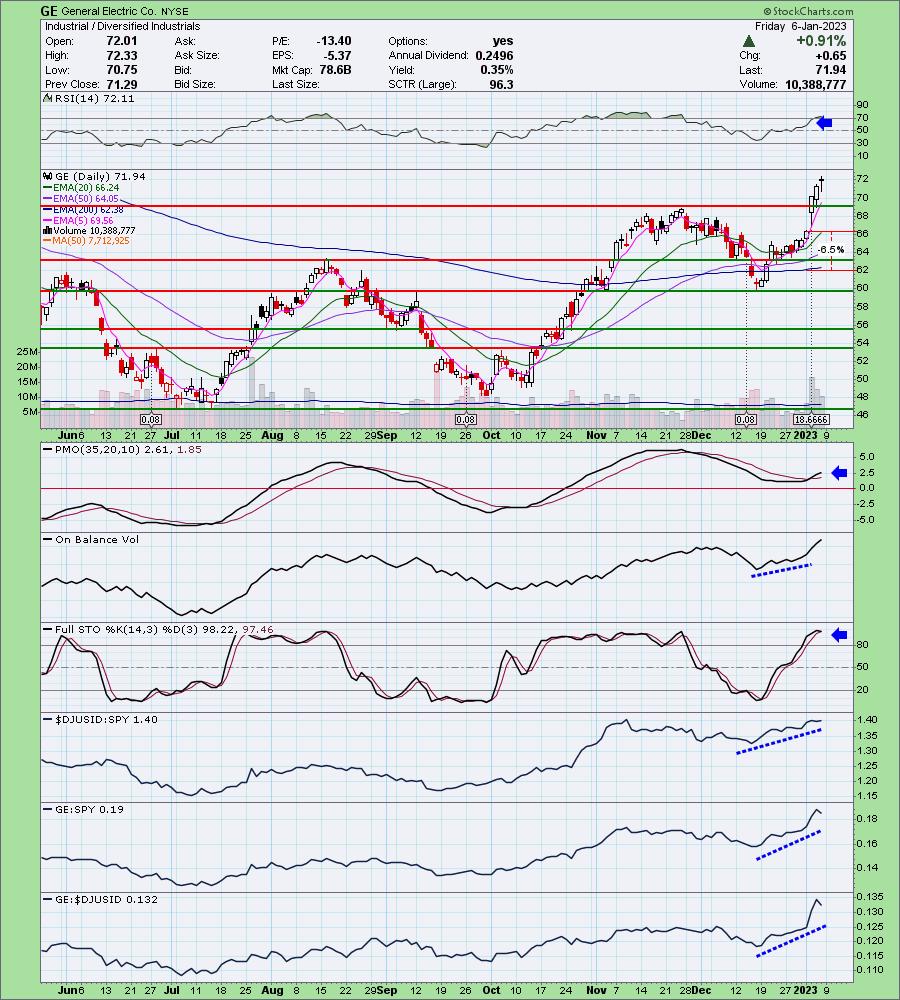
Here is today's chart:
The setup was good but the rally has been stunning. All of the indicators lined up nicely to begin with and we were able to set a thin stop which can now be raised. I'd keep the stop in play simply because the RSI is overbought. It can stay overbought, but best to play it safe in this market.
Don't forget, on Thursdays I look at reader-requested symbols, so shoot me an email at erin@decisionpoint.com. I read every email I receive and try to answer them all!
Dud:
Global X FinTech Thematic ETF (FINX)
EARNINGS: N/A
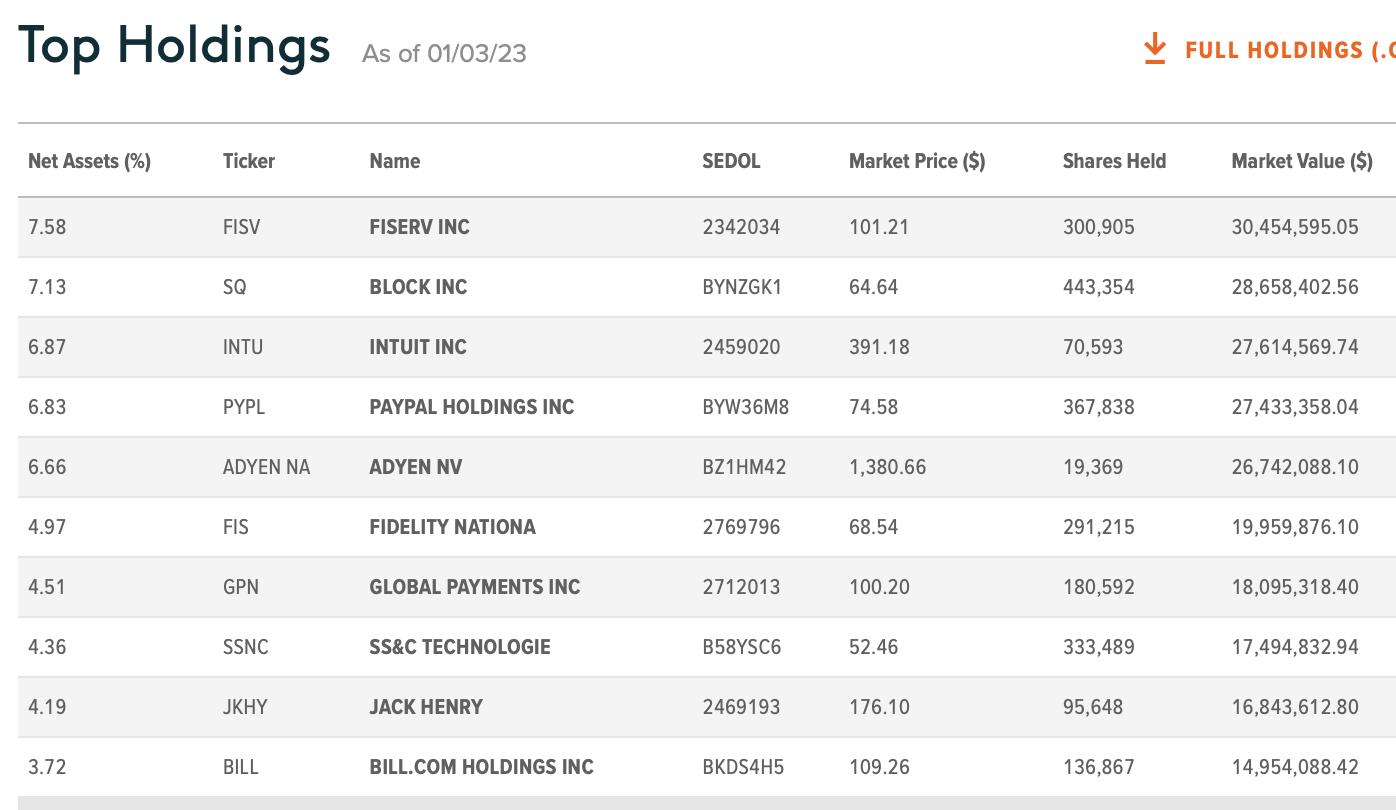
FINX tracks a market-cap-weighted index of companies in developed markets that derive significant revenues from providing financial technology products and services. Click HERE for more information.
Predefined Scans Triggered: P&F Descending Triple Bottom Breakdown, Parabolic SAR Buy Signals and P&F double Bottom Breakout.
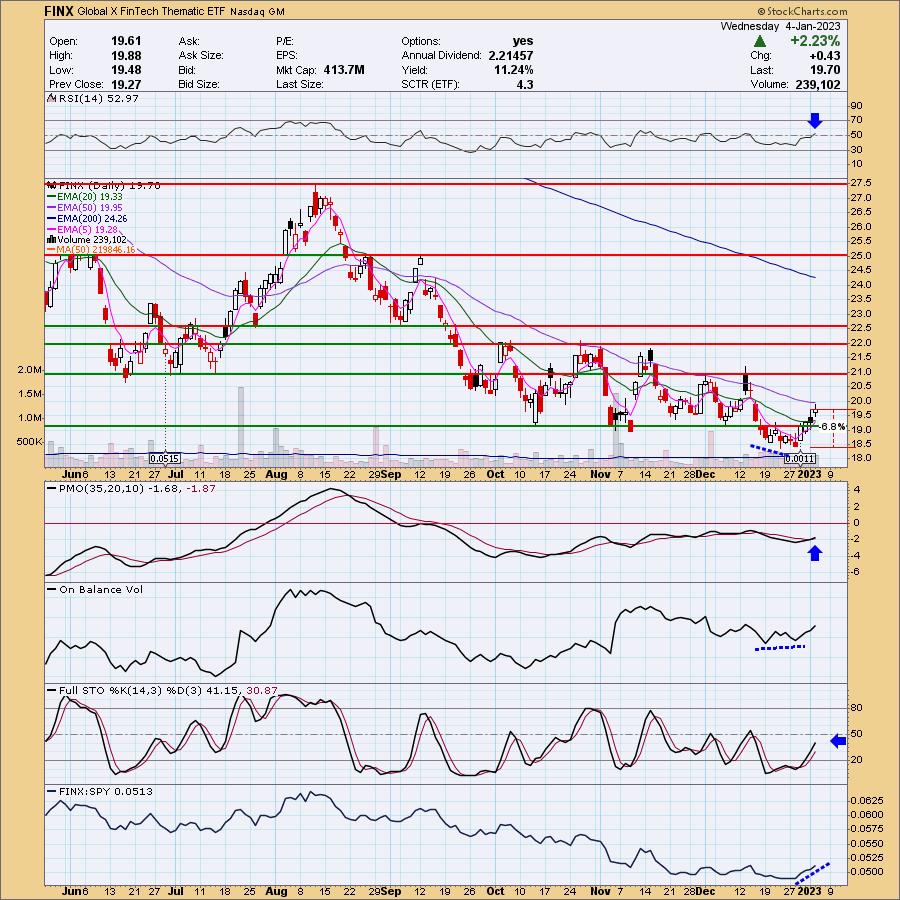
Here are the commentary and chart from Wednesday (1/4):
"FINX is up +4.52% in after hours trading, so we must be onto something here. The declining trend hasn't been broken, but the indicators are improving quickly, suggesting it will break the trend. The RSI just hit positive territory and the PMO has generated a crossover BUY signal. There is a positive OBV divergence leading into the rally which means we could see a more extended rally. Stochastics are in negative territory but rising. This ETF is beginning to outperform the market. The stop is set at 6.8% around $18.36."
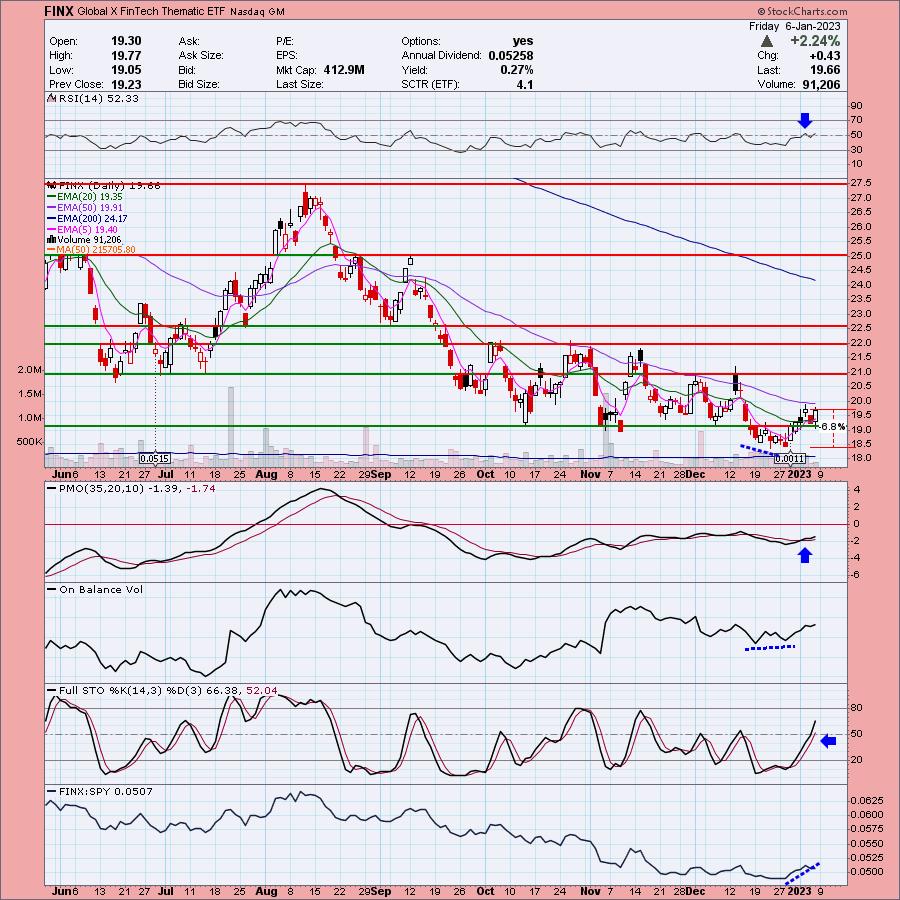
Here is today's chart:
I hate to even list this one a "Dud". Price snapped back to the breakout point yesterday and it is bouncing today; it just wasn't able to overcome the decline from yesterday. The set up still is bullish. The RSI is positive, the PMO is rising on a BUY signal and Stochastics are rising strongly. This ETF still look favorable.
THIS WEEK's Sector Performance:

DecisionPoint Sector Scoreboard (Mechanical Trend Model Signals):

Click Here to view Carl's annotated Sector ChartList!
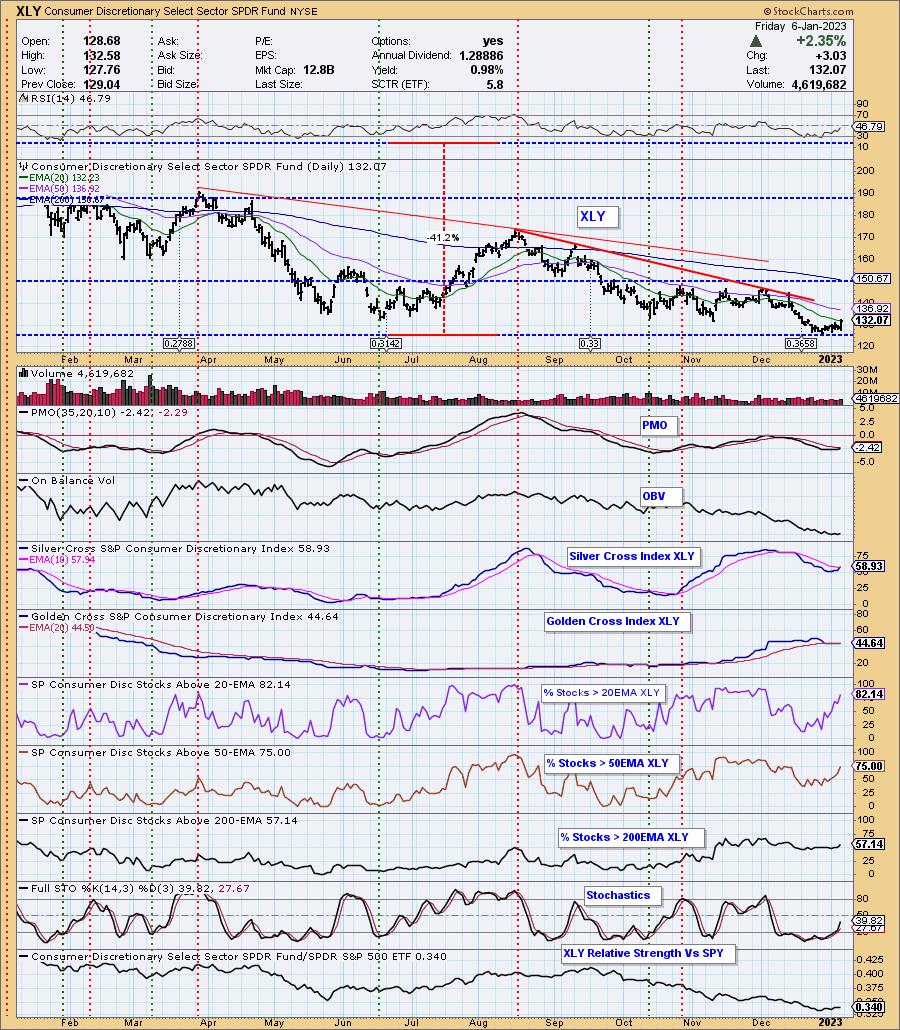
Sector to Watch: Consumer Discretionary (XLY)
Communication Services (XLC) and Materials (XLB) floated to the top with the eventual winning sector being Consumer Discretionary (XLY). The biggest tiebreaker was the Silver Cross Index (SCI). The SCI for XLY was by far superior to the others. Mainly because it is clearly scooping up and today had a positive crossover its signal line. Price nearly closed above the 20-day EMA. Participation is consistently improving and there is still growth available. This looks like a sector on the rise. The RSI isn't quite positive, but the PMO should generate a crossover BUY signal next week. Stochastics usually are the first to improve and they are doing just that.
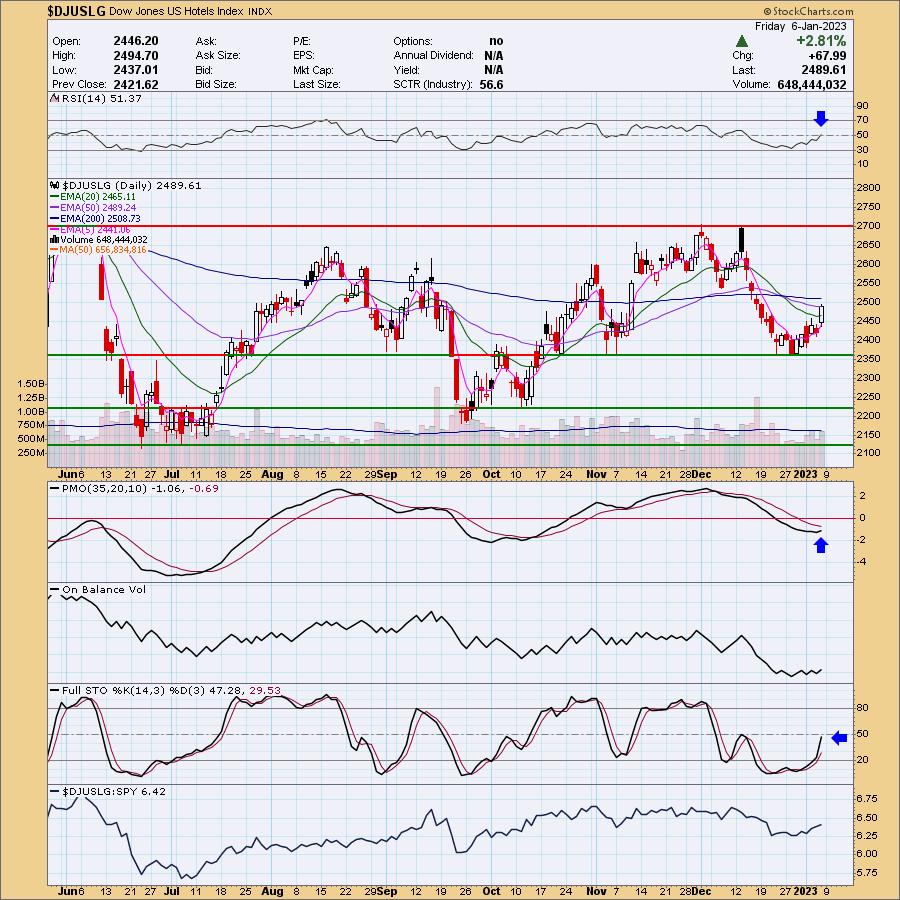
Industry Group to Watch: Hotels ($DJUSLG)
Of the 21 industry groups within Consumer Discretionary, there are only two I don't like. So don't think this is the only pocket of strength within the group. The only two I don't like are Auto Parts and Home Improvement Retailers. We have an excellent price reversal right on support. The RSI just moved into positive territory and the PMO is rising. Stochastics are also rising strongly. While reviewing the group, I picked out these symbols from the group that looked good: IHG, H, HGV and MAR. I see these as short-term investments.
Go to our Sector ChartList on DecisionPoint.com to get an in-depth view of all the sectors. On StockCharts.com you can find the Industry Summary.
Good Luck & Good Trading!
- Erin
erin@decisionpoint.com
Full Disclosure: I'm 10% exposed.
Watch the latest episode of theDecisionPoint Trading Room with Carl & Erin Swenlin on Mondays 3:00p EST!
Technical Analysis is a windsock, not a crystal ball. --Carl Swenlin
NOTE: The stocks reported herein are from mechanical trading model scans that are based upon moving average relationships, momentum and volume. DecisionPoint analysis is then applied to get five selections from the scans. The selections given should prompt readers to do a chart review using their own analysis process. This letter is not a call for a specific action to buy, sell or short any of the stocks provided. There are NO sure things or guaranteed returns on the daily selection of "diamonds in the rough."
Helpful DecisionPoint Links:
DecisionPoint Shared ChartList and DecisionPoint Chart Gallery
Price Momentum Oscillator (PMO)
Swenlin Trading Oscillators (STO-B and STO-V)
(c) Copyright 2023 DecisionPoint.com