
Thank you to all who sent in symbol requests for today's report. When I get a lot of them, it means I have many that I don't cover. Of the requests, these four stocks definitely floated to the top, but I have included a list of the others that were requested. Even after my first pass, I had ten so it was hard to whittle it down to only four.
Tomorrow is the Diamond Mine trading room. Registration is below. If you lose your confirmation email, just come back to this (or any report this week) and re-register so you'll get another confirmation email.
If your stock symbol wasn't covered or something else has come to mind, send me an email and I can add it to tomorrow's request list.
Good Luck & Good Trading,
Erin
Today's "Diamonds in the Rough": EVR, NEM, SUPN and VOD.
Other Requests: EBS, SOFI, MNKD, ADBE, B, OUNZ, URA, LIT, AZEK, FHI, FTAI, IRDM, PXH, STRO and VTRS.
Important: Your current subscription rates will ALWAYS stay the same when we raise prices on January 15th. **
** You must keep your subscription running and in good standing.

RECORDING LINK (12/30/2022):
Topic: DecisionPoint Diamond Mine (12/30/2022) LIVE Trading Room
Start Time: Dec 30, 2022 09:00 AM PT
Passcode: Dec@30th
REGISTRATION for 1/6/2022:
When: Jan 6, 2023 09:00 AM Pacific Time (US and Canada)
Topic: DecisionPoint Diamond Mine 1/6/2023) LIVE Trading Room
Register in advance for this webinar HERE
After registering, you will receive a confirmation email containing information about joining the webinar.

Here is the last recording (no recording on 12/26 or 1/2):
Welcome to DecisionPoint Diamonds, wherein I highlight ten "Diamonds in the Rough" per week. These are selected from the results of my DecisionPoint Scans which search for stocks that could benefit from the trend and condition of the market. Remember, these are not recommendations to buy or sell, but are the most interesting of the stocks that surfaced in my scans. My objective is to save you the work of the initial, tedious culling process, but you need to apply your own analysis to see if these stocks pique your interest as well. There are no guaranteed winners here!
"Predefined Scans Triggered" are taken from StockCharts.com using the "Symbol Summary" option instead of a "SharpChart" on the workbench.
Stop levels are all rounded down.
Evercore Partners Inc. (EVR)
EARNINGS: 02/01/2023 (BMO)
Evercore, Inc. operates as a investment banking advisory company. It operates through the Investment Banking and Investment Management business segments. The Investment Banking segment includes the global advisory business of the company through which the firm delivers strategic corporate advisory, capital markets advisory, and institutional equities services. The Investment Management segment comprises wealth management and trust services through Evercore Wealth Management L.L.C. and investment management in Mexico through Evercore Casa de Bolsa, S.A. de C.V., as well as private equity through investments in entities that manage private equity funds. The company was founded by Roger C. Altman in 1995 and is headquartered in New York, NY.
Predefined Scans Triggered: Improving Chaikin Money Flow, Moved Above Upper Price Channel and P&F Double Top Breakout.
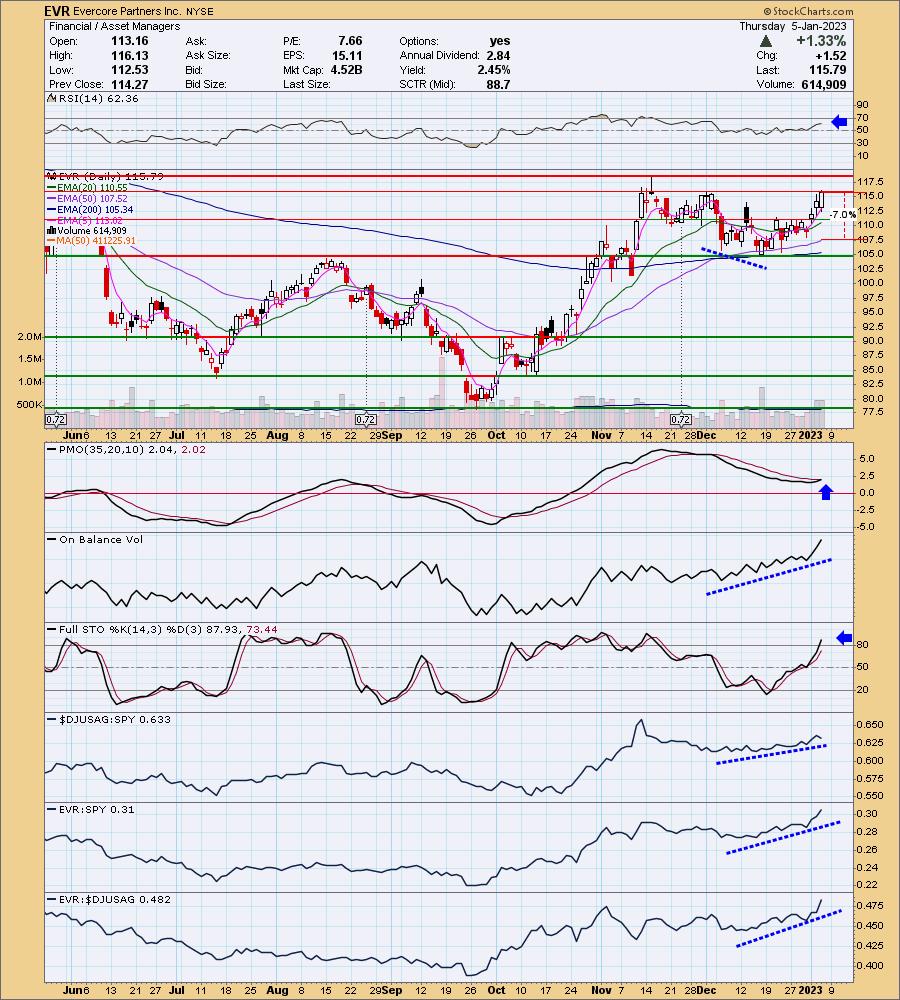
EVR is unchanged in after hours trading. It's been on a strong rally but hasn't quite broken out yet. Still, the RSI is positive and the PMO triggered a crossover BUY signal today. Stochastics are rising above 80. I really like the OBV positive divergence that led into this rally. It suggests it will extend further. Relative strength is improving for both the group and EVR which is already outperforming the group. The stop is set around 7% or $107.68.
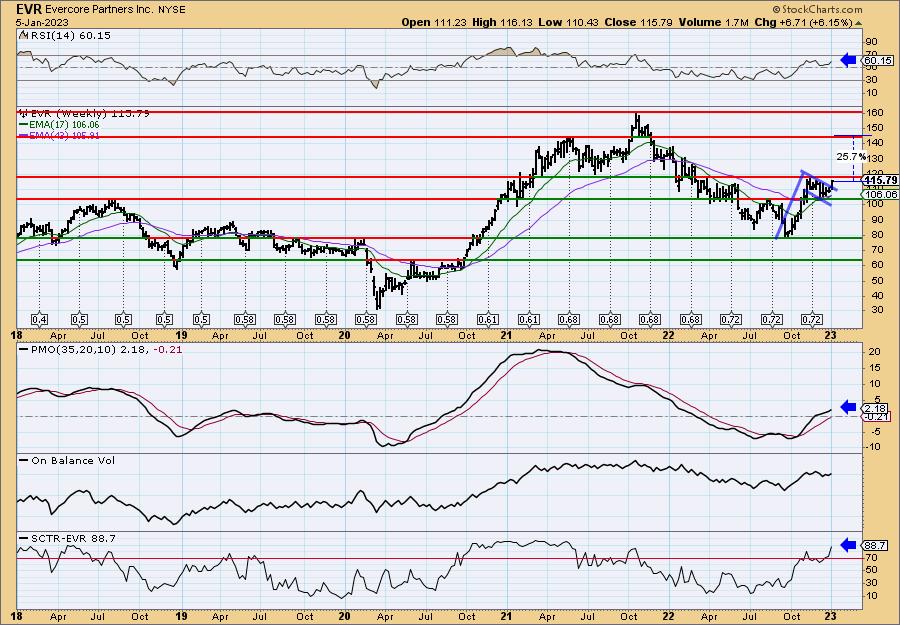
The bull flag was immediately visible on the weekly chart. This week it is confirming the pattern with a breakout. The pattern tells us to expect a minimum upside target on the rally to be the length of the flagpole. This would calculate to about $145 or almost exactly on overhead resistance. If it can fulfill the pattern, that would be an over 25% gain. The weekly RSI is positive, rising and not overbought. The weekly PMO is on a crossover BUY signal and accelerating higher. It isn't overbought either. The StockCharts Technical Rank (SCTR) is at a bullish 88.7%, suggesting it is in the top 12% of all mid-caps based on trend and condition in all three timeframes with an emphasis on the intermediate and long terms.
Newmont Corporation (NEM)
EARNINGS: 02/23/2023 (BMO)
Newmont Corp. is a gold producer, engages in the exploration and acquisition of gold properties, contains copper, silver, lead, zinc or other metals. It operates through the following geographical segments: North America, South America, Nevada, Australia, and Africa. The North America segment consists primarily of carlin, phoenix, twin creeks and long canyon in the state of Nevada and Cripple Creek and Victor in the state of Colorado, in the United States. The South America segment composed of Yanacocha in Peru, Merian in Suriname and Cerro Negro. The Australia segment consists primarily of Boddington, Tanami and Kalgoorlie in Australia. The Africa segment composed of Ahafo and Akyem in Ghana. The company was founded by William Boyce Thompson on May 2, 1921, and is headquartered in Denver, CO.
Predefined Scans Triggered: Hollow Red Candles and P&F Double Top Breakout.
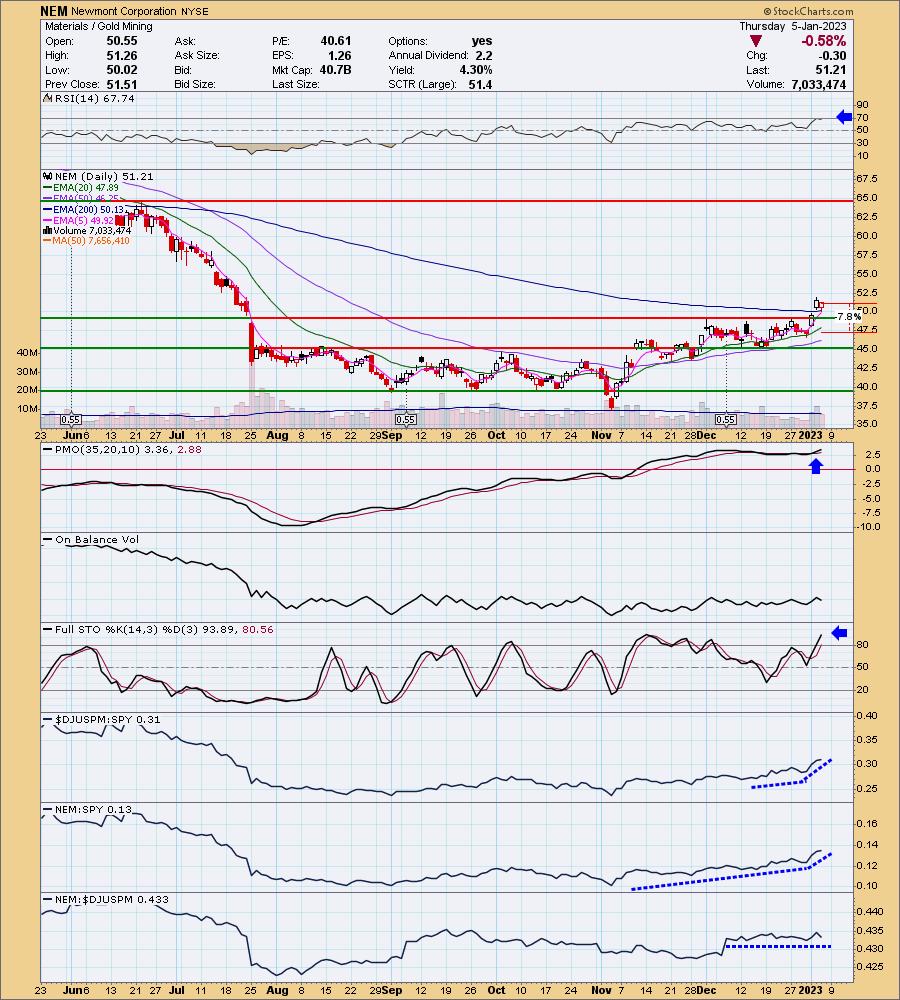
NEM is up +0.04% in after hours trading. This is a standard bearer for the Gold Mining industry group. While it isn't really outperforming its industry group, this is a solid company. The breakout in Gold Miners is great and I think price will move higher as long as participation remains strong as it is now (we look at the Gold Miners (GDX) chart every market day in the DP Alert). The chart is very bullish. Even though price was down today, it formed a bullish hollow red candlestick. The RSI is positive and the PMO is finally putting some margin between it and its signal line. Stochastics look great. As noted earlier, NEM is not outperforming its group, but as long as it outperforms the SPY, I'm good with it. The stop is set at 7.8% around $47.21.
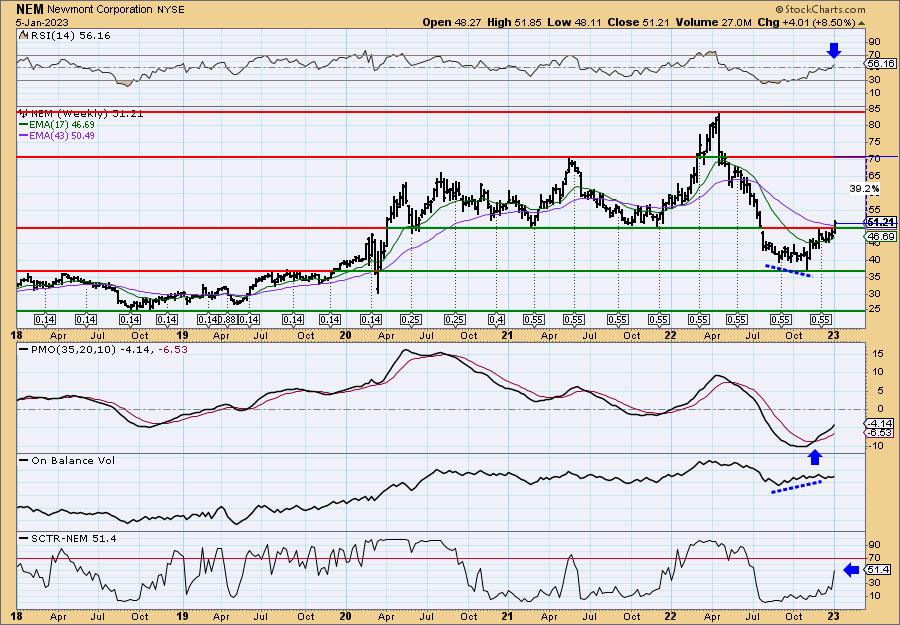
The breakout is compelling on the weekly chart and suggests that this one could move quite a bit higher. The weekly RSI is rising above net neutral (50). The PMO is on an oversold BUY signal and rising strongly. The SCTR isn't great at 51.4%, but it is improving quickly. Upside potential could be over 39%. I'm not so sure we'll see that on this rally, but the bias is strongly bullish.
Supernus Pharmaceuticals, Inc. (SUPN)
EARNINGS: 02/28/2023 (AMC)
Supernus Pharmaceuticals, Inc. engages in the development and commercialization of products for the treatment of central nervous system diseases. It offers Trokendi XR, Oxtellar XR, APOKYN, XADAGO, and MYOBLOC products. The company was founded by Jack A. Khattar on March 30, 2005 and is headquartered in Rockville, MD.
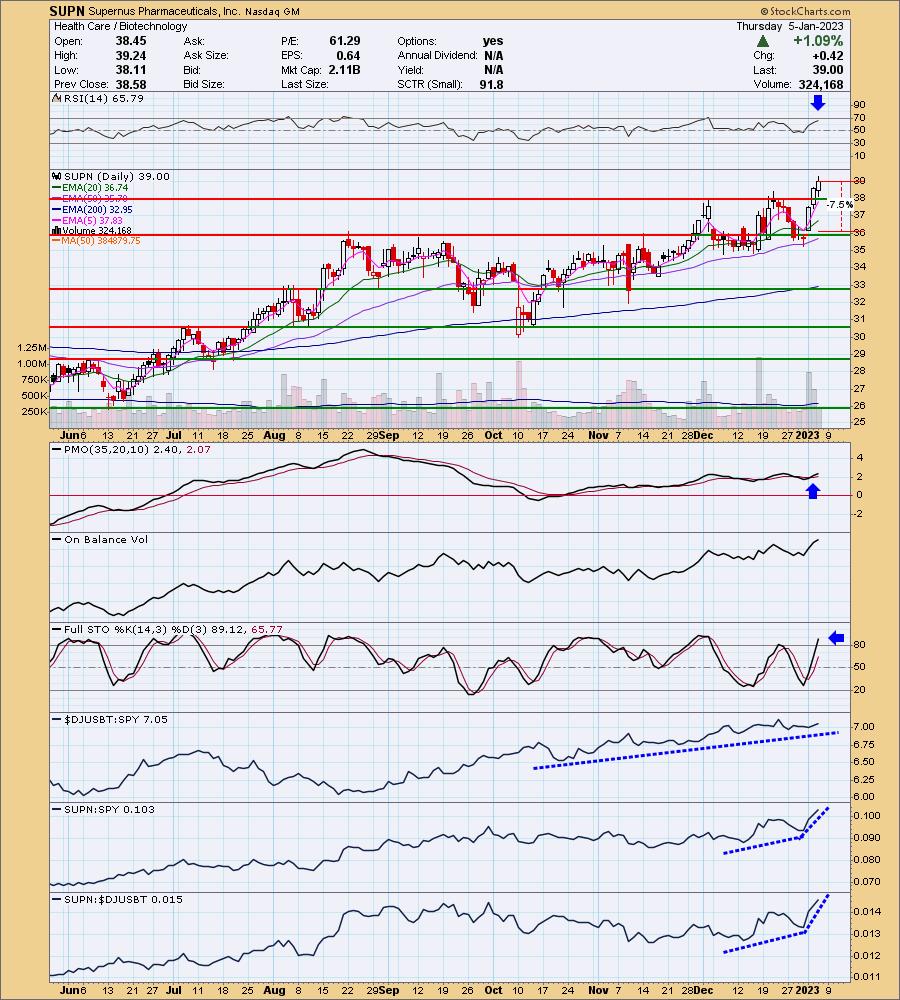
Predefined Scans Triggered: New 52-week Highs, P&F Double Top Breakout and P&F bullish Triangle.
SUPN is unchanged in after hours trading. Yesterday it saw a strong breakout above recent highs. The RSI is positive and the PMO is rising on a crossover BUY signal. The PMO is a little flat, but the gently rising trend is to blame. Stochastics are rising strongly. The group has really been outperforming and it looks like it isn't done outperforming. SUPN is showing excellent relative strength to the group and consequently the SPY. The stop is set around 7.5% or $36.07.
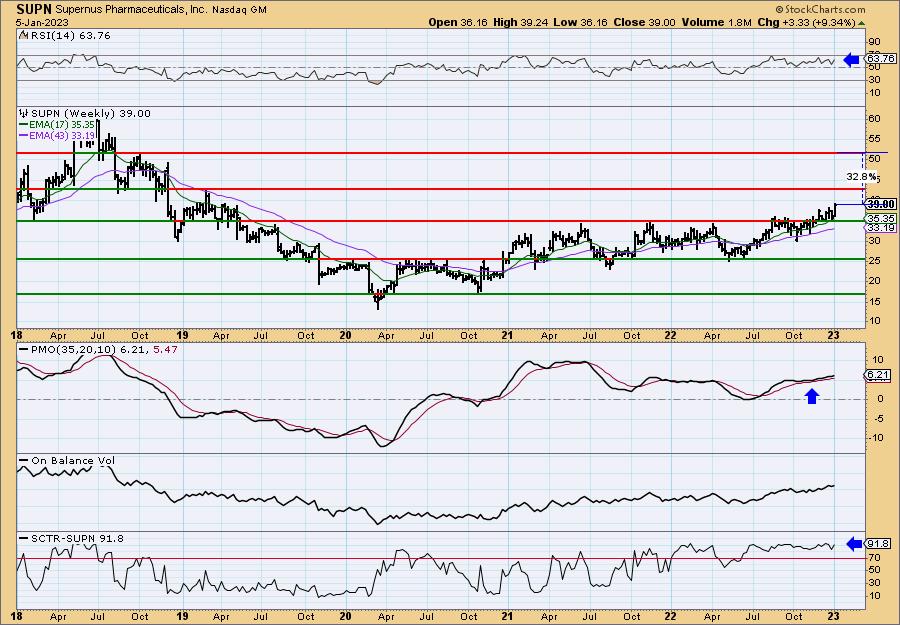
The weekly PMO has been in positive territory since the middle of 2022. The weekly PMO is rising and the SCTR is excellent at 91.8%. The OBV is confirming the rally with its own rising bottoms.
Vodafone Group Public Limited Company (VOD)
EARNINGS: 05/16/2023
Vodafone Group Plc engages in telecommunication services in Europe and internationally. The firms offers mobile services that enable customers to call, text and access data, fixed line services, including broadband, television (TV) offerings, and voice and convergence services under the GigaKombi and Vodafone One names to customers. It also provides mobile, fixed and a suite of converged communication services, such as Internet of Things (IoT) comprising managed IoT connectivity, automotive and insurance services, as well as smart metering and health solutions, cloud and security portfolio comprising public and private cloud services, as well as cloud-based applications and products for securing networks and devices and international voice, IP transit and messaging services to support business customers that include small home offices and large multi-national companies. The company was founded on July 17, 1984 and is headquartered in Newbury, the United Kingdom.
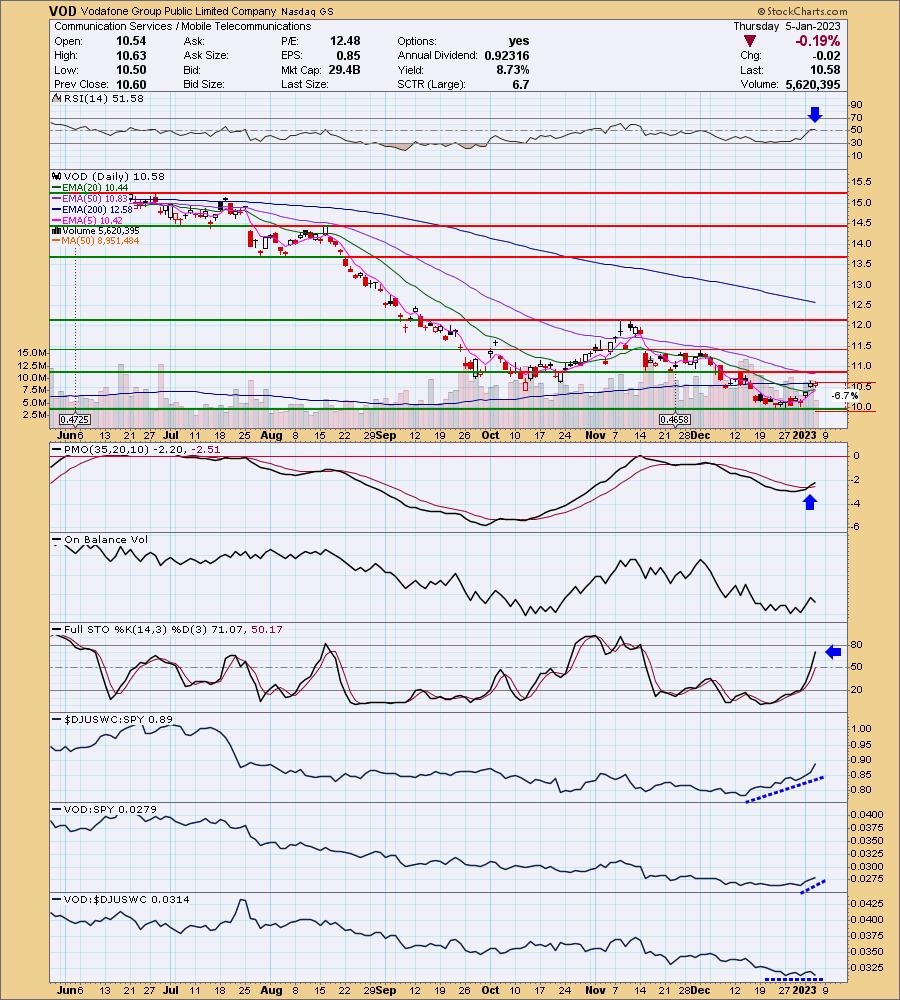
Predefined Scans Triggered: P&F Descending Triple Bottom Breakdown, Hollow Red Candles, P&F Double Bottom Breakout and Ichimoku Cloud Turned Red.
VOD is up +0.28% in after hours trading. The telecom industry groups are rallying, you can see the rising relative strength for Mobile Telecom in particular on this chart. This stock has been completely and thoroughly beat down, but it is now showing signs of life and a reversal like this could be lucrative. The RSI just moved positive and the PMO is on a new crossover BUY signal. Stochastics are rising strongly. If it has one problem, it would be its relative underperformance against the group. I expect this is a function of its price being hit so hard. The nice thing with this one is there is a lot of upside potential and you only have to set a 6.7% stop around $9.87.
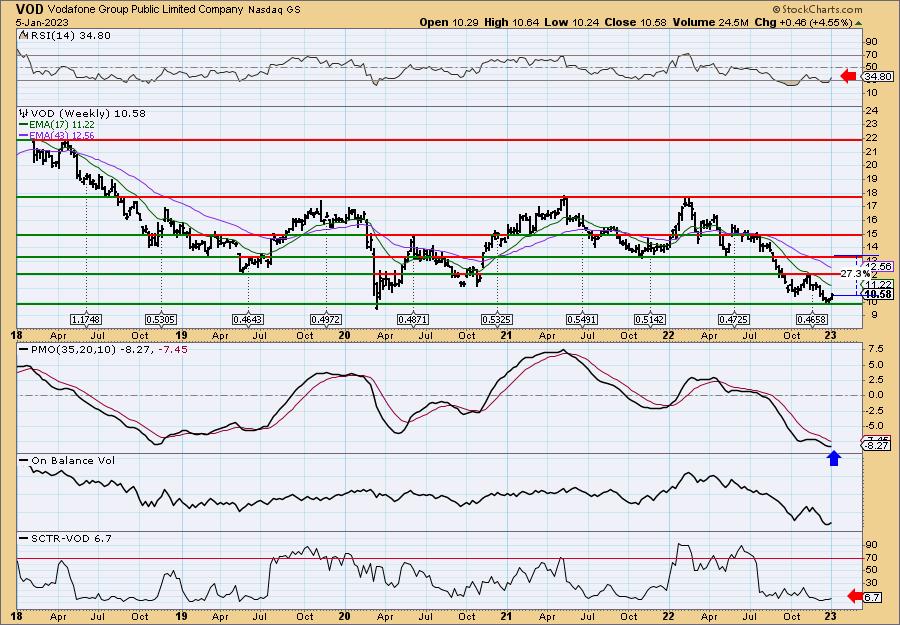
Price is bouncing off very long-term support. If it continues to rally it would form a bullish double-bottom pattern. Currently the weekly RSI is negative, but it is rising out of oversold territory. The PMO is falling, but is turning up. The SCTR shows us how beat down this stock really is.
Don't forget, on Thursdays I look at reader-requested symbols, click HERE to send me an email. I read every email I receive and try to answer them all!
Current Market Outlook:
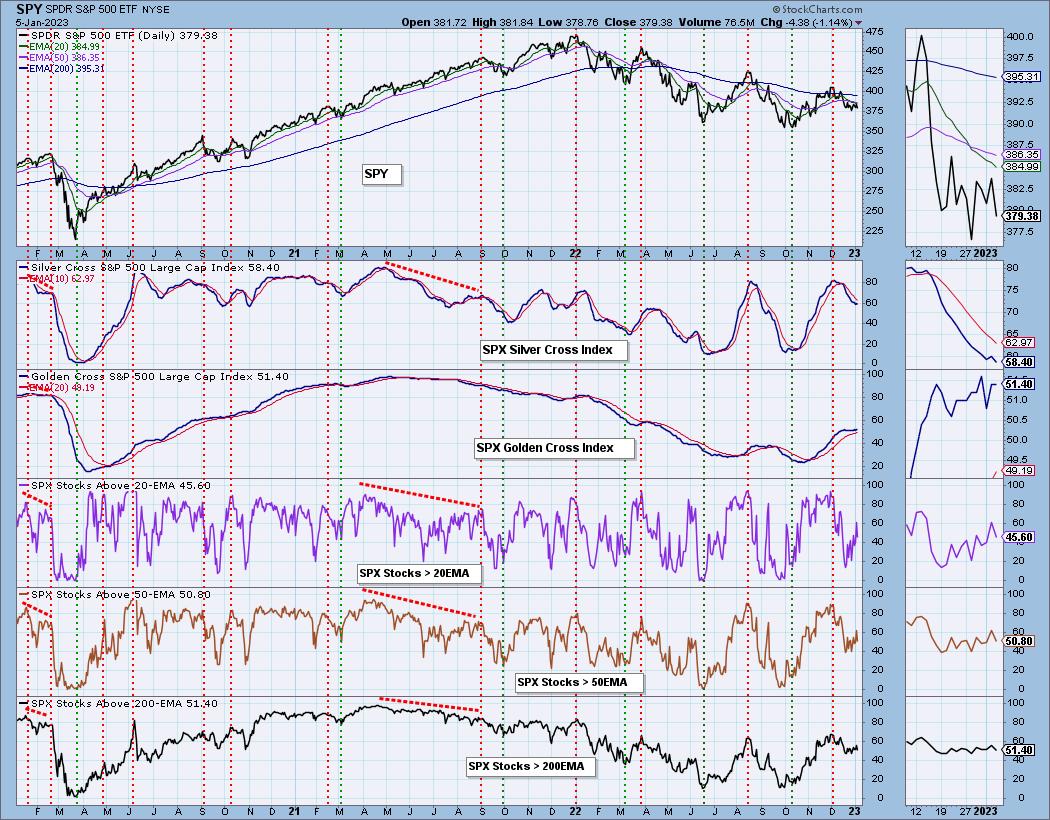
Market Environment: It is important to consider the odds for success by assessing the market tides. The following chart uses different methodologies for objectively showing the depth and trend of participation for intermediate- and long-term time frames.
- The Silver Cross Index (SCI) shows the percentage of SPX stocks on IT Trend Model BUY signals (20-EMA > 50-EMA)
- The Golden Cross Index (GCI) shows the percentage of SPX stocks on LT Trend Model BUY signals (50-EMA > 200-EMA)
Don't forget that as a "Diamonds" member, you have access to our GCI/SCI curated ChartList on DecisionPoint.com. You'll find it under "Members Only" links on the left side on the Blogs and Links Page.
Here is the current chart:
Full Disclosure: I am 12% exposed with a 2% hedge.
I'm required to disclose if I currently own a stock I mention and/or may buy/short it within the next 72 hours.
"Technical Analysis is a windsock, not a crystal ball." - Carl Swenlin
(c) Copyright 2023 DecisionPoint.com
Watch the latest episode of DecisionPoint Trading Room with Carl & Erin Swenlin on Mondays 7:00p EST or on the DecisionPoint playlist on the StockCharts TV YouTube channel here!
NOTE: The stocks reported herein are from mechanical trading model scans that are based upon moving average relationships, momentum and volume. DecisionPoint analysis is then applied to get five selections from the scans. The selections given should prompt readers to do a chart review using their own analysis process. This letter is not a call for a specific action to buy, sell or short any of the stocks provided. There are NO sure things or guaranteed returns on the daily selection of "Diamonds in the Rough."
Regarding BUY/SELL Signals: The signal status reported herein is based upon mechanical trading model signals and crossovers. They define the implied bias of the price index/stock based upon moving average relationships and momentum, but they do not necessarily call for a specific action. They are information flags that should prompt chart review. Further, they do not call for continuous buying or selling during the life of the signal. For example, a BUY signal will probably (but not necessarily) return the best results if action is taken soon after the signal is generated. Additional opportunities for buying may be found as price zigzags higher, but the trader must look for optimum entry points. Conversely, exit points to preserve gains (or minimize losses) may be evident before the model mechanically closes the signal.
Helpful DecisionPoint Links:
DecisionPoint Shared ChartList and DecisionPoint Chart Gallery
Price Momentum Oscillator (PMO)
Swenlin Trading Oscillators (STO-B and STO-V)
For more links, go to DecisionPoint.com