
There were a fair amount of requests today and honestly I'm happy about it. I ran my scans as I always do and I really didn't see anything I liked. Among your picks, I did find some I liked. I think you will too.
I had a great question come in for Mailbag:
How do you trade where there is divergence between Sector/Industry vs the stock?
Answer: I often say that half of a stock's price movement is attributed to what the sector and industry group are doing. This is why I use relative strength lines on my charts. A divergence happens frequently. I rely primarily on the Price Momentum Oscillator (PMO), RSI, Stochastics and price action--price action is first. Relative strength sets the backdrop. I don't really trade off relative strength. However, it does tell me if the stock has an uphill battle or not. If price action is sufficiently bullish (favorable trend and condition), I still consider them a candidate. I will say that I won't pick a stock that is underperforming the market on its own. If I like a sector (currently I like Technology and Materials), I will overlook an underperforming industry group.
Hopefully my answer is helpful. In general you should be able to find stocks that are in outperforming industry groups. If in doubt, take a look at the industry group's chart. If price action is favorable overall, then it shouldn't worry you.
Don't forget to sign up for tomorrow's Diamond Mine trading room! We have an official chat moderator who has been keeping the chat interesting (thank you, Fred!) and inviting all to participate. I find that while you learn from me, you can also learn from each other. You are like-minded and clearly brilliant given you are all part of the Diamonds community!
Good Luck & Good Trading,
Erin
Today's "Diamonds in the Rough": NEM, NVDA, TME and ZYME.
Other Requests: ELF, ISEE, FL, SBUX, BHP, VALE and NXGN.

RECORDING LINK (1/20/2023):
Topic: DecisionPoint Diamond Mine (1/20/2023) LIVE Trading Room
Passcode: January#20
REGISTRATION for 1/27/2022:
When: Jan 27, 2023 09:00 AM Pacific Time (US and Canada)
Topic: DecisionPoint Diamond Mine (1/27/2022) LIVE Trading Room
Register in advance for this webinar HERE
After registering, you will receive a confirmation email containing information about joining the webinar.

Here is the last recording (1/23):
Welcome to DecisionPoint Diamonds, wherein I highlight ten "Diamonds in the Rough" per week. These are selected from the results of my DecisionPoint Scans which search for stocks that could benefit from the trend and condition of the market. Remember, these are not recommendations to buy or sell, but are the most interesting of the stocks that surfaced in my scans. My objective is to save you the work of the initial, tedious culling process, but you need to apply your own analysis to see if these stocks pique your interest as well. There are no guaranteed winners here!
"Predefined Scans Triggered" are taken from StockCharts.com using the "Symbol Summary" option instead of a "SharpChart" on the workbench.
Stop levels are all rounded down.
BHP Group Limited (BHP)
EARNINGS: 02/20/2023
BHP Group Ltd. engages in the exploration, development, production and processing of iron ore, metallurgical coal and copper. It operates through the following segments: Petroleum, Copper, Iron Ore, and Coal. The Petroleum segment explores, develops and produces oil and gas. The Copper segment refers to the mining of copper, silver, lead, zinc, molybdenum, uranium and gold. The Iron Ore segment refers to mining of iron ore. The Coal segment focuses on metallurgical coal and energy coal. The company was founded on August 13, 1885 and is headquartered in Melbourne, Australia.
Predefined Scans Triggered: New 52-week Highs, Filled Black Candles, P&F Ascending Triple Top Breakout and P&F Double top Breakout.
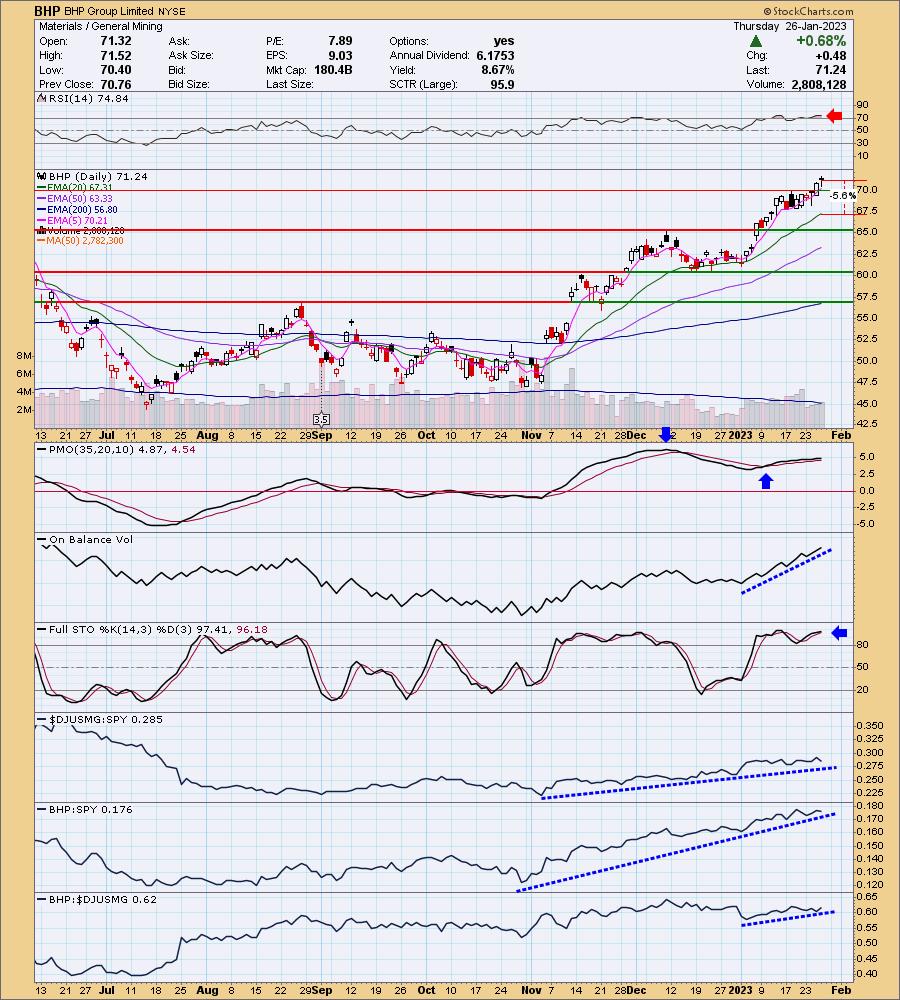
BHP is down -0.56% in after hours trading. Yesterday saw a very short-term breakout. This appears to be a "winner that keeps on winning". It has some help as the Miners in general are on fire. If you're going to step into this industry group, based on relative strength it should be a top contender. It also doesn't hurt that it has an almost 9% yield. My biggest heartburn on the chart is that the RSI is very overbought. The PMO is very close to overbought, but as long as it is trending higher, I'm happy. Stochastics look great as they oscillate above 80. Remember, overbought conditions can persist when a stock is in a strong bull market rally (i.e. BHP itself is in a bull market). The stop is set below the prior cluster lows and the 20-day EMA at 5.6% around 67.25.
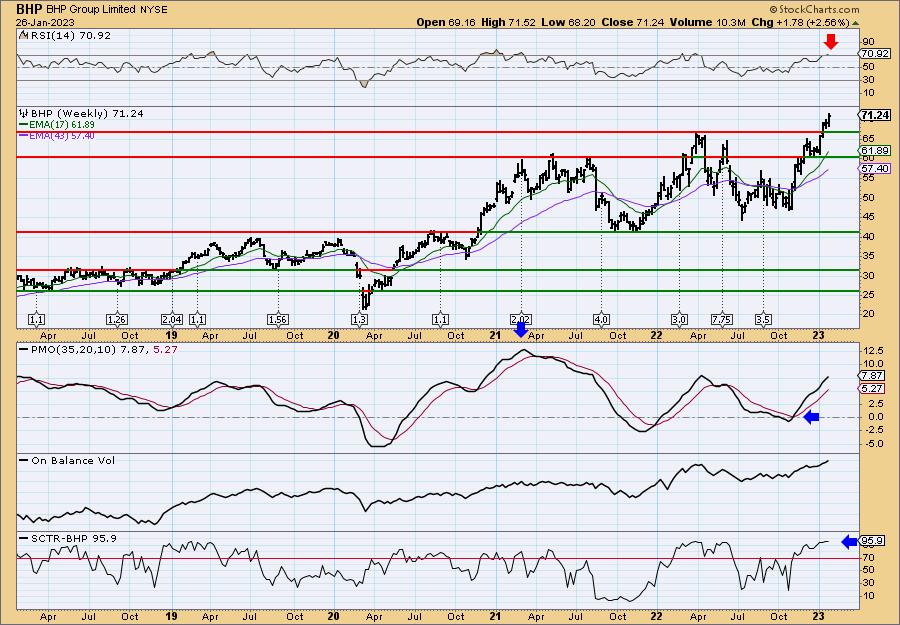
The weekly chart shows us that BHP is not only making 52-week highs, it is making all-time highs. The weekly RSI is slightly overbought but acceptable. The PMO is on an oversold BUY signal and based on 2021, it is not overbought. Best of all, it has a strong 96% StockCharts Technical Rank (SCTR). [The StockCharts Technical Rank (SCTR) "hot zone" is above 70% which implies the stock is in the upper 30% of all stocks within its "universe" (large-, mid-, small-caps and ETFs) as far as trend and condition primarily in the intermediate and long terms.] Since price is at all-time highs, consider an upside target of 15% around 81.93.
NVIDIA Corp. (NVDA)
EARNINGS: 02/22/2023 (AMC)
NVIDIA Corp. engages in the design and manufacture of computer graphics processors, chipsets, and related multimedia software. It operates through the following segments: Graphics Processing Unit (GPU), Tegra Processor, and All Other. The GPU segment consists of product brands, including GeForce for gamers, Quadro for designers, Tesla and DGX for AI data scientists and big data researchers, and GRID for cloud-based visual computing users. The Tegra Processor segment integrates an entire computer onto a single chip and incorporates GPUs and multi-core CPUs to drive supercomputing for autonomous robots, drones, and cars, as well as for consoles and mobile gaming and entertainment devices. The All Other segment refers to the stock-based compensation expense, corporate infrastructure and support costs, acquisition-related costs, legal settlement costs, and other non-recurring charges. The company was founded by Jen Hsun Huang, Chris A. Malachowsky, and Curtis R. Priem in April 1993 and is headquartered in Santa Clara, CA.
Predefined Scans Triggered: Moved Above Upper Price Channel, P&F Ascending Triple Top Breakout and P&F Double Top Breakout.
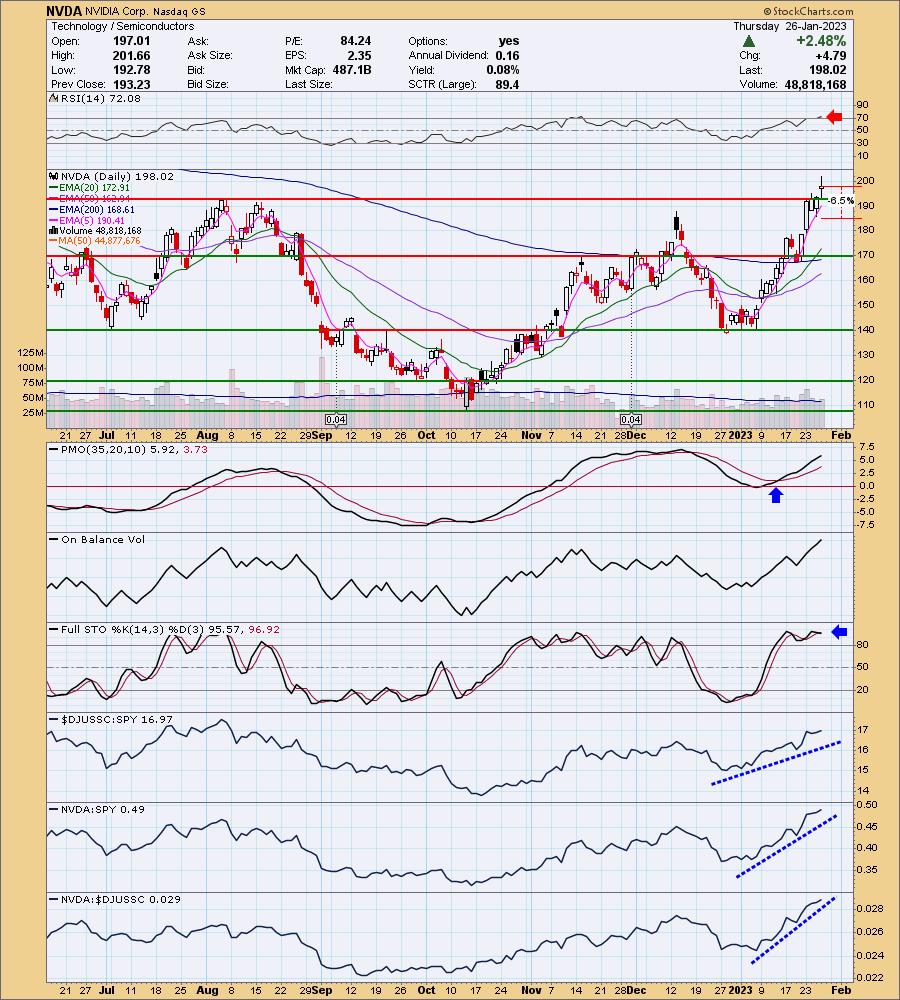
NVDA is down -2.05% in after hours trading which means you may have an opportunity to buy it on a pullback toward prior resistance. Like BHP above the one negative to this chart is the overbought RSI. The PMO is getting a bit overbought too, but is rising nicely. Stochastics are oscillating above 80. I like today's breakout and relative strength studies. The stop is set at 6.5% around 185.14.
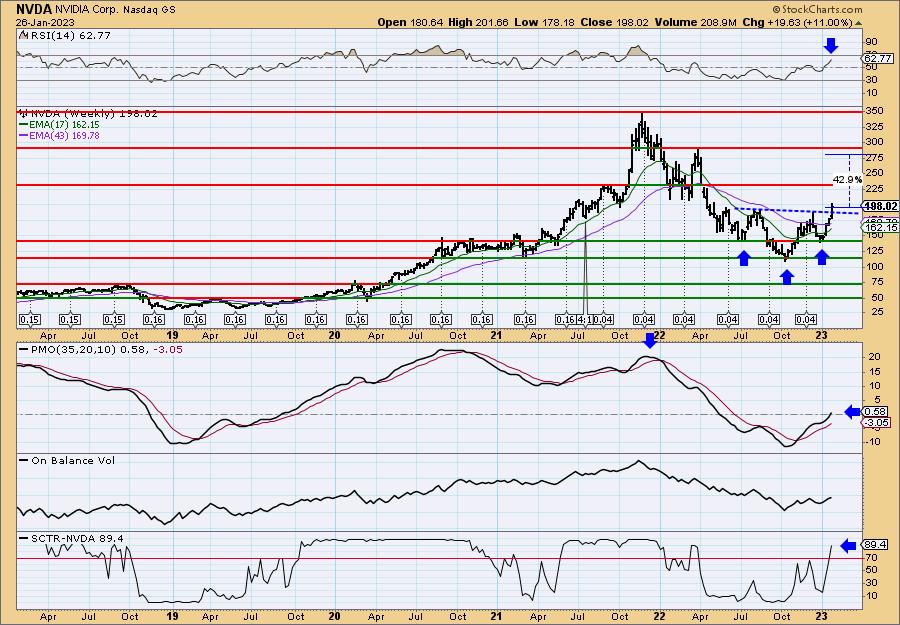
I love the weekly chart! Everything is going right. There is a giant reverse head and shoulders that looks "textbook" to me. This week we are seeing confirmation of the pattern as it is up 11% so far this week. The weekly RSI is positive and the weekly PMO is rising after a move above the zero line. The SCTR is a strong 89.4%. Using the upside target of the reverse head and shoulders, we get an upside target a little over 275.00.
Tencent Music Entertainment Group (TME)
EARNINGS: 03/20/2023 (BMO)
Tencent Music Entertainment Group is a holding company, which engages in the operation of an online music and audio entertainment platform. Its platform is composed of online music, online audio, online karaoke, music-centric live streaming, and online concert services. The company was founded on June 6, 2012 and is headquartered in Shenzhen, China.
Predefined Scans Triggered: New CCI Buy Signals, Parabolic SAR Buy Signals, P&F Double Top Breakout and P&F Triple Top Breakout.
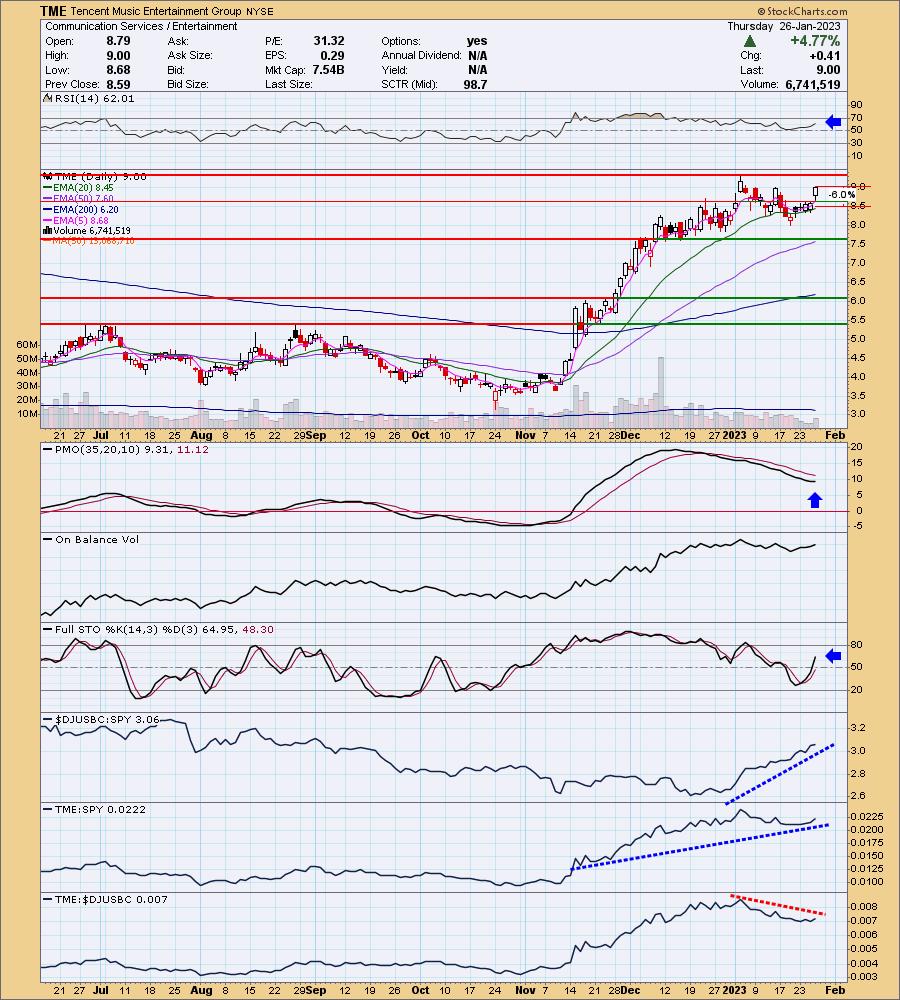
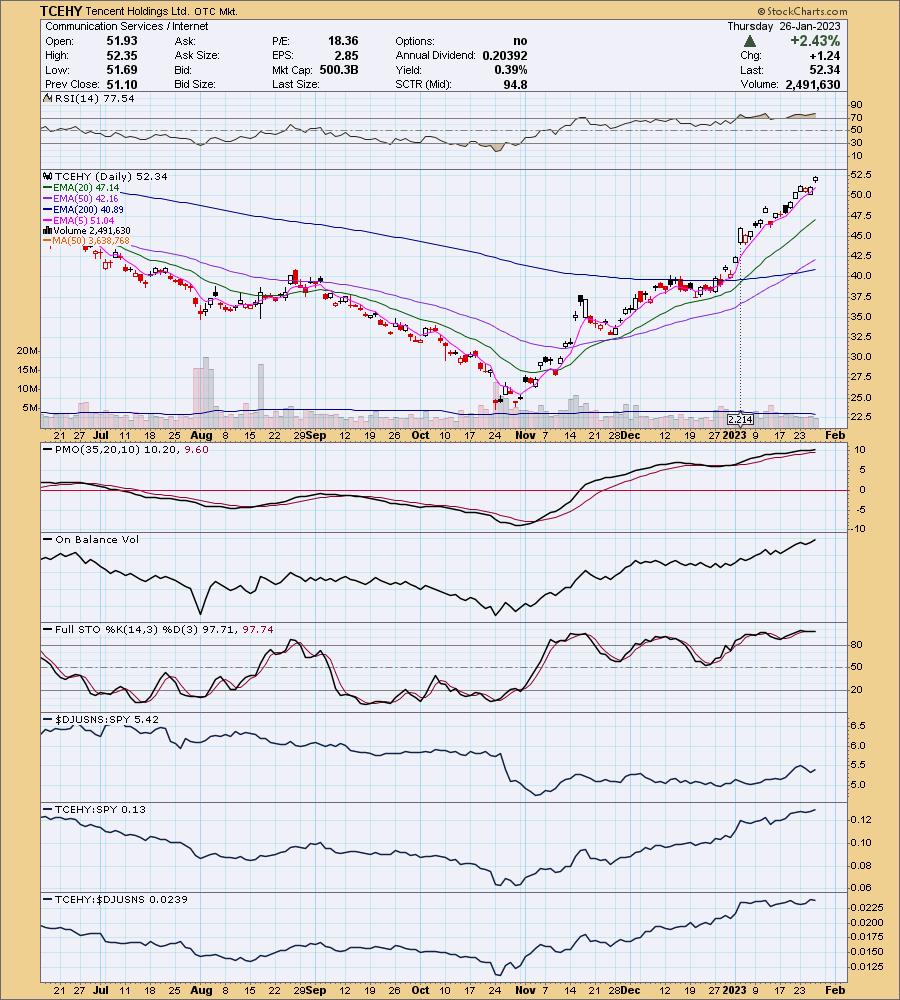
TME is down -1.56% in after hours trading. Another symbol for this company, which has been on my radar, is TCEHY. I'm including its daily chart below TME's for comparison. That chart actually looks better, but this was requested. TCEHY is still advancing while this one is looking a bit "toppy". However, it could see some outperformance as the indicators are just beginning to mature. The RSI is positive and rising. The PMO is turning back up. Stochastics are rising in positive territory. Relative strength I believe tells the story. TCEHY has been a more consistent performer. The stop is set below support at 6% around 8.46.
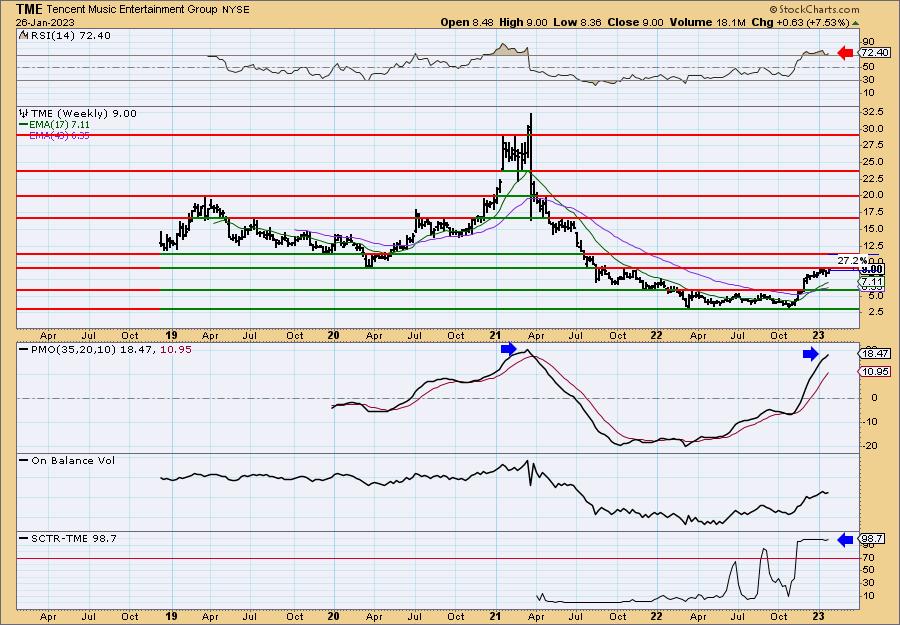
The weekly RSI is overbought which I don't like and the weekly PMO is also getting overbought. However, we can't sneeze at a 98.7% SCTR! If TME manages a breakout, upside potential to the next level of resistance is over 27%.
Zymeworks Inc. (ZYME)
EARNINGS: 02/23/2023 (AMC)
Zymeworks Inc. is a biopharmaceutical company. It engages in the discovery, development, and commercialization of multifunctional biotherapeutics, initially focused on the treatment of cancer. The company is headquartered in Middletown, DE.
Predefined Scans Triggered: P&F Ascending Triple Top Breakout and P&F Double Top Breakout.
ZYME is up +0.51% in after hours trading. The chart is pretty good. The RSI is positive and Stochastics are rising again. The PMO is turning over a bit in overbought territory so that is a bit worrisome. Relative strength is not good for the Biotechs and I'm not super happy about the Healthcare sector right now either so I'm a bit on the fence about this request. One of the reasons I did pick it was the pennant on a flagpole which is bullish. The stop is set below support at 6.5% around 9.11.
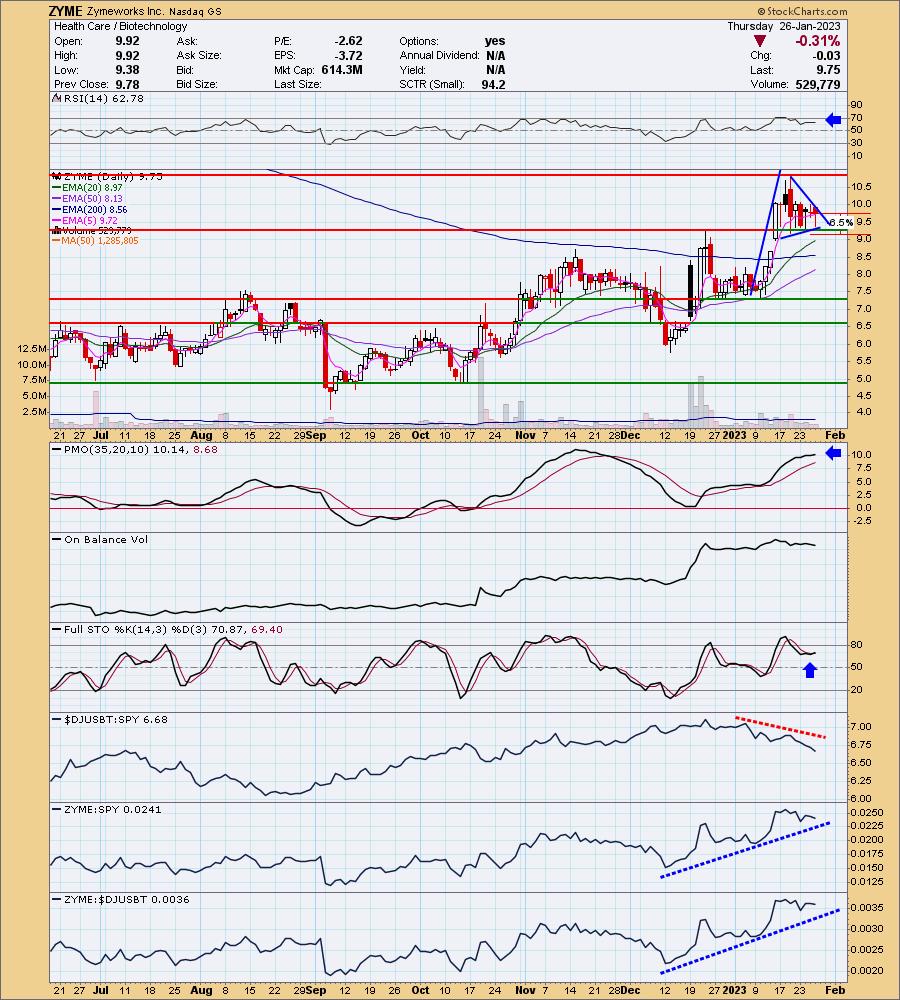
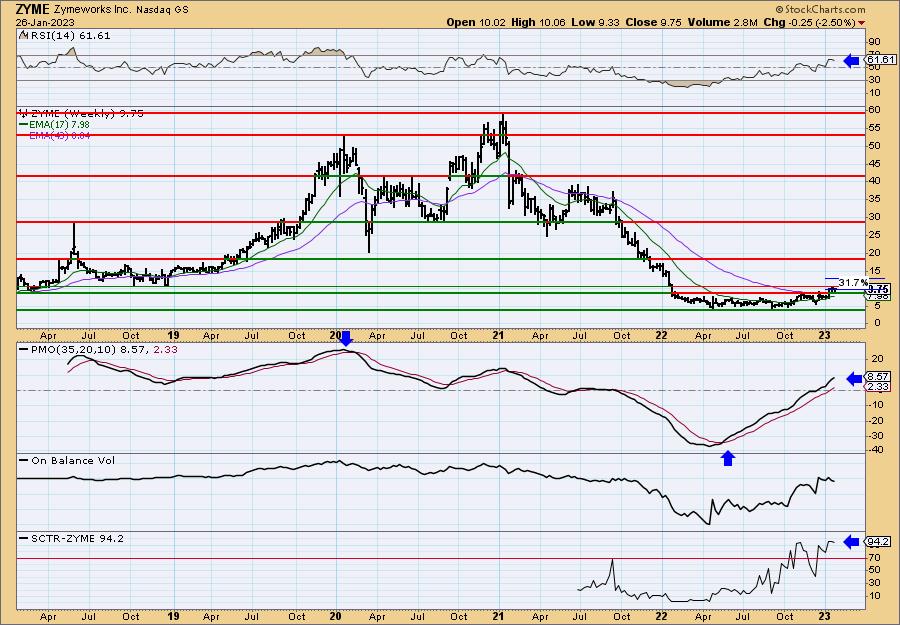
The weekly chart is a bit of an eye test due to the crazy volatility that is characteristic of Biotechs. The weekly RSI is positive and I like that the weekly PMO is back above the zero line and rising. The SCTR is excellent at 94.2%. Upside potential should it breakout is astounding, but I opted to put it in the center of the 2018 trading channel.
Don't forget, on Thursdays I look at reader-requested symbols, click HERE to send me an email. I read every email I receive and try to answer them all!
Current Market Outlook:
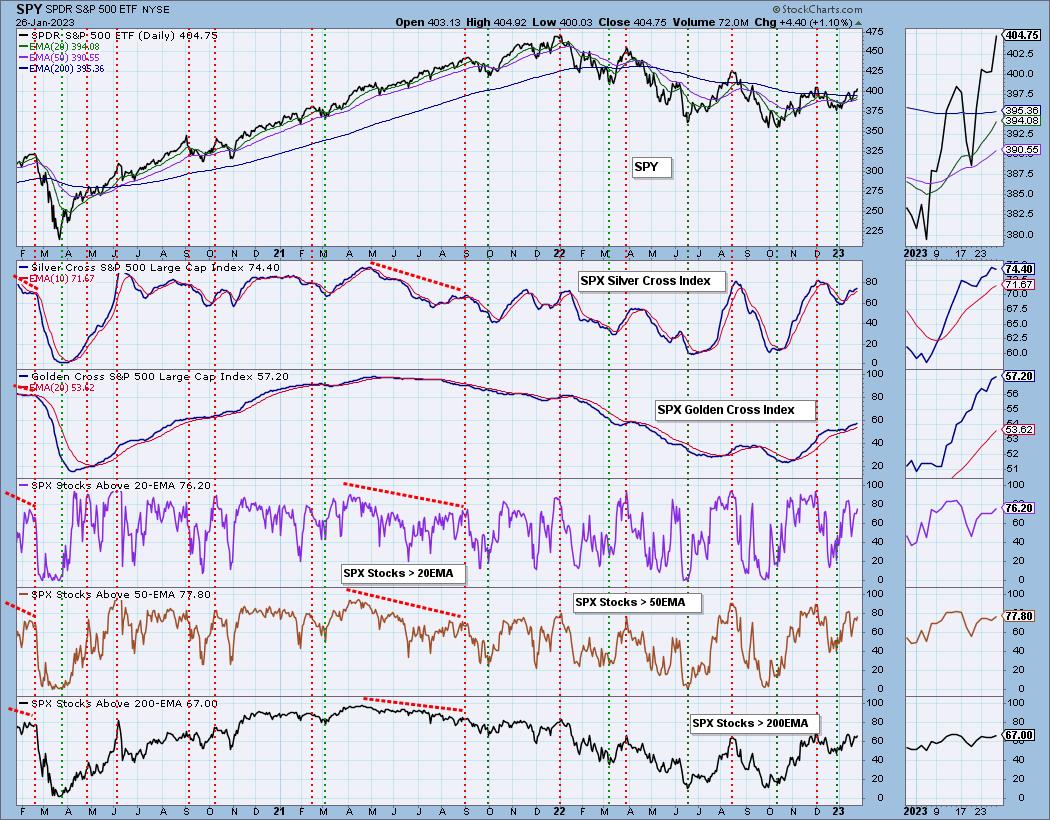
Market Environment: It is important to consider the odds for success by assessing the market tides. The following chart uses different methodologies for objectively showing the depth and trend of participation for intermediate- and long-term time frames.
- The Silver Cross Index (SCI) shows the percentage of SPX stocks on IT Trend Model BUY signals (20-EMA > 50-EMA)
- The Golden Cross Index (GCI) shows the percentage of SPX stocks on LT Trend Model BUY signals (50-EMA > 200-EMA)
Don't forget that as a "Diamonds" member, you have access to our GCI/SCI curated ChartList on DecisionPoint.com. You'll find it under "Members Only" links on the left side on the Blogs and Links Page.
Here is the current chart:
Full Disclosure: I am 15% exposed.
I'm required to disclose if I currently own a stock I mention and/or may buy/short it within the next 72 hours.
"Technical Analysis is a windsock, not a crystal ball." - Carl Swenlin
(c) Copyright 2023 DecisionPoint.com
Watch the latest episode of DecisionPoint Trading Room with Carl & Erin Swenlin on Mondays 7:00p EST or on the DecisionPoint playlist on the StockCharts TV YouTube channel here!
NOTE: The stocks reported herein are from mechanical trading model scans that are based upon moving average relationships, momentum and volume. DecisionPoint analysis is then applied to get five selections from the scans. The selections given should prompt readers to do a chart review using their own analysis process. This letter is not a call for a specific action to buy, sell or short any of the stocks provided. There are NO sure things or guaranteed returns on the daily selection of "Diamonds in the Rough."
Regarding BUY/SELL Signals: The signal status reported herein is based upon mechanical trading model signals and crossovers. They define the implied bias of the price index/stock based upon moving average relationships and momentum, but they do not necessarily call for a specific action. They are information flags that should prompt chart review. Further, they do not call for continuous buying or selling during the life of the signal. For example, a BUY signal will probably (but not necessarily) return the best results if action is taken soon after the signal is generated. Additional opportunities for buying may be found as price zigzags higher, but the trader must look for optimum entry points. Conversely, exit points to preserve gains (or minimize losses) may be evident before the model mechanically closes the signal.
Helpful DecisionPoint Links:
DecisionPoint Shared ChartList and DecisionPoint Chart Gallery
Price Momentum Oscillator (PMO)
Swenlin Trading Oscillators (STO-B and STO-V)
For more links, go to DecisionPoint.com