
Welcome to another week of Diamonds! This morning I was on "Your Daily Five" for StockChartsTV. I always look for a good trade idea to present at the end. It was really hard. The scans weren't producing in the sectors I wanted. However, I did find SNAP which looks interesting. I also found two bank stocks, Northwest Bancshares (NWBI) and Old Second Bancorp (OSBC) that looked interesting for a Twitter interview I did earlier today (it will be on Twitter tomorrow).
Funny thing is, I'm not presenting any of the stocks mentioned above. Why? I found better ones after the market closed. Still take a look at SNAP, NWBI and OSBC. The charts do have merit.
The "new faces" I'm referring to are two sectors that I was surprised to see in the results today, Industrials and Materials. I have a stock from each and a Consumer Discretionary stock that is lined up nicely.
Overall I don't like how the market is acting. Our indicators are ominous right now so continue to exercise restraint and set some stops.
Today is my birthday! Yay! So, I'm going to end it here so I can get back to celebrating!
Good Luck & Good Trading,
Erin
Today's "Diamonds in the Rough": GBX, RYAM and TLYS.
Runner-ups: AZO, NWBI, PAGP, PTVE, SNAP, SNDR, TRN and VTRS.

RECORDING LINK (1/27/2023):
Topic: DecisionPoint Diamond Mine (1/27/2023) LIVE Trading Room
Passcode: January#27
REGISTRATION for 1/27/2022:
When: Feb 3, 2023 09:00 AM Pacific Time (US and Canada)
Topic: DecisionPoint Diamond Mine (2/3/2023) LIVE Trading Room
Register in advance for this webinar HERE
After registering, you will receive a confirmation email containing information about joining the webinar.

Here is the last recording (1/30):
Welcome to DecisionPoint Diamonds, wherein I highlight ten "Diamonds in the Rough" per week. These are selected from the results of my DecisionPoint Scans which search for stocks that could benefit from the trend and condition of the market. Remember, these are not recommendations to buy or sell, but are the most interesting of the stocks that surfaced in my scans. My objective is to save you the work of the initial, tedious culling process, but you need to apply your own analysis to see if these stocks pique your interest as well. There are no guaranteed winners here!
"Predefined Scans Triggered" are taken from StockCharts.com using the "Symbol Summary" option instead of a "SharpChart" on the workbench.
Stop levels are all rounded down.
Greenbrier Cos, Inc. (GBX)
EARNINGS: 04/06/2023 (BMO)
Greenbrier Cos., Inc. engages in the design, manufacture and marketing of railroad freight car equipment. It operates through the following segments: Manufacturing, Maintenance Services, Leasing & Management Services, and Corporate. The Manufacturing segment includes double-stack intermodal railcars, tank cars, and marine vessels. The Maintenance Services segment includes wheel services, railcar maintenance, and component part manufacturing. The Leasing & Management Services segment covers the leasing and management services in North America through its subsidiaries. The company was founded in 1919 and is headquartered in Lake Oswego, OR.
Predefined Scans Triggered: None.
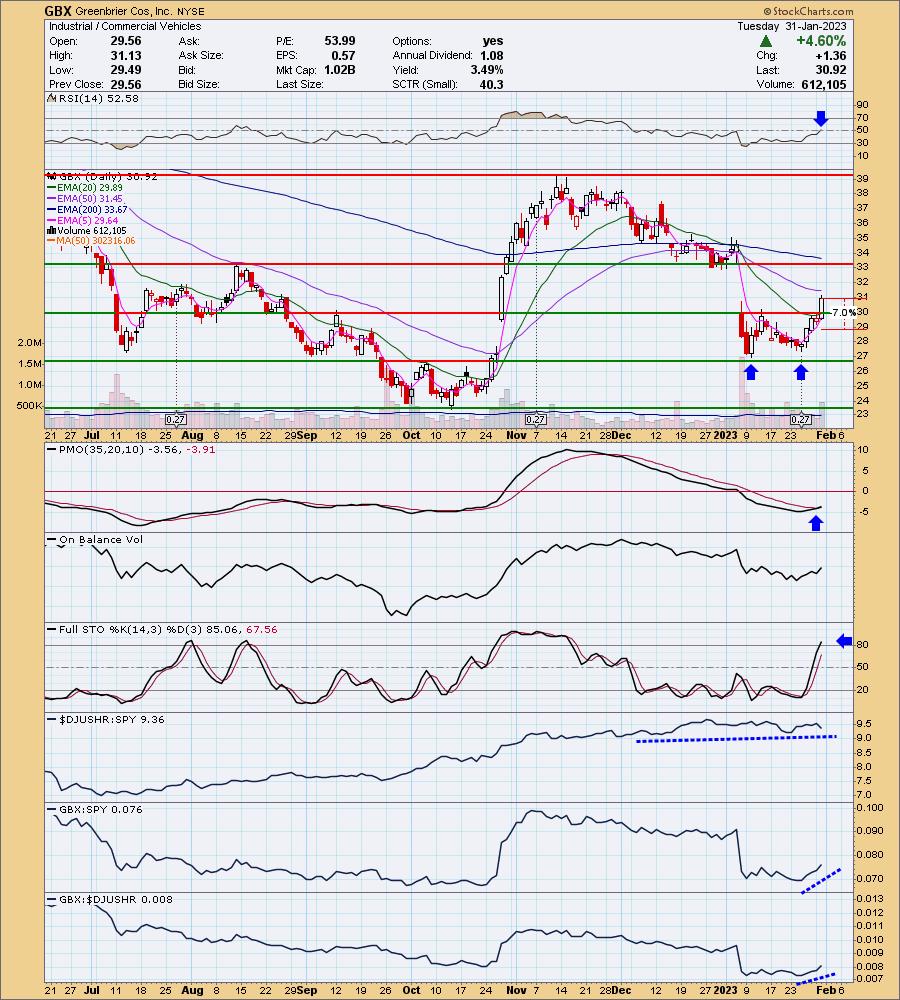
GBX is unchanged in after hours trading. Here we have a confirmed bullish double-bottom chart pattern. The RSI is now in positive territory and rising. The PMO just triggered a crossover BUY signal. If the pattern reaches its minimum upside target around $33, it would close the price gap. That would imply an even higher move. Relative strength for the industry group isn't great, but this one is beginning to outperform the market nicely. The stop is set well below the confirmation line of the double-bottom around 7% or $28.74.
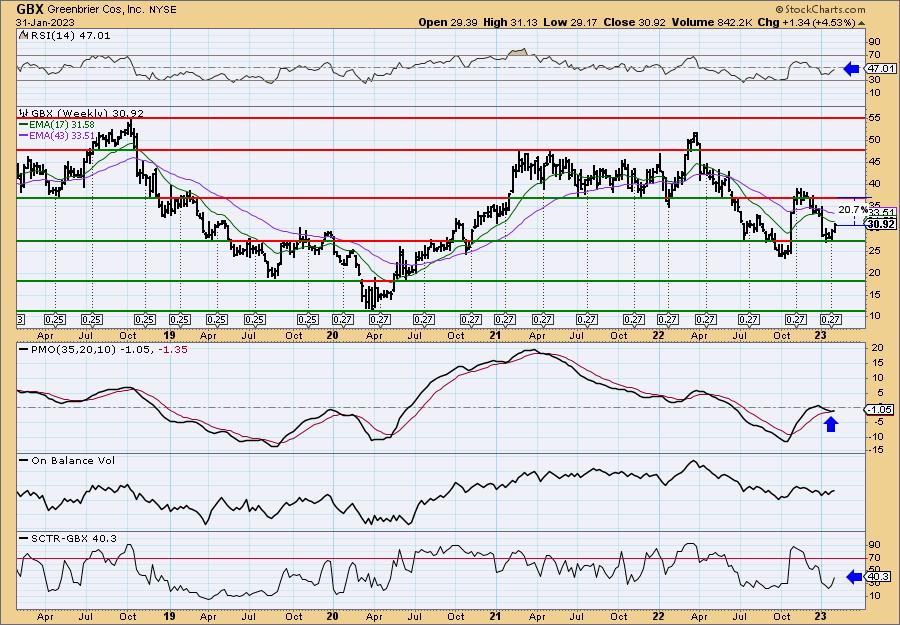
There is a double-bottom trying to form on the weekly chart. The weekly RSI is negative, but rising. The weekly PMO is turning back up above the signal line. The StockCharts Technical Rank (SCTR) is not great at 40.3%, but it is improving. This looks like a stock in reversal. Upside potential is over 20%.
Rayonier Advanced Materials Inc. (RYAM)
EARNINGS: 02/28/2023 (AMC)
Rayonier Advanced Materials, Inc. engages in the production and sale of cellulose products, which is a natural polymer commonly used in the production of cellphones and computer screens, filters, and pharmaceuticals. It operates through the following segments: High Purity Cellulose, Paperboard, High-Yield Pulp, and Corporate. The High Purity Cellulose segment manufactures and markets high purity cellulose, which is sold as either cellulose specialties or commodity products in U.S., Canada, and France. The Paperboard segment is composed of paperboard, which is used for printing documents, brochures, promotional materials, packaging, paperback book or catalog covers, file folders, tags, and tickets. The High-Yield Pulp segment is involved in the production of pulp and newsprint in Canada. The Corporate segment consists of the senior management, accounting, information systems, human resources, treasury, tax, and legal administrative functions that provide support services to the operating business units. The company was founded in 1926 and is headquartered in Jacksonville, FL.
Predefined Scans Triggered: Elder Bar Turned Green and Bullish MACD Crossovers.
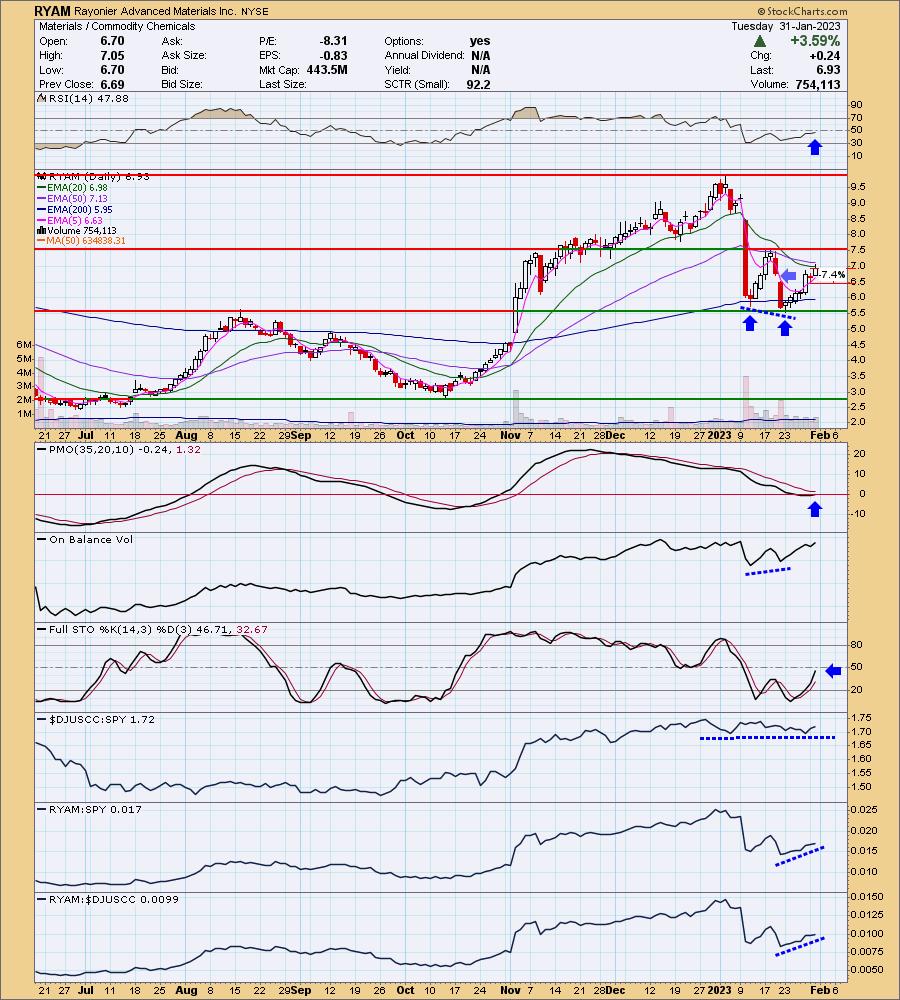
RYAM is down -0.87% in after hours trading. This has a similar look to GBX, but it is a lower priced stock so upside potential is higher...of course, so is downside potential. Always position size wisely on low priced stocks. Here we have a double-bottom, but unlike GBX, it hasn't been confirmed with a breakout above the confirmation line at $7.50. The RSI is negative but rising. The PMO has just turned up. I also spotted a positive OBV divergence going into this rally. Stochastics are below net neutral (50), but are rising quickly. The group isn't that great relatively, but RYAM is increasing relative strength. The stop is set below the gap I pointed out with my light blue arrow around 7.4% or $6.41.
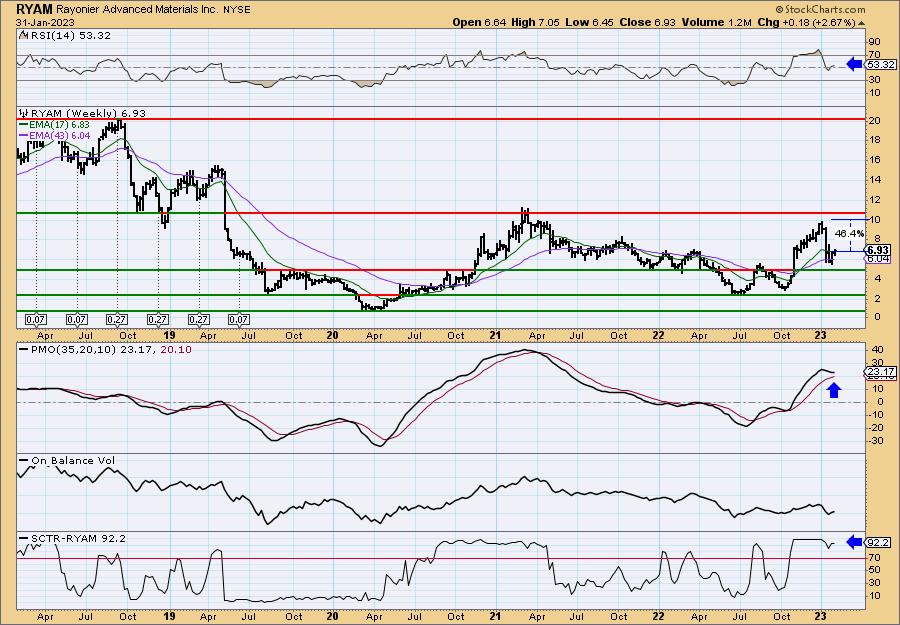
The weekly PMO may look a bit negative, but it is decelerating its decline now. The weekly RSI is now back in positive territory and the SCTR is 92.2%. Upside potential has me excited about this one, but remember downside potential is severe should it decide to reverse.
Tilly's Inc. (TLYS)
EARNINGS: 03/09/2023 (AMC)
Tilly's, Inc. engages in the retail of casual apparel, footwear, and accessories. Its stores are located in retail centers, including malls, lifestyle centers, power centers, community centers, outlet centers, and street-front locations. The company was founded by Hezy Shaked and Tilly Levine in 1982 and is headquartered in Irvine, CA.
Predefined Scans Triggered: Entered Ichimoku Cloud.
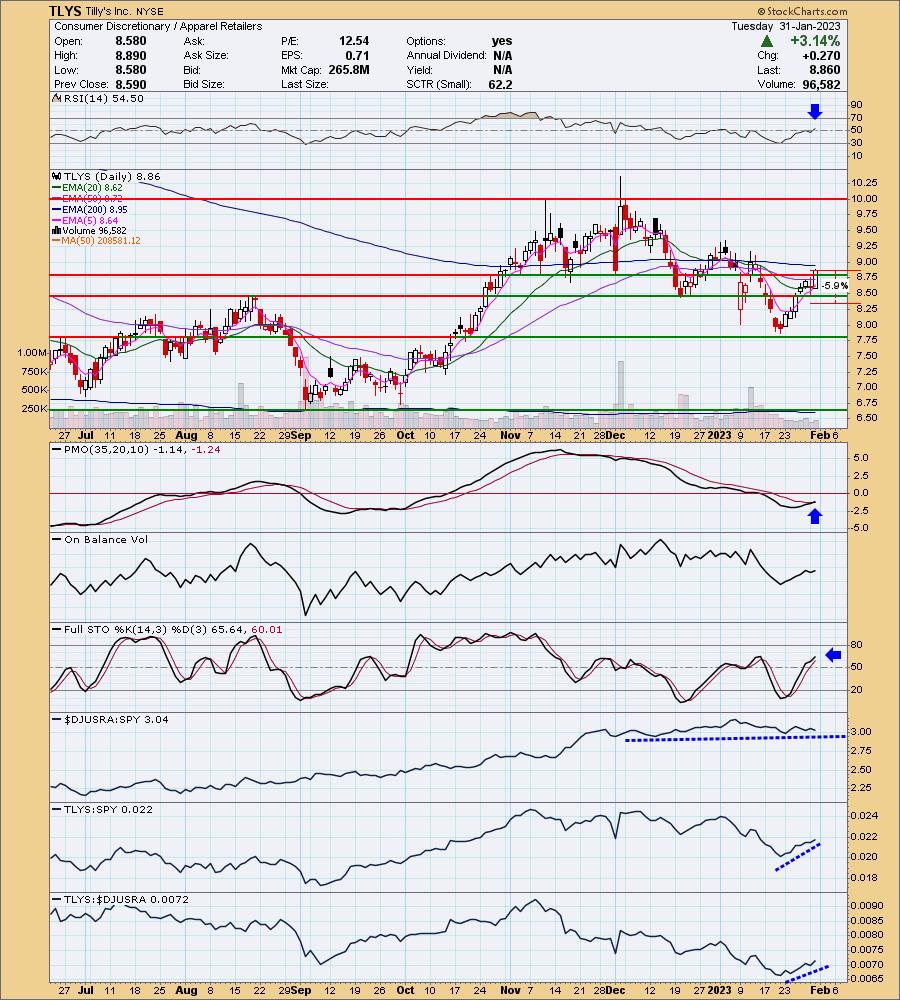
TLYS is unchanged in after hours trading. Today saw a large bullish engulfing candlestick. It's not a standard one, but I do spot a "V" bottom. Now that more than 1/3rd of the pattern has been retraced, the expectation is a breakout above the left side of the "V". The RSI just moved into positive territory and the PMO has triggered a crossover BUY signal. Stochastics are rising toward 80 in positive territory. Relative strength for TLYS is strong even though the industry group is performing inline with the market. The stop is set at 5.9% around $8.33.
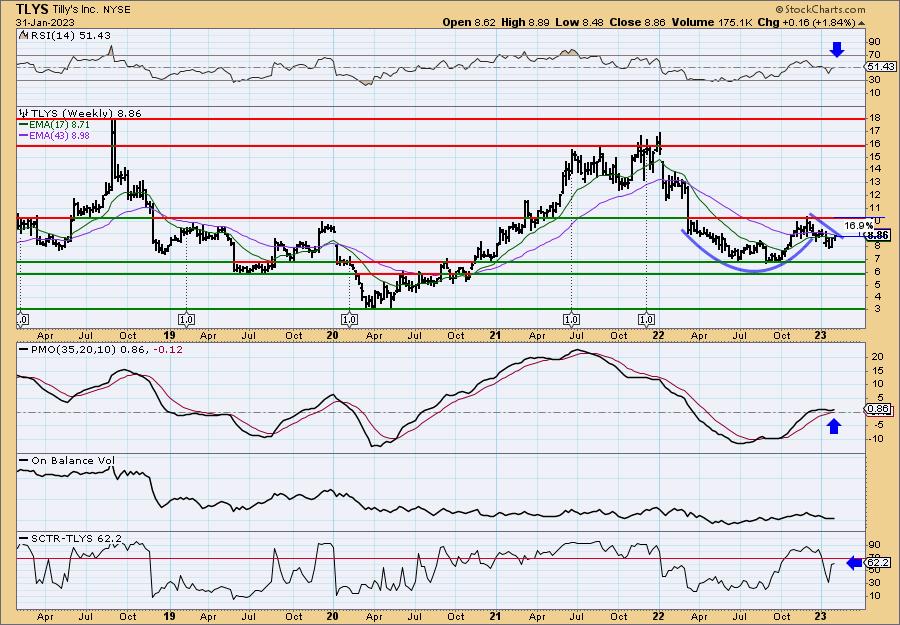
The weekly RSI just recaptured positive territory and best of all, the weekly PMO is rising after bottoming above the signal line. That's especially bullish. I see a cup with handle pattern. They are bullish. If price breaks the declining trend of the "handle", the expectation is a rally above the left side of the cup. The SCTR isn't in the "hot zone" above 70 ("hot zone" implies the stock is in the upper 30% of its universe (small-, mid-, large-caps and ETFs)), but it is improving and is a respectable 62.2%. I believe there is more upside potential here, a lot, but I don't want to get carried away.
Don't forget, on Thursdays I look at reader-requested symbols, click HERE to send me an email. I read every email I receive and try to answer them all!
Current Market Outlook:
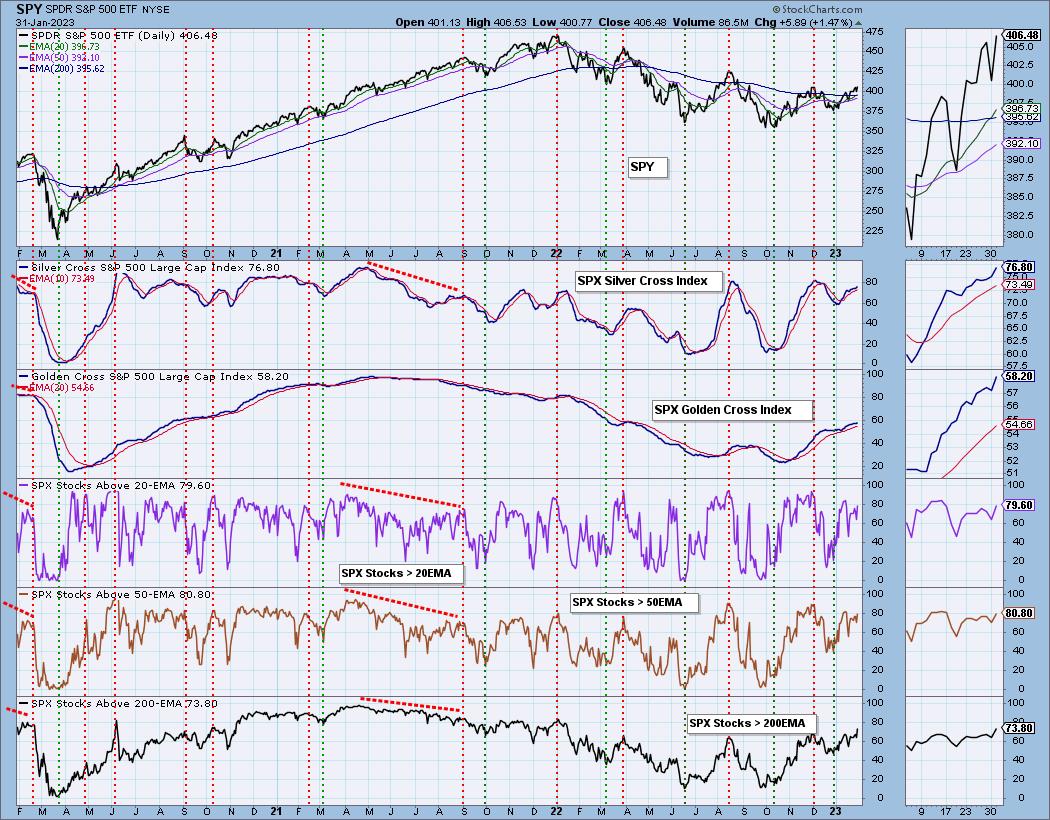
Market Environment: It is important to consider the odds for success by assessing the market tides. The following chart uses different methodologies for objectively showing the depth and trend of participation for intermediate- and long-term time frames.
- The Silver Cross Index (SCI) shows the percentage of SPX stocks on IT Trend Model BUY signals (20-EMA > 50-EMA)
- The Golden Cross Index (GCI) shows the percentage of SPX stocks on LT Trend Model BUY signals (50-EMA > 200-EMA)
Don't forget that as a "Diamonds" member, you have access to our GCI/SCI curated ChartList on DecisionPoint.com. You'll find it under "Members Only" links on the left side on the Blogs and Links Page.
Here is the current chart:
Full Disclosure: I am 15% exposed, but eyeing all three of these as I don't have a position in those sectors right now.
I'm required to disclose if I currently own a stock I mention and/or may buy/short it within the next 72 hours.
"Technical Analysis is a windsock, not a crystal ball." - Carl Swenlin
(c) Copyright 2023 DecisionPoint.com
Watch the latest episode of DecisionPoint Trading Room with Carl & Erin Swenlin on Mondays 7:00p EST or on the DecisionPoint playlist on the StockCharts TV YouTube channel here!
NOTE: The stocks reported herein are from mechanical trading model scans that are based upon moving average relationships, momentum and volume. DecisionPoint analysis is then applied to get five selections from the scans. The selections given should prompt readers to do a chart review using their own analysis process. This letter is not a call for a specific action to buy, sell or short any of the stocks provided. There are NO sure things or guaranteed returns on the daily selection of "Diamonds in the Rough."
Regarding BUY/SELL Signals: The signal status reported herein is based upon mechanical trading model signals and crossovers. They define the implied bias of the price index/stock based upon moving average relationships and momentum, but they do not necessarily call for a specific action. They are information flags that should prompt chart review. Further, they do not call for continuous buying or selling during the life of the signal. For example, a BUY signal will probably (but not necessarily) return the best results if action is taken soon after the signal is generated. Additional opportunities for buying may be found as price zigzags higher, but the trader must look for optimum entry points. Conversely, exit points to preserve gains (or minimize losses) may be evident before the model mechanically closes the signal.
Helpful DecisionPoint Links:
DecisionPoint Shared ChartList and DecisionPoint Chart Gallery
Price Momentum Oscillator (PMO)
Swenlin Trading Oscillators (STO-B and STO-V)
For more links, go to DecisionPoint.com