
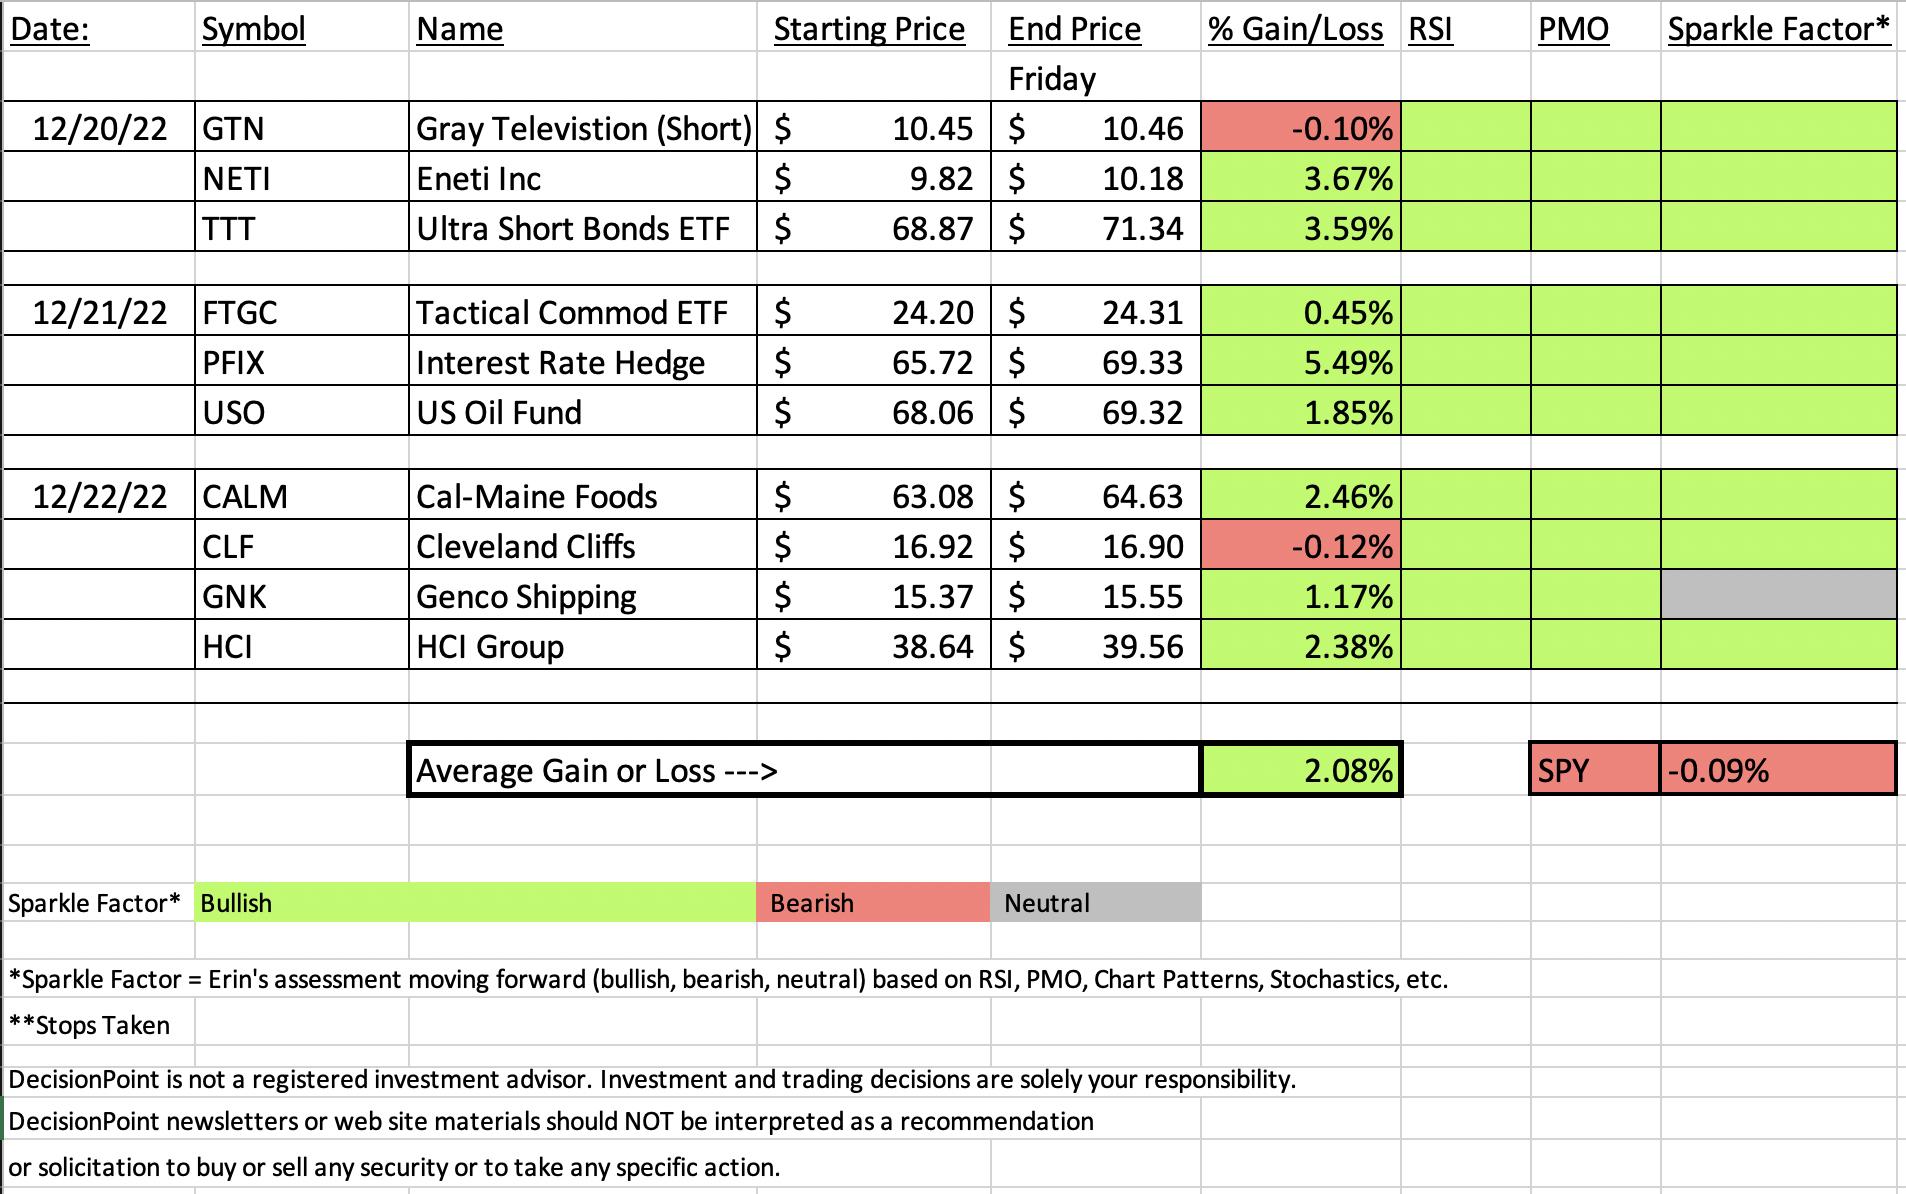
It was a great week for "Diamonds in the Rough". The market has had a bearish bias in the short term for some time which makes picking Diamonds particularly challenging.
This week all of the "Diamonds in the Rough" have potential moving forward. Only one stock I marked with a "neutral" or gray Sparkle Factor. This means that I am lukewarm on it moving forward. I see merit but I also see potential problems.
The "Darling" this week was the Interest Rate Hedge (PFIX). I knew Carl and I were onto something when rates began to curl back up. PFIX is an excellent hedge to the market and of course Bonds. I don't think it's too late for it either.
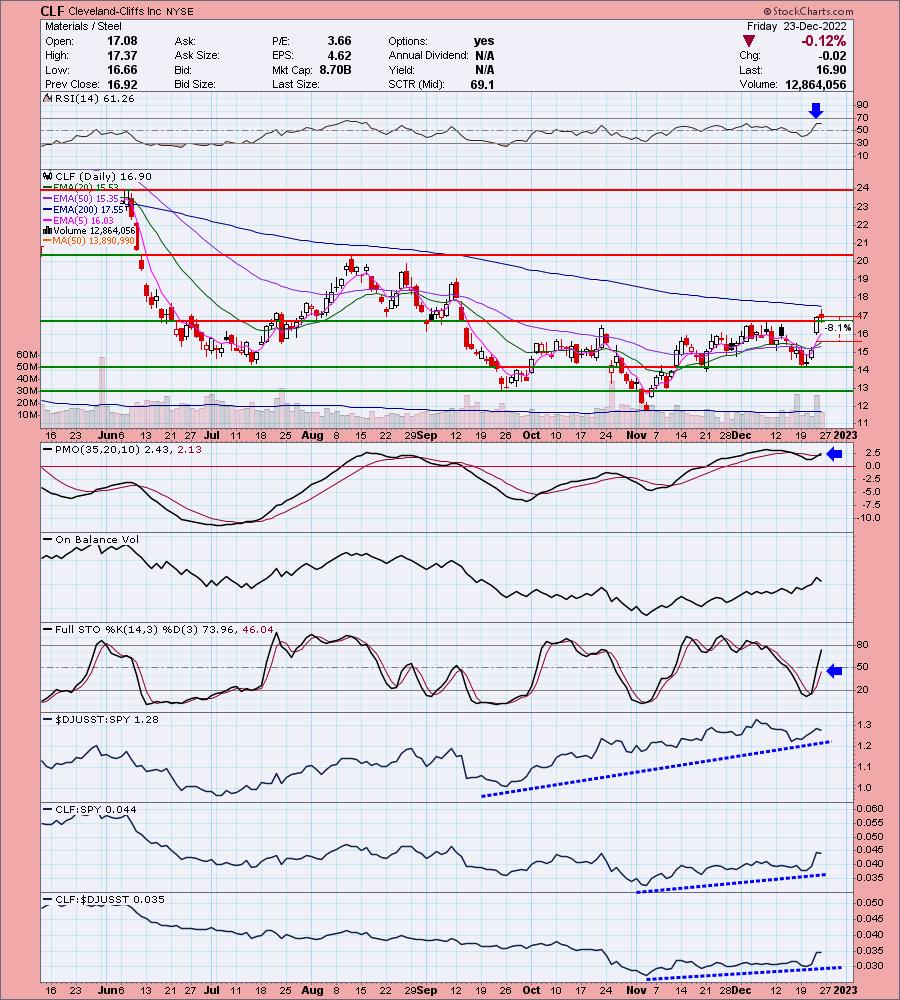
The "Dud" was only somewhat of a dog. It was down a mere -0.12% after only one day of trading, Cleveland-Cliffs (CLF). Still is attempting to reverse, but my confidence in it is low. I would look to the Energy sector.
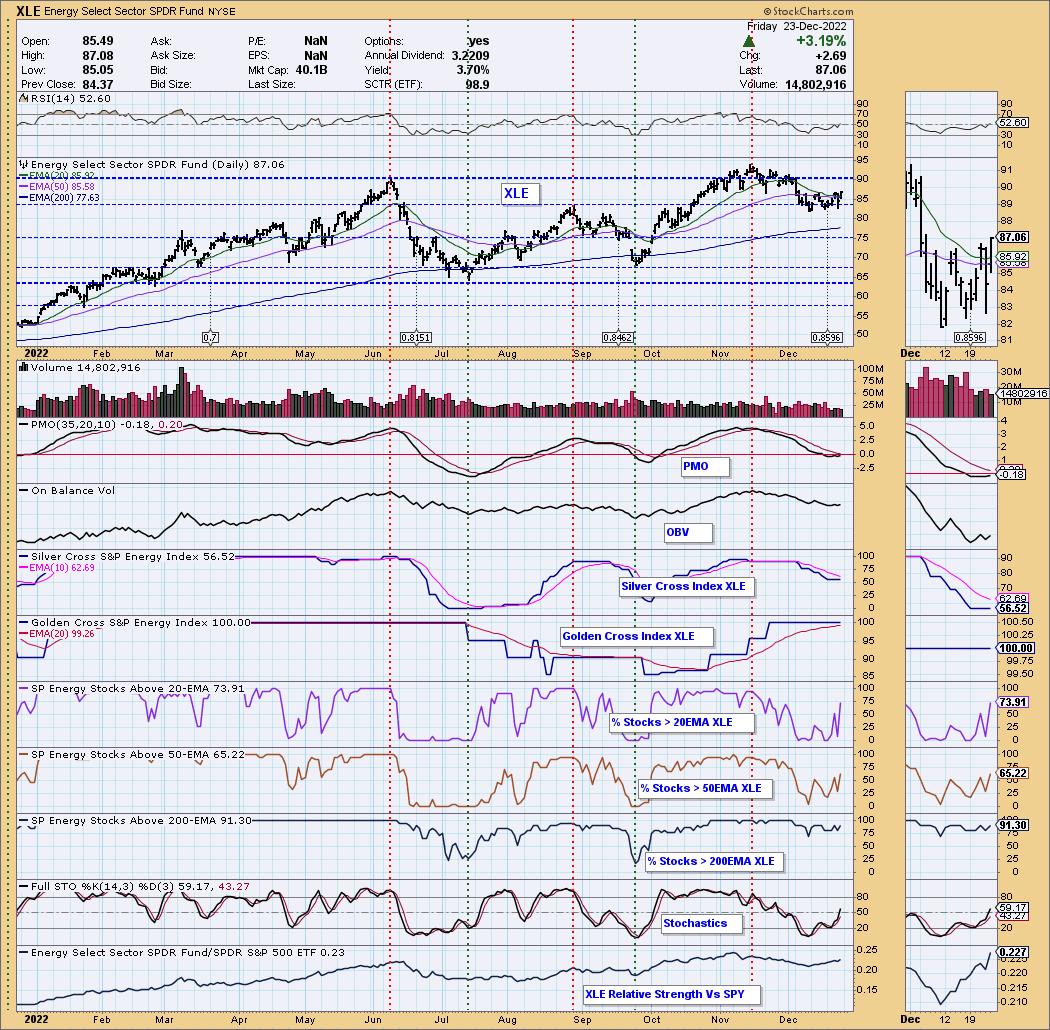
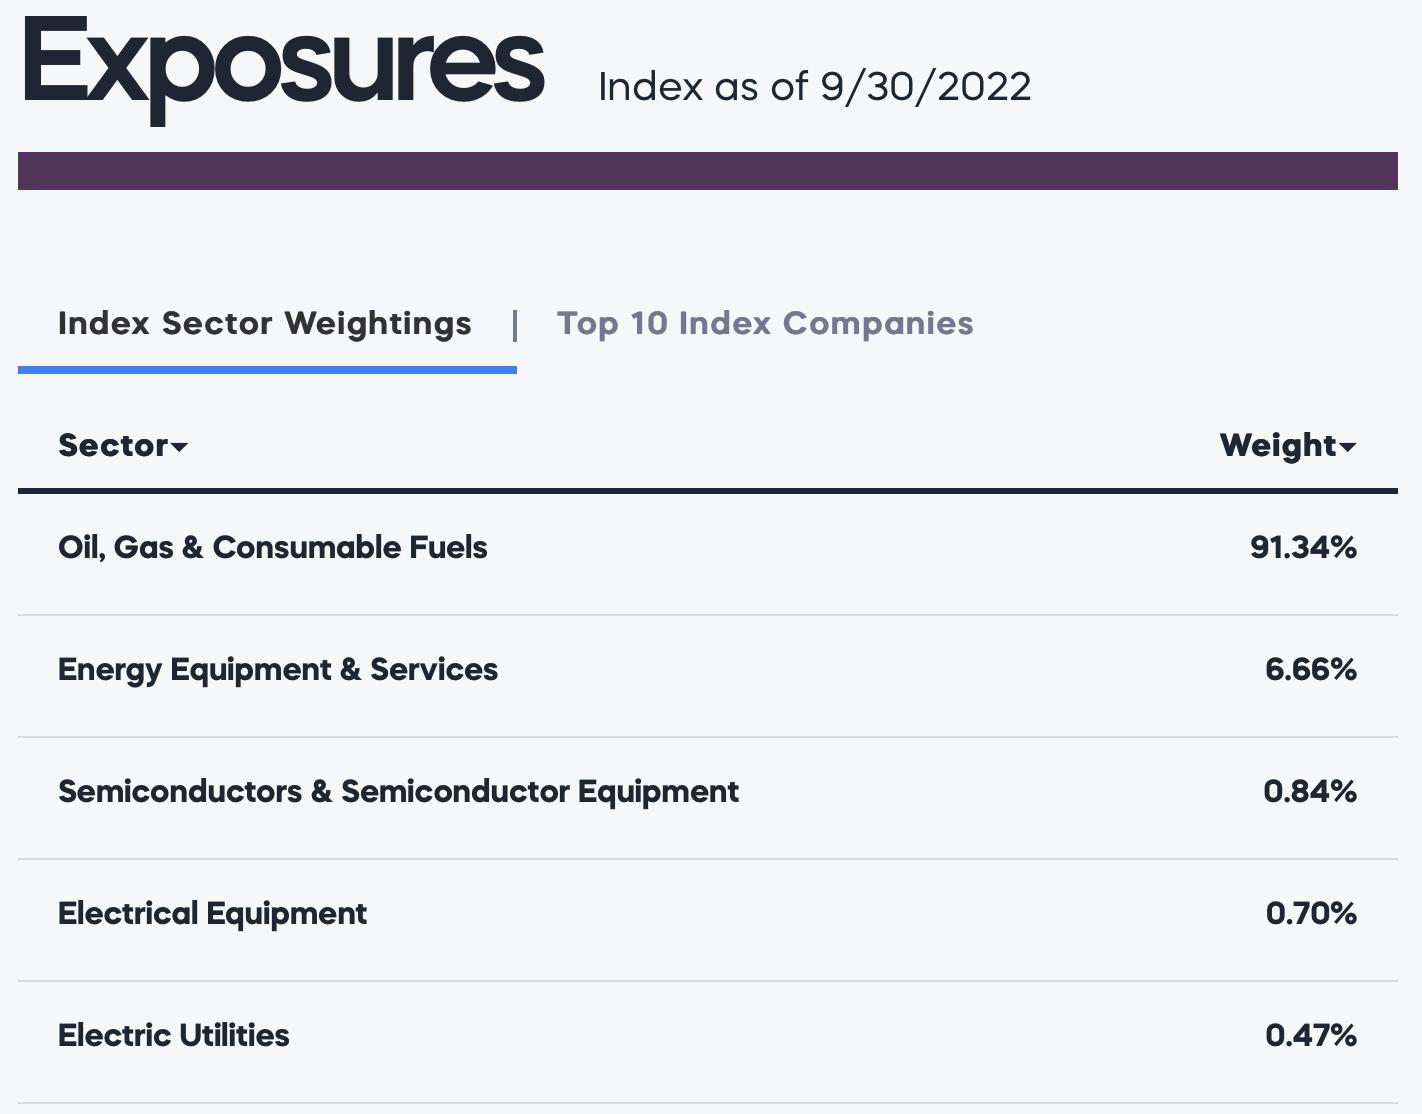
Speaking of the Energy sector (XLE), it is our "Sector to Watch" next week. The stocks and industry groups within this sector are picking up with rising Price Momentum Oscillators (PMOs). The "Industry Group to Watch" is within the sector, Integrated Oil & Gas ($DJUSOL). I'll be presenting DIG which the ProShares ETF for Oil & Gas exposure. I will tell you, that it is currently down over 4% in after hours trading. It is a leveraged 2x ETF so volatility will be an issue if you decide to trade it. I did find three stocks within this industry group that I like moving into next week.
There is no free DP Trading Room this Monday due to the holiday. There will also be no free DP Trading Room on January 2nd due to that holiday. The free DP Trading Room returns on January 9th at 8:30a PT. We have to do it a half hour early due to a doctor's appointment with a specialist who's calendar tells us not to miss it.
The Diamond Mine trading room will be open with no disruptions.
Wishing you and yours a very Merry Christmas! I'll talk to you on Friday of next week.
Good Luck & Good Trading,
Erin

RECORDING LINK (12/23/2022):
Topic: DecisionPoint Diamond Mine (12/23/2022) LIVE Trading Room
Start Time: Dec 23, 2022 09:00 AM
Passcode: Dec=23rd
REGISTRATION for 12/30/2022:
When: Dec 30, 2022 09:00 AM Pacific Time (US and Canada)
Topic: DecisionPoint Diamond Mine (12/30/2022) LIVE Trading Room
Register in advance for this webinar HERE
After registering, you will receive a confirmation email containing information about joining the webinar.

Our latest DecisionPoint Trading Room recording:
A few items about the spreadsheet: I've put on the spreadsheet whether the RSI is positive (green) or negative (red). The PMO column tells you if it is rising (green) or falling (red). Finally I've added my own "Sparkle Factor" that gives you my assessment going forward, bullish (green), bearish (red) or neutral (gray). The Sparkle Factor is basically my thoughts on whether I expect it to rise or fall. A neutral means it could really go either way so it could be added to a watch list. If you're in a stock I consider "neutral" going forward, the ball is in your court.
Darling:
Simplify Interest Rate Hedge ETF (PFIX)
EARNINGS: N/A
PFIX is actively managed to provide a hedge against a sharp increase in long-term interest rates. The fund holds OTC interest rate options, US Treasurys, and US Treasury Inflation-Protected Securities (TIPS). Click HERE for more information.
Predefined Scans Triggered: Hollow Red Candles
Below are the commentary and chart from Wednesday:
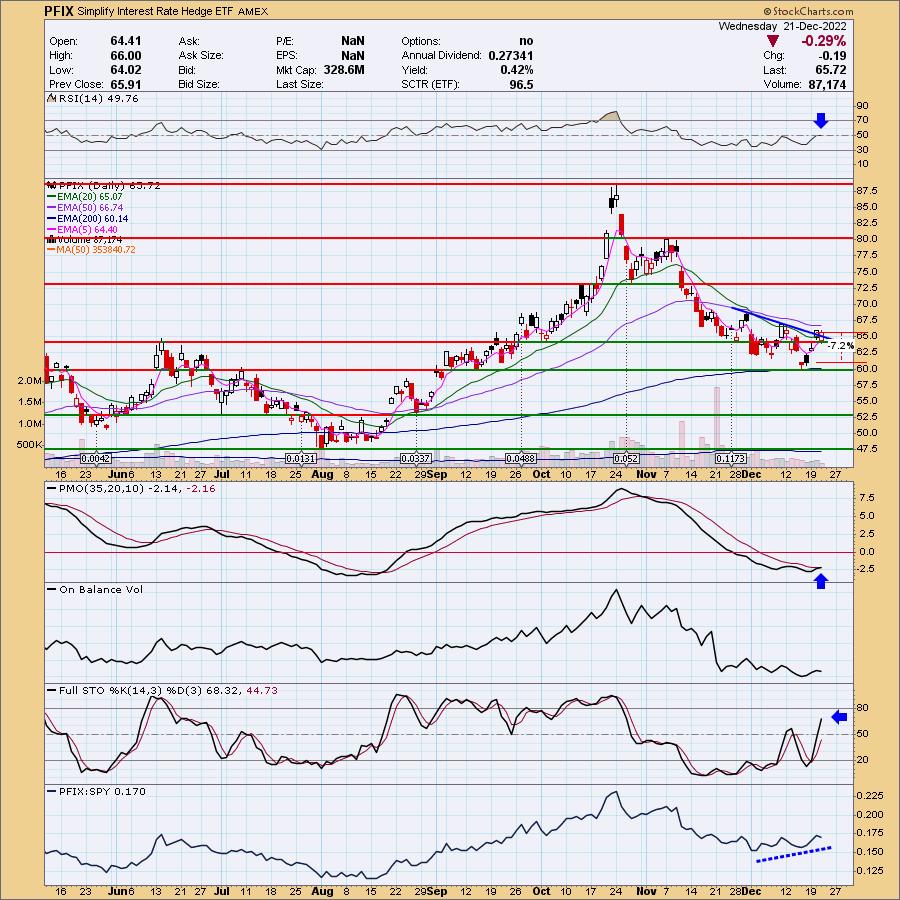
"PFIX is up +1.34% in after hours trading. I was pleasantly surprised to see that I presented this one to you on August 17th. The timing couldn't have been much better. I think our timing is right here again. The correction in interest rates was really overdone and it is time for a reversal. I've been watching closely. It broke from its declining trend yesterday and remains above it. Today it formed a bullish hollow red candlestick. The RSI is about to move into positive territory. The PMO triggered a crossover BUY signal today. Stochastics are rising vertically in positive territory and relative strength is picking up. This is on the early side, but I trust my PMO. It hasn't been too twitchy on crossovers and movement so a crossover BUY signal has more weight. The stop is set below early December lows at 7.2% around $60.98."
Here is today's chart:
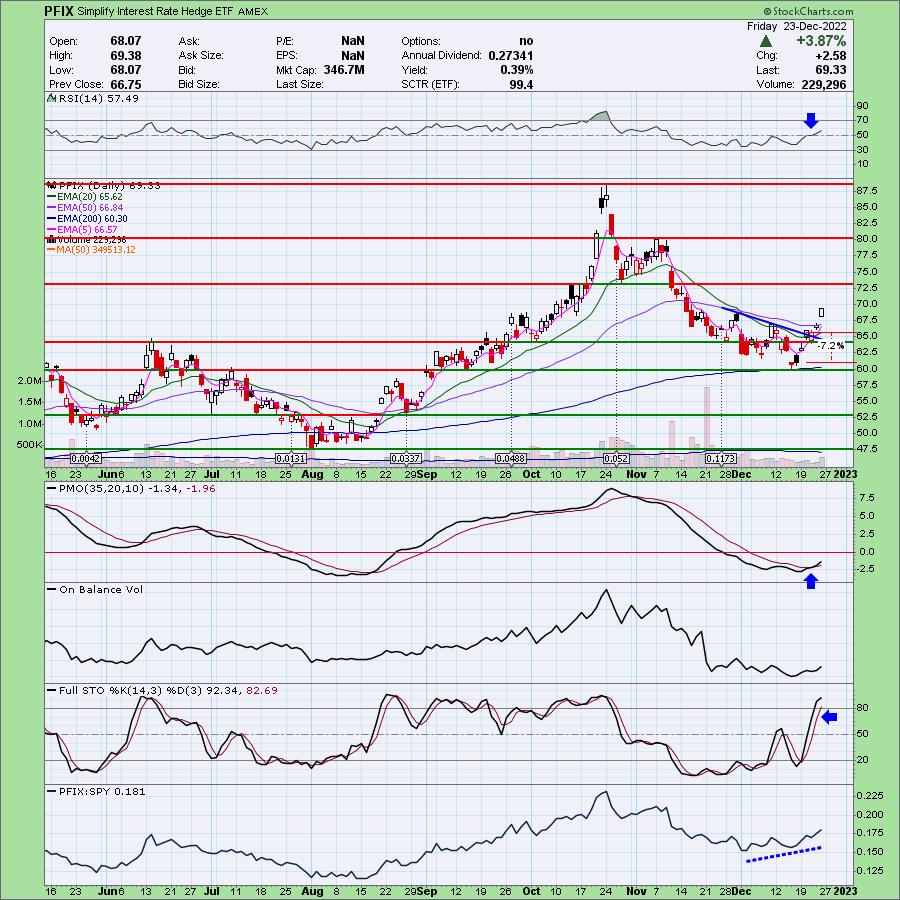
Looking at the bullish and not overbought nature of this chart, I am expecting a nice long rally in interest rates. If you haven't entered, I believe you still can and adjust the stop upward. If I had one wish for this chart, it would be to see the OBV move above prior tops like price has. Other than that the chart still looks fantastic.
Don't forget, on Thursdays I look at reader-requested symbols, so shoot me an email at erin@decisionpoint.com. I read every email I receive and try to answer them all!
Dud:
Cleveland-Cliffs Inc (CLF)
EARNINGS: 02/10/2023 (BMO)
Cleveland-Cliffs, Inc. is a flat-rolled steel producer, which supplies iron ore pellets to the North American steel industry. It engages in the production of metallics and coke, iron making, steelmaking, rolling and finishing, and downstream tubular components, stamping, and tooling. The company was founded in 1847 and is headquartered in Cleveland, OH.
Predefined Scans Triggered: Elder Bar Turned Green, New CCI Buy Signals, Gap Ups, Moved Above Upper Bollinger Band, Stocks in a New Uptrend (Aroon), Moved Above Ichimoku Cloud, Moved Above Upper Price Channel and Parabolic SAR Buy Signals.
Below are the commentary and chart from yesterday:
"CLF is down -0.12% in after hours trading. I decided to investigate the industry group and the ETF for Steel (SLX). SLX looks bullish and it is up +1.46% in after hours trading. CLF is beginning to outperform the Steel group, so despite the huge move today, I think it will still move higher. The RSI is positive and rising. Price just confirmed a bullish reverse head and shoulders. The pattern suggests price should test the August high at least. The PMO is nearing a new crossover BUY signal (although it is overbought). Stochastics are rising vertically toward positive territory. Relative strength studies are bullish. The stop was a bit difficult to set so you'll need to adjust as necessary depending on when you were to enter, but for now, I have it set at 8.1% around $15.54."
Here is today's chart:
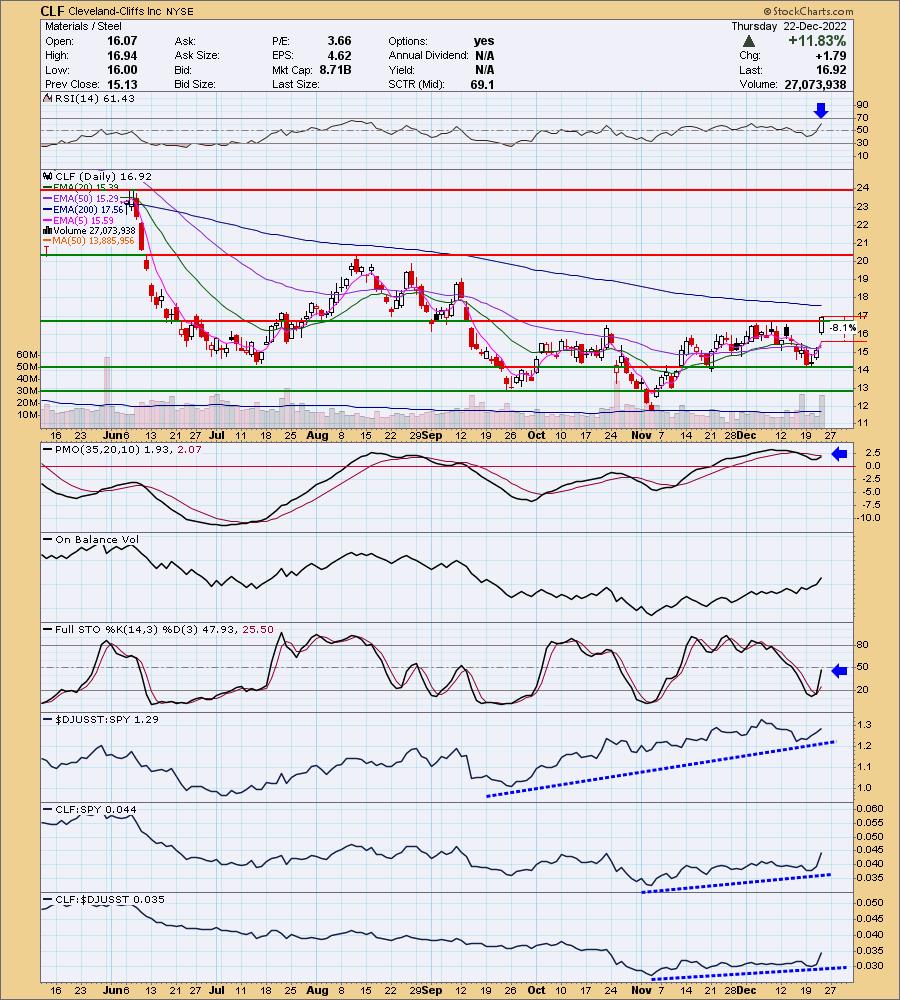
I see nothing wrong with this chart. Today's decline held above prior resistance. The RSI remains comfortably within positive territory and not overbought. The PMO just triggered a crossover BUY signal. The OBV continues to rise and Stochastics are almost above 80. Relative strength is strong across the board. I would look for an upside continuation.
THIS WEEK's Sector Performance:

DecisionPoint Sector Scoreboard (Mechanical Trend Model Signals):

Click Here to view Carl's annotated Sector ChartList!
Sector to Watch: Energy (XLE)
The bearish rounded top didn't result in the kind of downside Carl and I expected. We have to roll with the chart and it is rolling back up. It's still early based on the PMO, but Stochastics (our early detection indicator) are rising strongly and have moved into positive territory. The RSI has also moved back into positive territory above net neutral (50). Notice today's spike in participation of stocks above their 20-day EMA. Relative strength is improving as well. This is a sector that is recovering.
Industry Group to Watch: Integrated Oil & Gas (DIG)
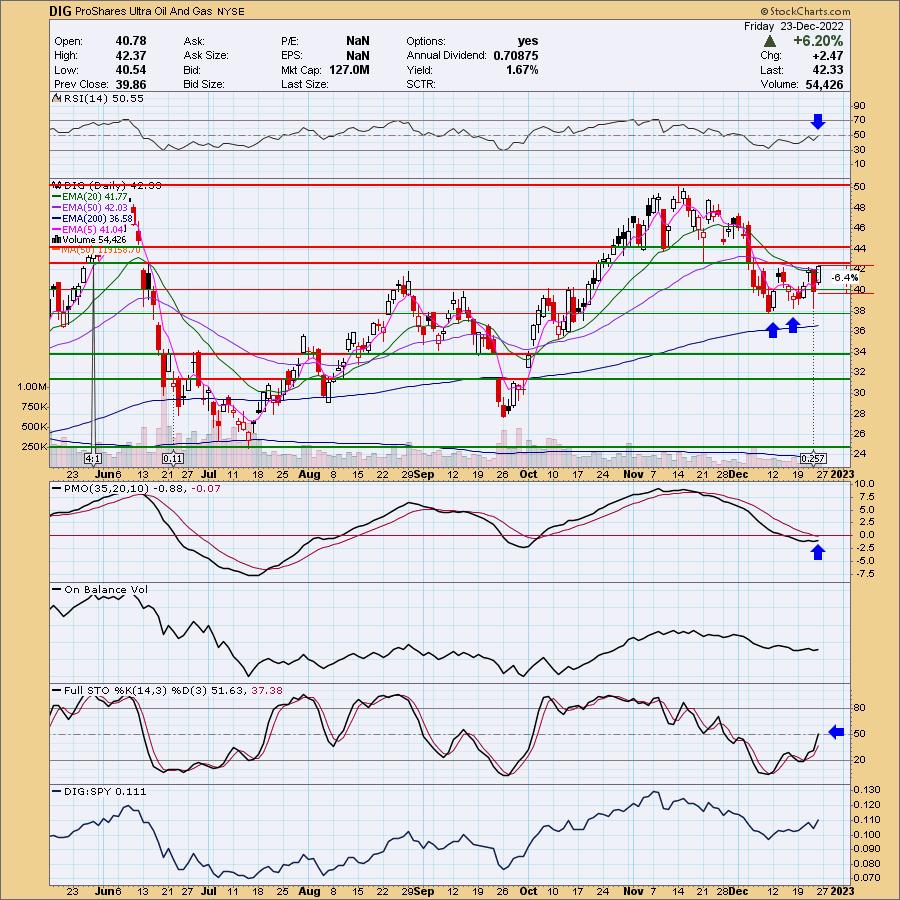
DIG is down -4.32% in after hours trading, so a better entry may be likely OR we're jumping on this a bit early. In any case, no overnight orders. You'll want to see how it is behaving. A breakout would be excellent. The PMO was acting as it is now on the mini-rally. It didn't amount to anything. The OBV is a little suspect as we see declining tops. I selected this as the "Industry Group to Watch", meaning we should "watch" it going into next week. We did find three very nice chart set-ups in the group by Conoco-Phillips (COP), Chevron (CVX) and Petroleo Brasileiro (PBR).
Go to our Sector ChartList on DecisionPoint.com to get an in-depth view of all the sectors. On StockCharts.com you can find the Industry Summary.
Merry Christmas!
Good Luck & Good Trading!
- Erin
erin@decisionpoint.com
Full Disclosure: I'm 12% exposed with a 2% hedge.
Watch the latest episode of theDecisionPoint Trading Room with Carl & Erin Swenlin on Mondays 3:00p EST!
Technical Analysis is a windsock, not a crystal ball. --Carl Swenlin
NOTE: The stocks reported herein are from mechanical trading model scans that are based upon moving average relationships, momentum and volume. DecisionPoint analysis is then applied to get five selections from the scans. The selections given should prompt readers to do a chart review using their own analysis process. This letter is not a call for a specific action to buy, sell or short any of the stocks provided. There are NO sure things or guaranteed returns on the daily selection of "diamonds in the rough."
Helpful DecisionPoint Links:
DecisionPoint Shared ChartList and DecisionPoint Chart Gallery
Price Momentum Oscillator (PMO)
Swenlin Trading Oscillators (STO-B and STO-V)
(c) Copyright 2022 DecisionPoint.com