
I'm back on the road again. Fortunately no weather problems at this point. I'm headed up to visit my brother in Spanish Fork, UT. It was a bit of a last minute decision to go, but other than some late publishing times, it won't interrupt your service.
I had a decent amount of stocks to review from my scans. As I suspected, Energy made an appearance given the new momentum for the sector. Two other themes I wanted to take advantage of were Banks and Insurance. I picked one of each.
It's late and I need to get to the DP Alert! Hope you had a lovely holiday!
Good Luck & Good Trading,
Erin
Today's "Diamonds in the Rough": CVE, NBTB and UNM.
Runner-ups: BGR, DECK, GPRK, OVV, PXD, XPRO, AMSF, PB, RGA, BOOM and THS.
Important: Your current subscription rates will ALWAYS stay the same when we raise prices. **
** You must keep your subscription running and in good standing.

RECORDING LINK (12/23/2022):
Topic: DecisionPoint Diamond Mine (12/23/2022) LIVE Trading Room
Start Time: Dec 23, 2022 09:00 AM
Passcode: Dec=23rd
REGISTRATION for 12/30/2022:
When: Dec 30, 2022 09:00 AM Pacific Time (US and Canada)
Topic: DecisionPoint Diamond Mine (12/30/2022) LIVE Trading Room
Register in advance for this webinar HERE
After registering, you will receive a confirmation email containing information about joining the webinar.

Here is the last recording (no recording on 12/26):
Welcome to DecisionPoint Diamonds, wherein I highlight ten "Diamonds in the Rough" per week. These are selected from the results of my DecisionPoint Scans which search for stocks that could benefit from the trend and condition of the market. Remember, these are not recommendations to buy or sell, but are the most interesting of the stocks that surfaced in my scans. My objective is to save you the work of the initial, tedious culling process, but you need to apply your own analysis to see if these stocks pique your interest as well. There are no guaranteed winners here!
"Predefined Scans Triggered" are taken from StockCharts.com using the "Symbol Summary" option instead of a "SharpChart" on the workbench.
Stop levels are all rounded down.
Cenovus Energy Inc. (CVE)
EARNINGS: 02/08/2023 (BMO)
Cenovus Energy, Inc. engages in provision of gas and oil. Its activities include development, production, and marketing of crude oil, natural gas liquids (NGLS), and natural gas in Canada. The firm operates through four segments: Oil Sands, Conventional, Refining & Marketing, and Corporate & Eliminations. The Oil sands segment includes the development and production of bitumen in northeast Alberta including Foster Creek, Christina Lake and Narrows Lake as well as projects in the early stages of development. The Conventional segment includes includes land primarily in the Elmworth-Wapiti, Kaybob-Edson, and Clearwater operating areas. The Refining and Marketing segment provides transportation and selling of crude oil, natural gas and NGLS. The Corporate and Eliminations segment includes unrealized gains and losses recorded on derivative financial instruments, divestiture of assets, as well as other administrative, financing activities and research costs. The company was founded in 1881 and is headquartered in Calgary, Canada.
Predefined Scans Triggered: None.
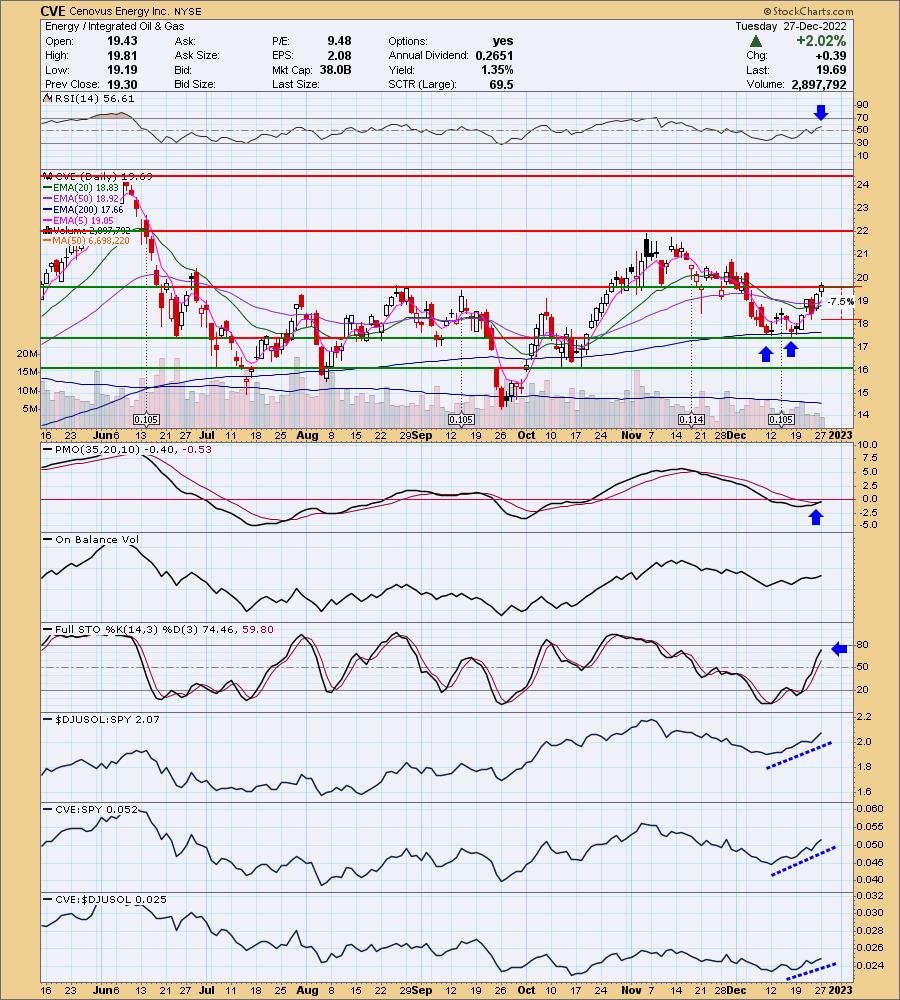
CVE is down -0.71% in after hours trading. A bullish double-bottom executed and has reached its minimum upside target. It's a good start. CVE is in this week's "Industry Group to Watch" so I was happy to present it. The RSI is positive and the PMO just triggered a crossover BUY signal. Stochastics are rising strongly and are nearing territory above 80. Relative strength studies are very bullish. The stop is set at 7.5% around $18.21.
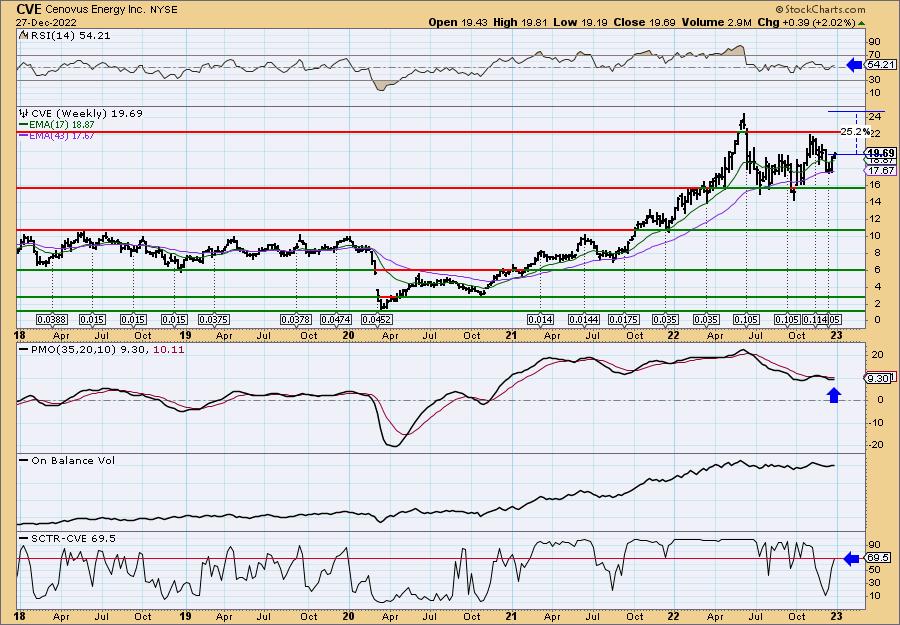
The weekly PMO is trying to firm up, but it is still on a SELL signal. The weekly RSI is positive and the StockCharts Technical Rank (SCTR) is just about in the "hot zone" above 70, meaning it is in the top 30% of its 'universe' (large-caps) as far as trend and condition in the intermediate- to long-terms. Upside potential is about 25%.
NBT Bancorp, Inc. (NBTB)
EARNINGS: 01/25/2023 (AMC)
NBT Bancorp, Inc. is a holding company, which engages in the provision of financial solutions. It offers commercial banking, retail banking, and wealth management, as well as trust and investment services. The company was founded in 1986 and is headquartered in Norwich, NY.
Predefined Scans Triggered: P&F High Pole and Parabolic SAR Buy Signals.
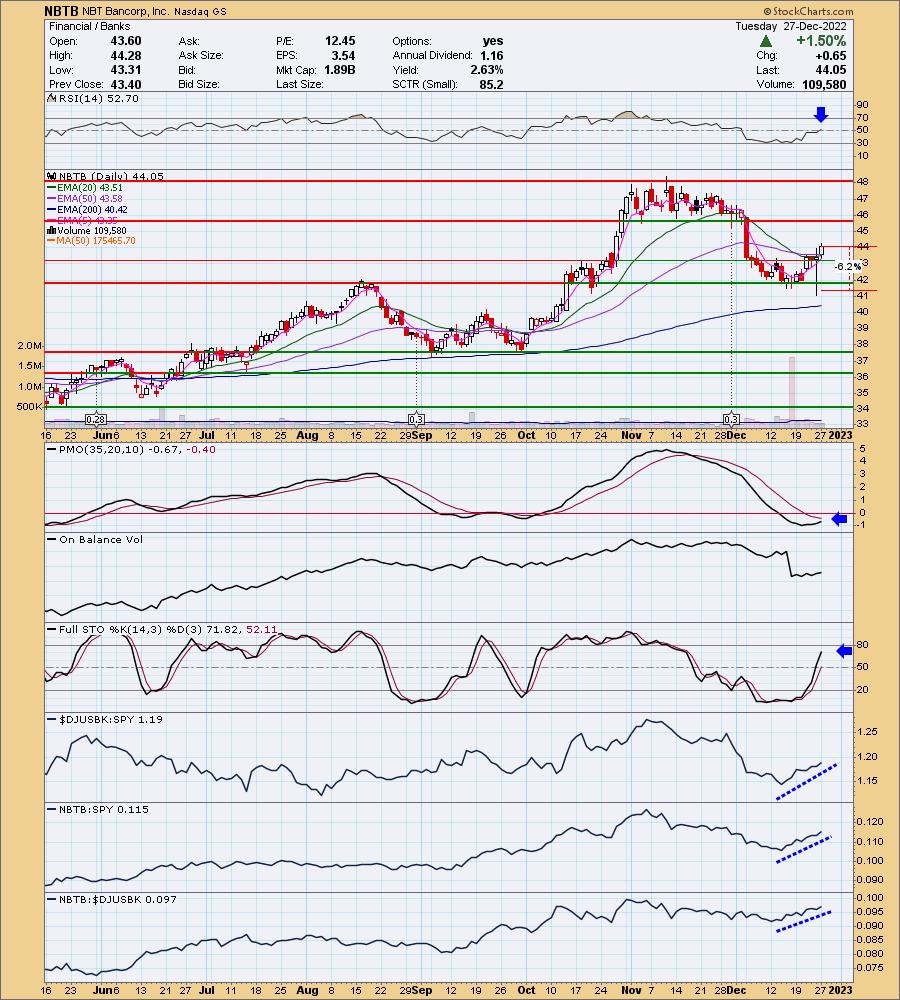
NBTB is unchanged in after hours trading. I like the cup shaped bottom and today's breakout above the 20/50-day EMAs. Price is nearing a "Silver Cross" of the 20/50-day EMAs which would trigger an IT Trend Model BUY signal. The RSI is positive and the PMO is headed for an oversold crossover BUY signal. Stochastics are nearing 80. Relative strength is bullish against the group and the SPY. The group looks pretty good too. The stop is set at 6.2% or $41.31.
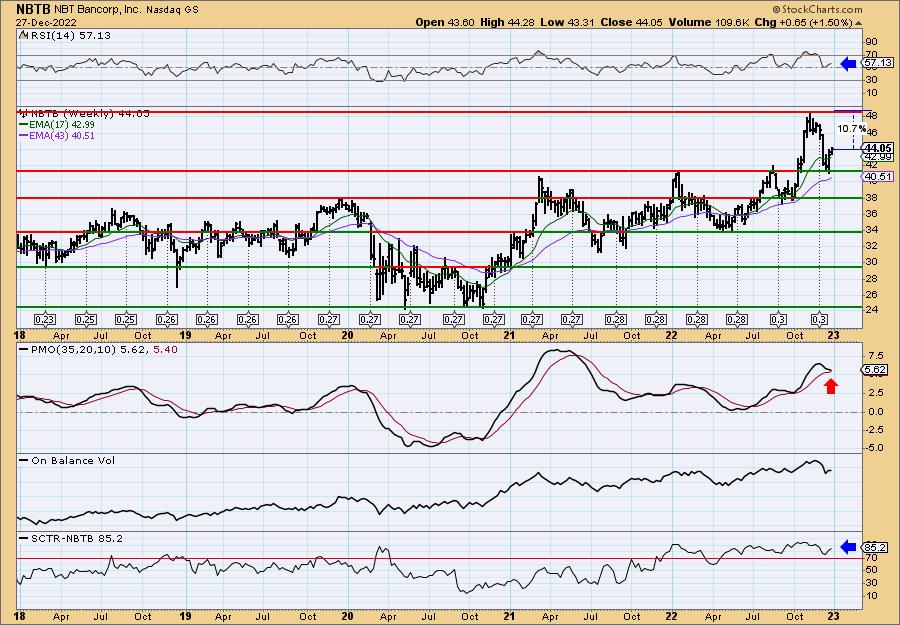
It is near all-time highs again so consider an upside target of about 15% around $50.66. The weekly RSI looks good, but not the weekly PMO. The SCTR is in the hot zone though and the PMO is beginning to decelerate. Still, I would consider this more of a short-term trade.
Unum Group (UNM)
EARNINGS: 01/31/2023 (AMC)
Unum Group is engaged in providing financial protection benefits. It operates through the following segments: Unum US, Unum International, Colonial Life, Closed Block and Corporate. The Unum US segment consists of group long-term and short-term disability insurance, group life and accidental death and dismemberment products, and supplemental and voluntary lines of business. The Unum International segment engages in the operations of the UK business, which includes insurance for group long-term disability, group life, and supplemental lines of business that include dental, individual disability, and critical illness products and the Poland business, which includes insurance for individual and group life with accident and health riders. The Colonial Life segment includes insurance for accident, sickness, disability products, life products, and cancer and critical illness products. The Closed Block segment consists of individual disability, group and individual long-term care, and other insurance products no longer actively marketed. The Corporate segment refers to investment income on corporate assets and other corporate income and expenses not allocated to a line of business and interest expense on corporate debt other than non-recourse debt. The company was founded in 1848 and is headquartered in Chattanooga, TN.
Predefined Scans Triggered: P&F Double Bottom Breakout.
UNM is unchanged in after hours trading. The RSI is positive and the PMO just triggered a crossover BUY signal. Price broke above the 50-day EMA on Friday and today it finished unchanged. We have a clear double-bottom price pattern developing. If the pattern confirms on a breakout above $43, the upside target would be above the November high. Stochastics are rising toward 80 and relative strength is bullish across the board. The stop is set at 6.2% around $38.53.
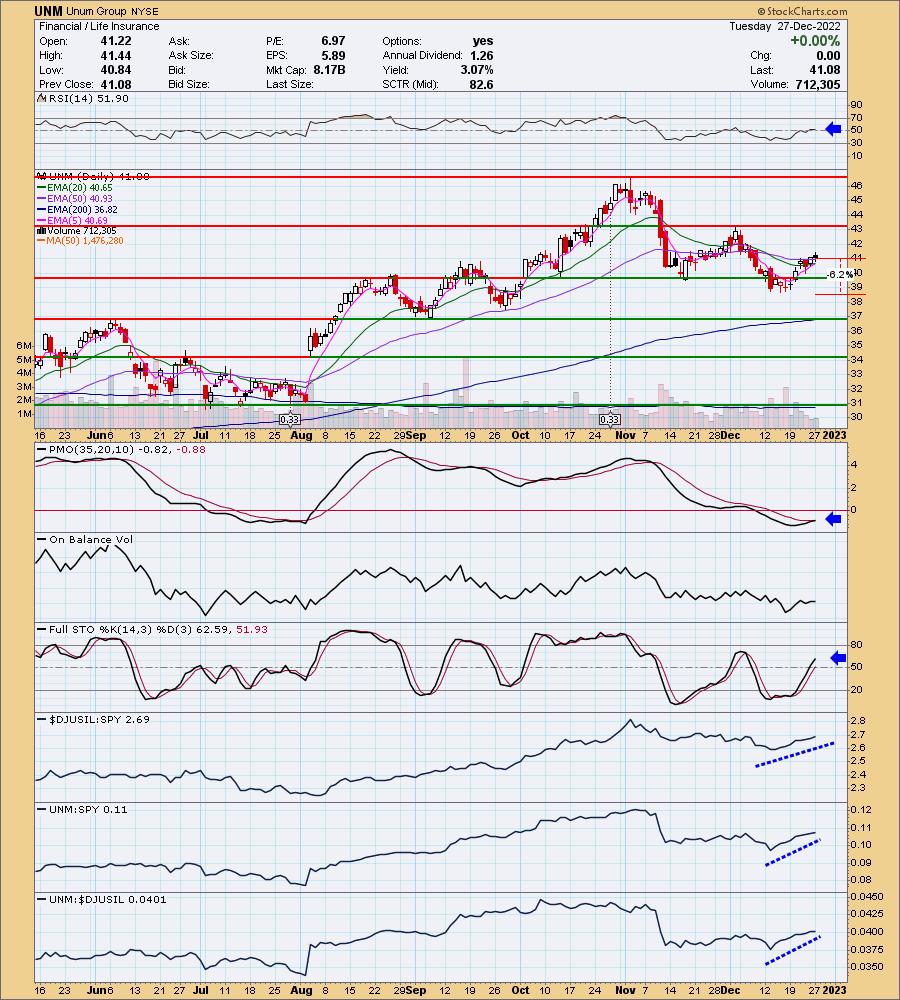
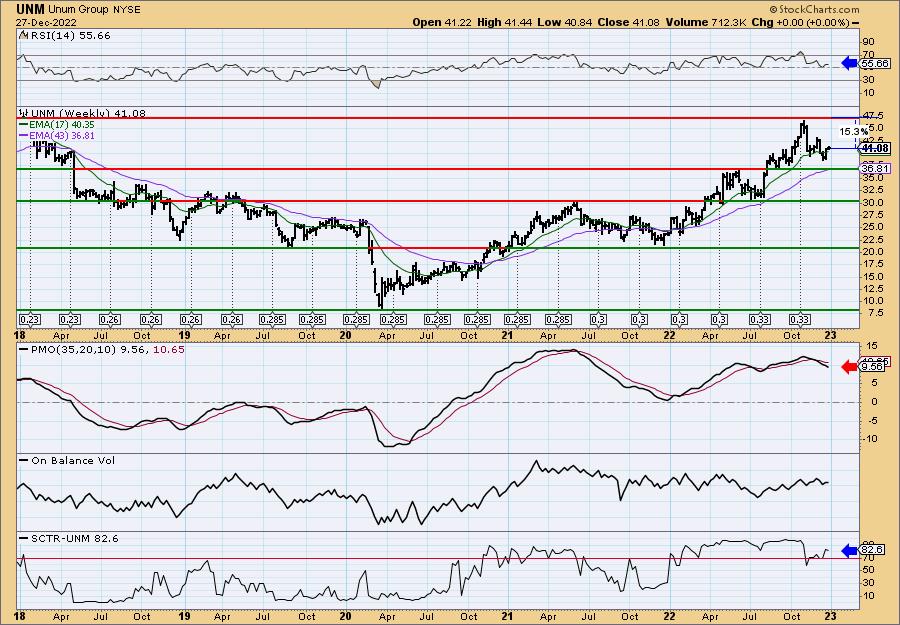
As noted earlier, if the double-bottom fulfills, we should see a breakout here. Even if it just reaches resistance, it will be an over 15% gain. Keep this one short-term given the weekly PMO is in decline and not slowing down yet. The weekly RSI is positive and the SCTR is healthy.
Don't forget, on Thursdays I look at reader-requested symbols, click HERE to send me an email. I read every email I receive and try to answer them all!
Current Market Outlook:
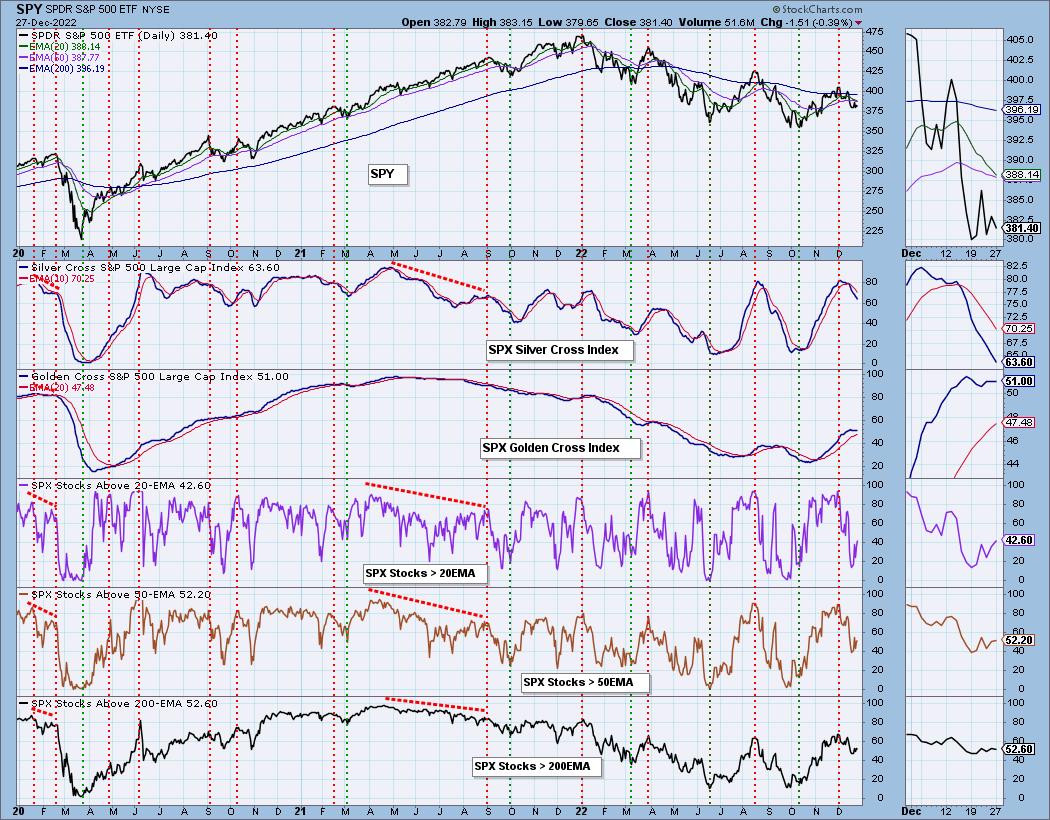
Market Environment: It is important to consider the odds for success by assessing the market tides. The following chart uses different methodologies for objectively showing the depth and trend of participation for intermediate- and long-term time frames.
- The Silver Cross Index (SCI) shows the percentage of SPX stocks on IT Trend Model BUY signals (20-EMA > 50-EMA)
- The Golden Cross Index (GCI) shows the percentage of SPX stocks on LT Trend Model BUY signals (50-EMA > 200-EMA)
Don't forget that as a "Diamonds" member, you have access to our GCI/SCI curated ChartList on DecisionPoint.com. You'll find it under "Members Only" links on the left side on the Blogs and Links Page.
Here is the current chart:
Full Disclosure: I am 12% exposed with a 2% hedge.
I'm required to disclose if I currently own a stock I mention and/or may buy/short it within the next 72 hours.
"Technical Analysis is a windsock, not a crystal ball." - Carl Swenlin
(c) Copyright 2022 DecisionPoint.com
Watch the latest episode of DecisionPoint with Carl & Erin Swenlin on Mondays 7:00p EST or on the DecisionPoint playlist on the StockCharts TV YouTube channel here!
NOTE: The stocks reported herein are from mechanical trading model scans that are based upon moving average relationships, momentum and volume. DecisionPoint analysis is then applied to get five selections from the scans. The selections given should prompt readers to do a chart review using their own analysis process. This letter is not a call for a specific action to buy, sell or short any of the stocks provided. There are NO sure things or guaranteed returns on the daily selection of "Diamonds in the Rough."
Regarding BUY/SELL Signals: The signal status reported herein is based upon mechanical trading model signals and crossovers. They define the implied bias of the price index/stock based upon moving average relationships and momentum, but they do not necessarily call for a specific action. They are information flags that should prompt chart review. Further, they do not call for continuous buying or selling during the life of the signal. For example, a BUY signal will probably (but not necessarily) return the best results if action is taken soon after the signal is generated. Additional opportunities for buying may be found as price zigzags higher, but the trader must look for optimum entry points. Conversely, exit points to preserve gains (or minimize losses) may be evident before the model mechanically closes the signal.
Helpful DecisionPoint Links:
DecisionPoint Shared ChartList and DecisionPoint Chart Gallery
Price Momentum Oscillator (PMO)
Swenlin Trading Oscillators (STO-B and STO-V)
For more links, go to DecisionPoint.com