
Another horrible week for the SPY. The Fed technically upset the apple cart, but tensions were high before the announcement of a 75 point rate hike. Reality seems to be setting in for most investors and traders that this market has more downside ahead. We are watching the VIX (fear factor) getting higher, but not high enough. When we finally see some capitulation then we can start looking for longer lasting rallies. We're not there yet.
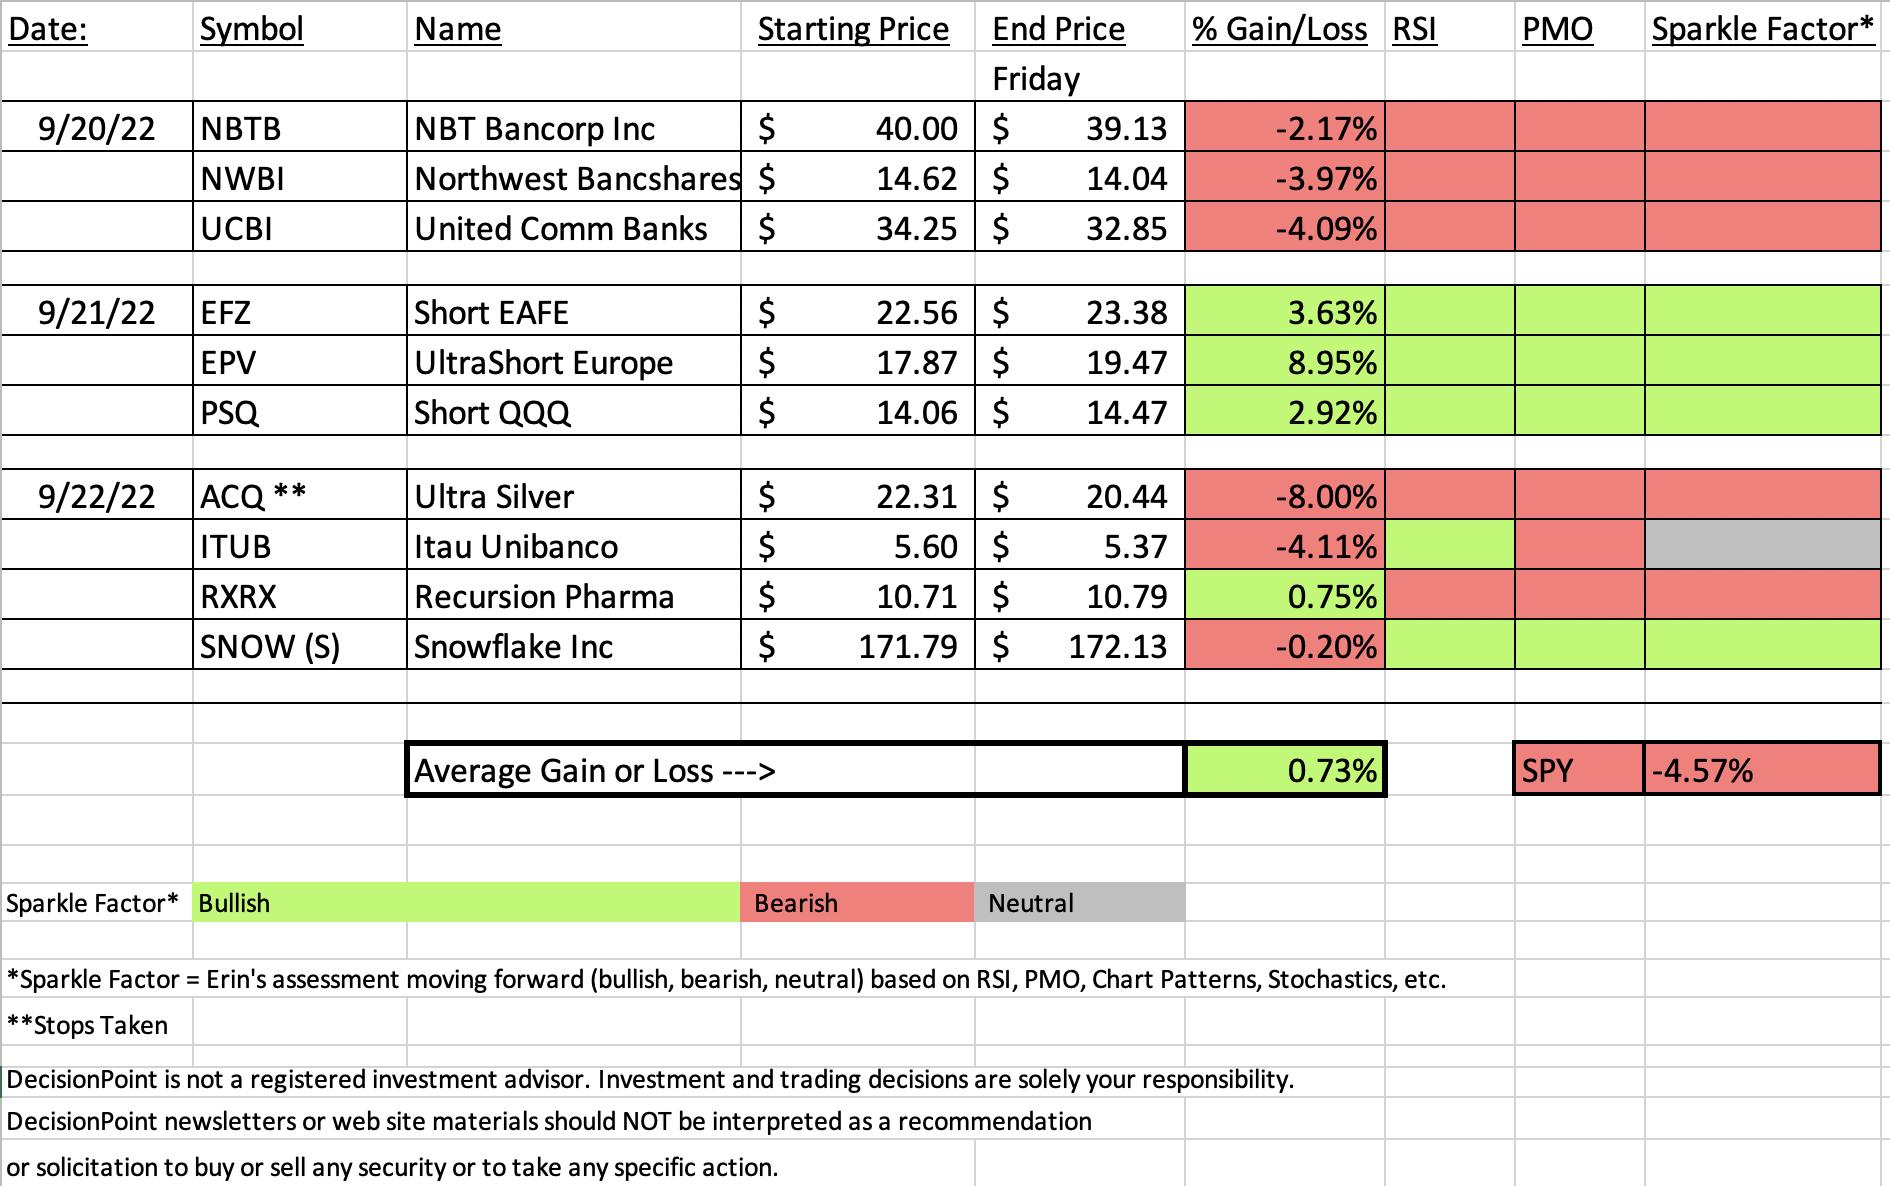
Notes on the spreadsheet:
We averaged higher this week off the back of inverse ETFs. I expect them to continue to be a place we can go to take advantage of what believe will be more downside ahead.
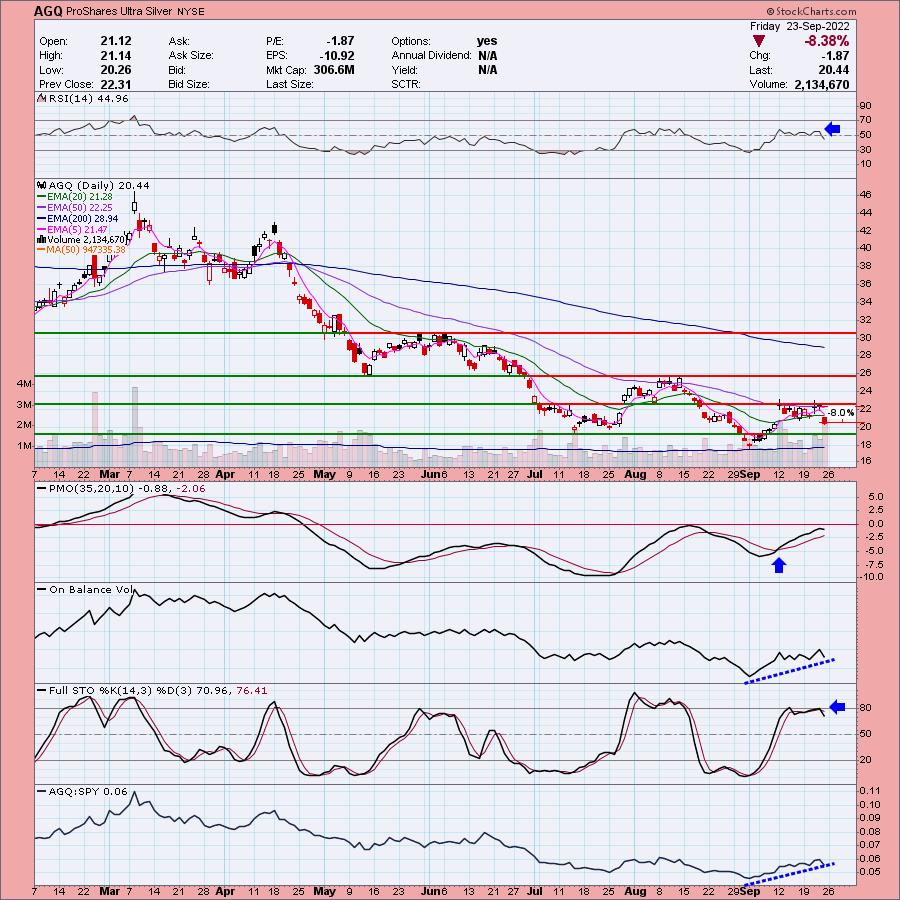
The "Darling" this week is the UltraShort Europe ETF (EPV) and the "Dud" is the UltraShort Silver ETF (ACQ). The stop was hit today, so it shows a decline of 8%.
You'll note that we have a 'neutral' Sparkle Factor on ITUB. I think that one could go either way moving forward, but more likely more downside given the market environment.
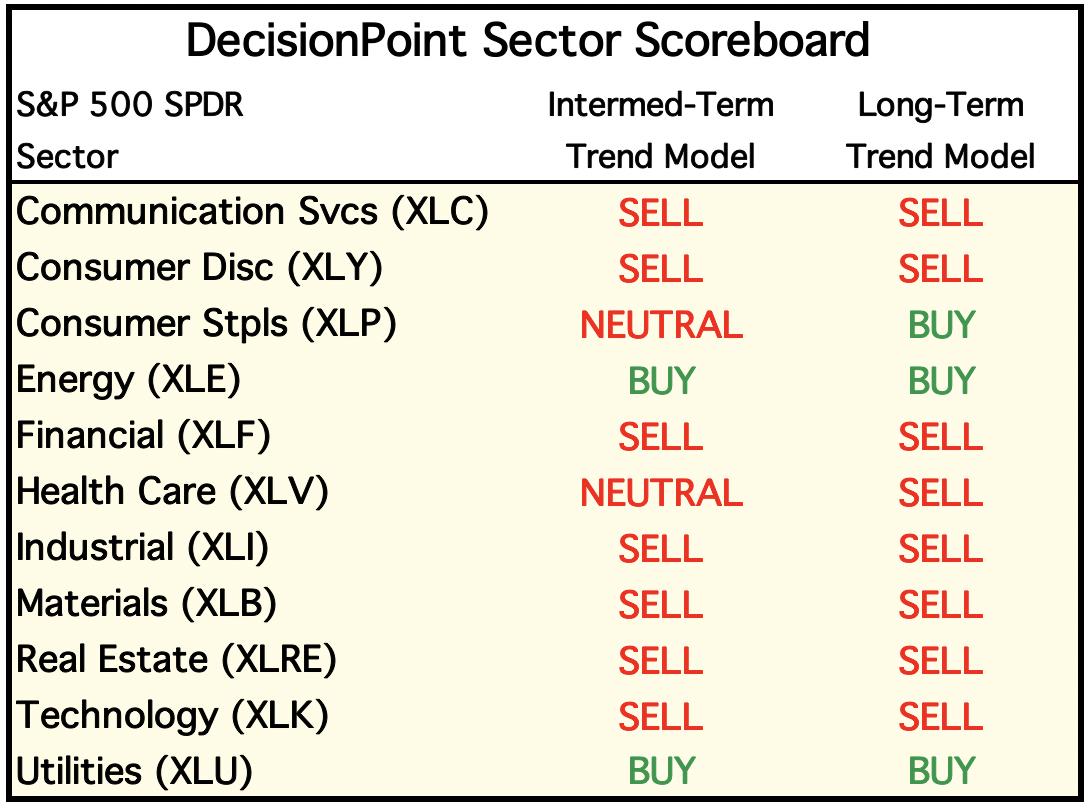
Sector Watch Notes: This week I'm doing something different. I'm looking at the most bearish sector and industry group. As those who attended the Diamond Mine know, there are zero industry groups looking healthy and there are certainly not any sectors that look bullish. We're going with the short. I'm presenting DRV which is the inverse of the Real Estate sector.
Have a great weekend!
Good Luck & Good Trading,
Erin

TODAY'S RECORDING LINK (9/23/2022):
Topic: DecisionPoint Diamond Mine (9/23/2022) LIVE Trading Room
Start Time: Sept 23, 2022 09:00 AM
Recording LINK
Passcode: Sept*23rd
REGISTRATION For Friday 9/30 Diamond Mine:
When: Sep 30, 2022 09:00 AM Pacific Time (US and Canada)
Topic: DecisionPoint Diamond Mine (9/30/2022) LIVE Trading Room
Register in advance for this webinar HERE
Save the registration confirmation email with login instructions in case Zoom doesn't notify you in time.
** There will be no Diamond Mine trading room on 10/7 **

Our latest DecisionPoint Trading Room recording:
A few items about the spreadsheet: I've put on the spreadsheet whether the RSI is positive (green) or negative (red). The PMO column tells you if it is rising (green) or falling (red). Finally I've added my own "Sparkle Factor" that gives you my assessment going forward, bullish (green), bearish (red) or neutral (gray). The Sparkle Factor is basically my thoughts on whether I expect it to rise or fall. A neutral means it could really go either way so it could be added to a watch list. If you're in a stock I consider "neutral" going forward, the ball is in your court.
Darling:
ProShares UltraShort FTSE Europe (EPV)
EARNINGS: N/A
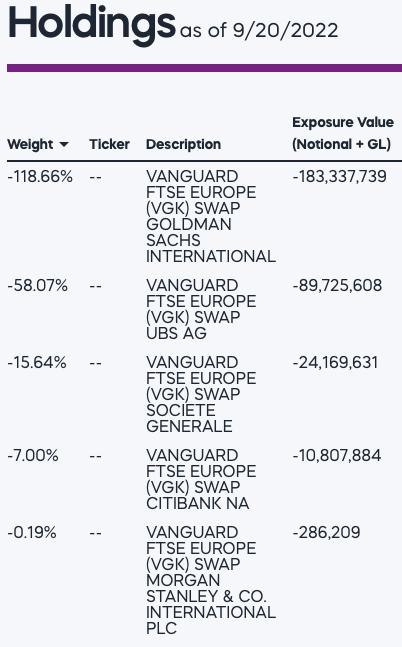
EPV provides a daily leveraged inverse (-2x) exposure to a market-cap-weighted index of European developed markets equities. For more information click HERE.
Predefined Scans Triggered: Moved Above Upper Keltner Channel, New 52-week Highs, Moved Above Upper Bollinger Band and P&F Double Top Breakout.
Below are the commentary and chart from 9/21:
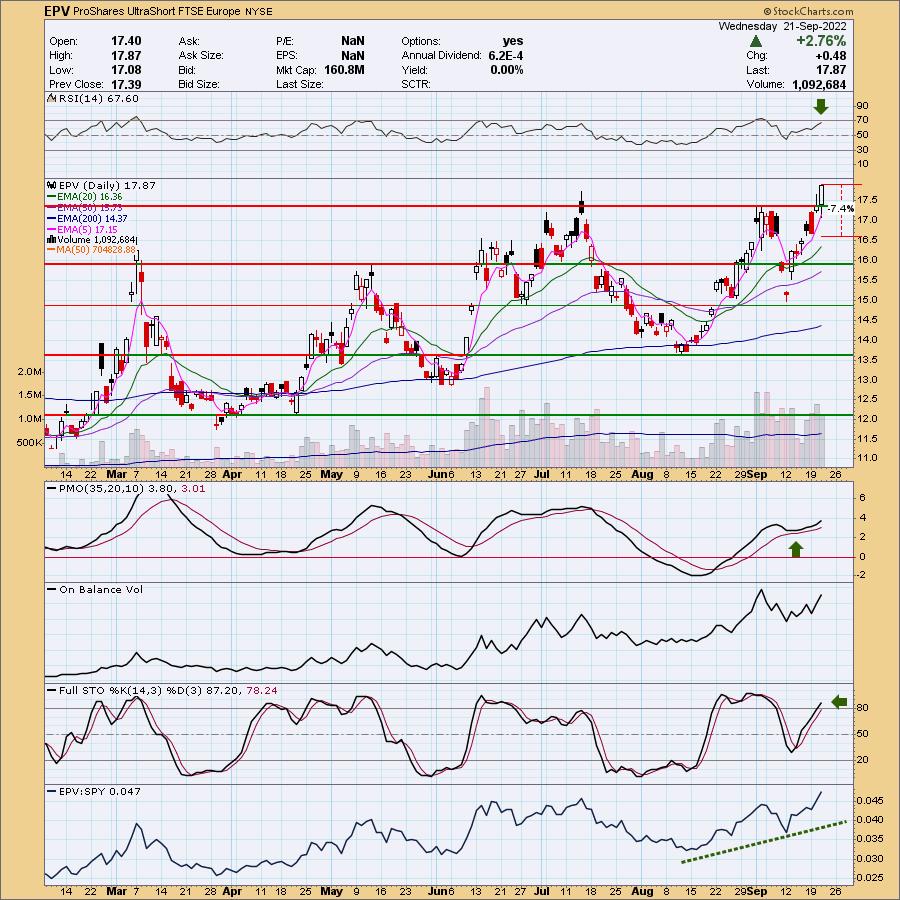
"EPV is up +1.45% in after hours trading. This is a 2x juiced ETF so consider half of what you would normally buy if you don't want too much risk exposure. The breakout looks fantastic. It even closed on its high for the day. The RSI is positive and not overbought and the PMO has bottomed above its signal line and is also not overbought. The OBV should've made a new high, but as I said above, I don't think volume is as important for these ETFs. Stochastics just moved above 80 and it is of course outperforming the market. The stop is set at around 7.4% or $16.55."
Here is today's chart:
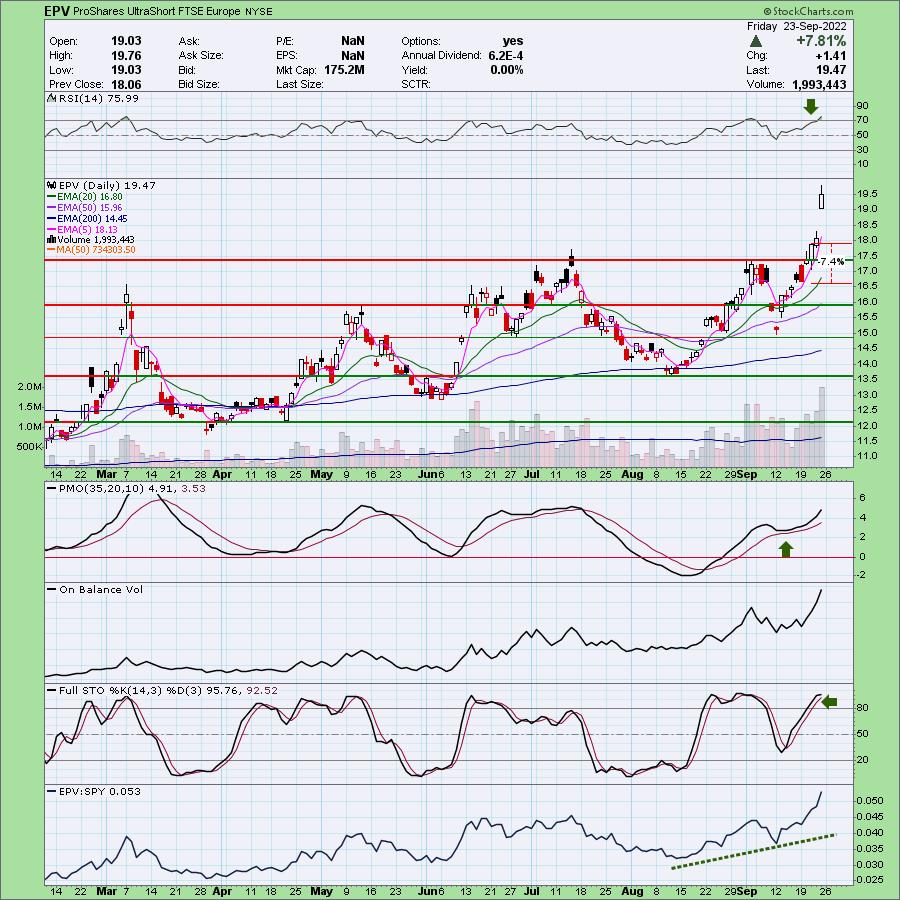
I warned that we could see a reverse island here in the Diamond Mine today, but given the strong indicators and demise of Europe right now, I believe that isn't going to be an issue. The RSI is now very overbought and in the past that hasn't resulted in more upside. I don't like to say, "This time is different", but I will. As noted in the opening, most investors are ready to concede to the bear, not all, but many. That suggests more downside overall for the markets, including Europe. I meant to buy this one yesterday, but felt now that I need to wait for a bit of a pullback or consolidation to get the RSI out of overbought territory.
Don't forget, on Thursdays I look at reader-requested symbols, so shoot me an email at erin@decisionpoint.com. I read every email I receive and try to answer them all!
Dud:
ProShares Ultra Silver (AGQ)
EARNINGS: N/A
AGQ provides 2x the daily performance of an index of silver future contracts. For more information click HERE.
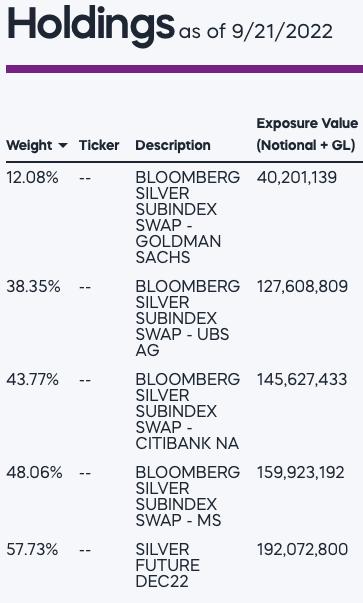
Predefined Scans Triggered: Elder Bar Turned Blue, Filled Black Candles and P&F Low Pole.
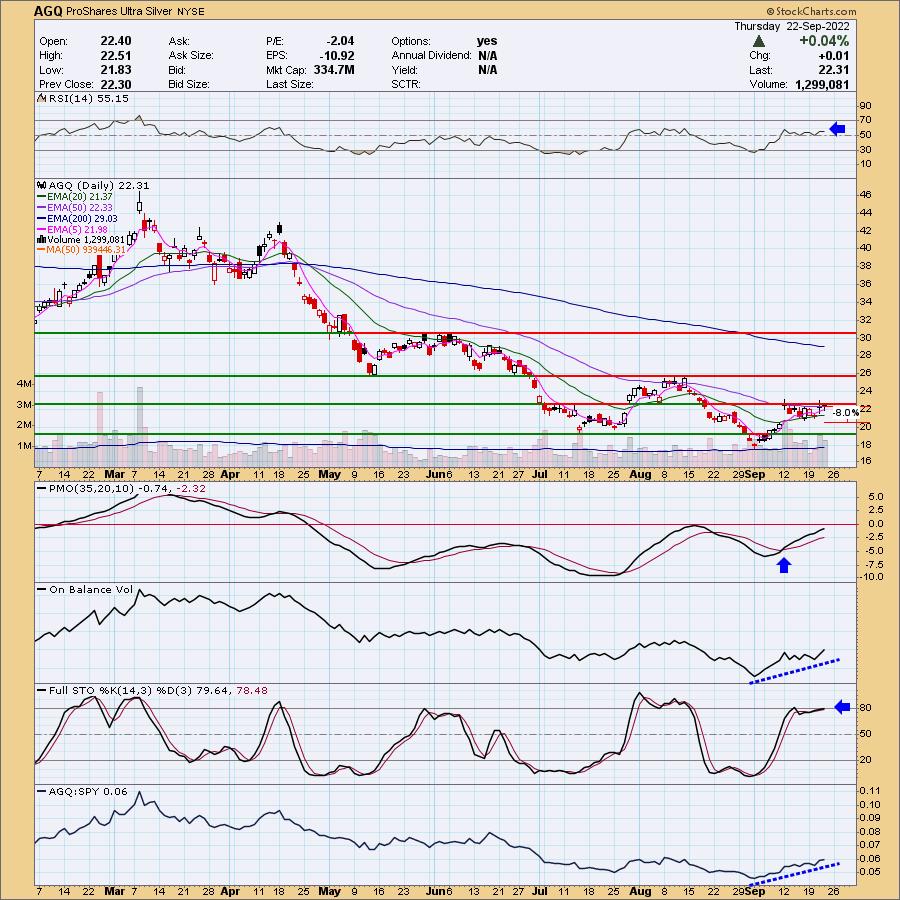
Below are the commentary and chart from 9/22:
"AGQ is down -0.09% in after hours trading. This is a "juiced" 2x ETF for Silver. I'm bullish on Silver, but I always hesitate to use juiced ETFs. If you are, consider halving the position you would normally take on a regular ETF for Silver. I see a bull flag with a breakout appearing imminent. The RSI is positive and the PMO is on a crossover BUY signal. It already had a 5/20-day EMA crossover earlier in the month but hasn't done that much with it. The OBV is confirming the rising trend and Stochastics are just about to move above 80. It is outperforming the SPY slightly. We need a breakout soon and with an inverse like this, I would definitely want a confirming breakout. The stop is set below last week's lows around 8% or $20.52."
Here is today's chart:
I still like the metals, but until the Dollar settles down, they will all be up against some serious headwinds. I wouldn't be in an ultra here on either side of this trade. Best to wait for confirmation of support holding at $19 and getting a rising PMO again.
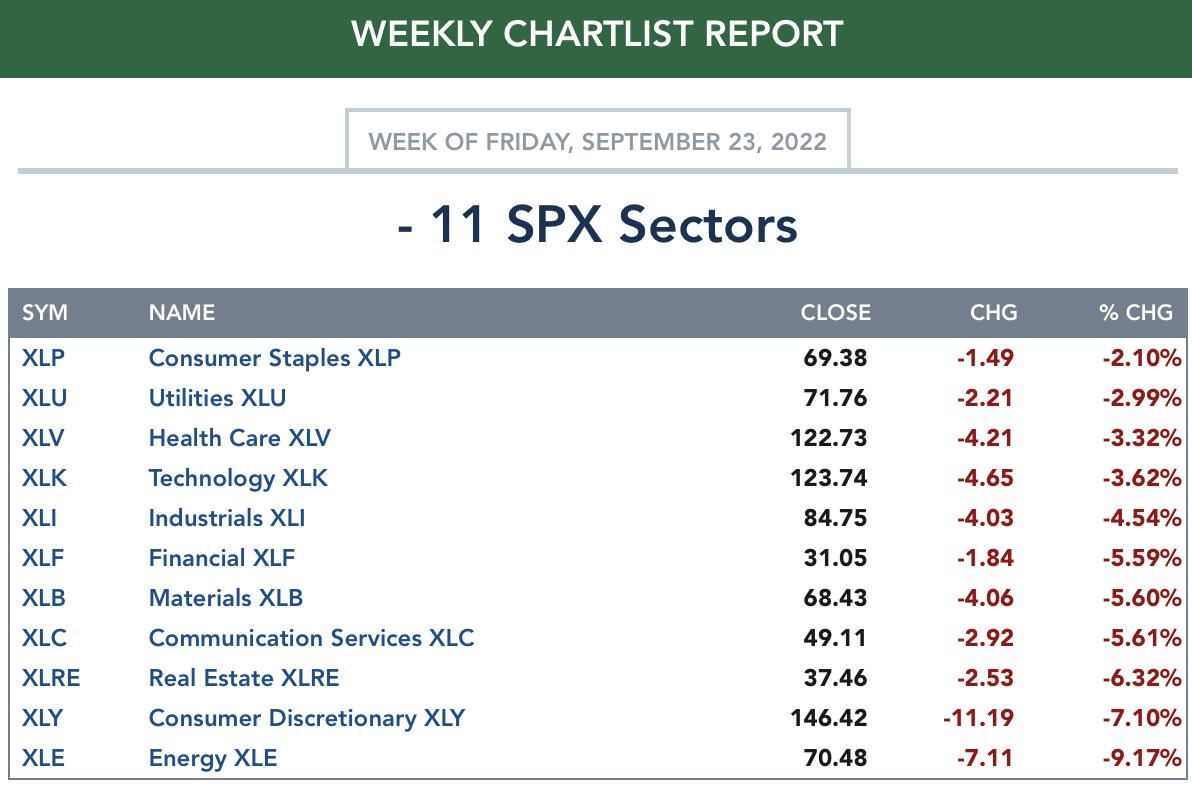
THIS WEEK's Sector Performance:
DecisionPoint Sector Scoreboard (Mechanical Trend Model Signals):
Click Here to view Carl's annotated Sector ChartList!
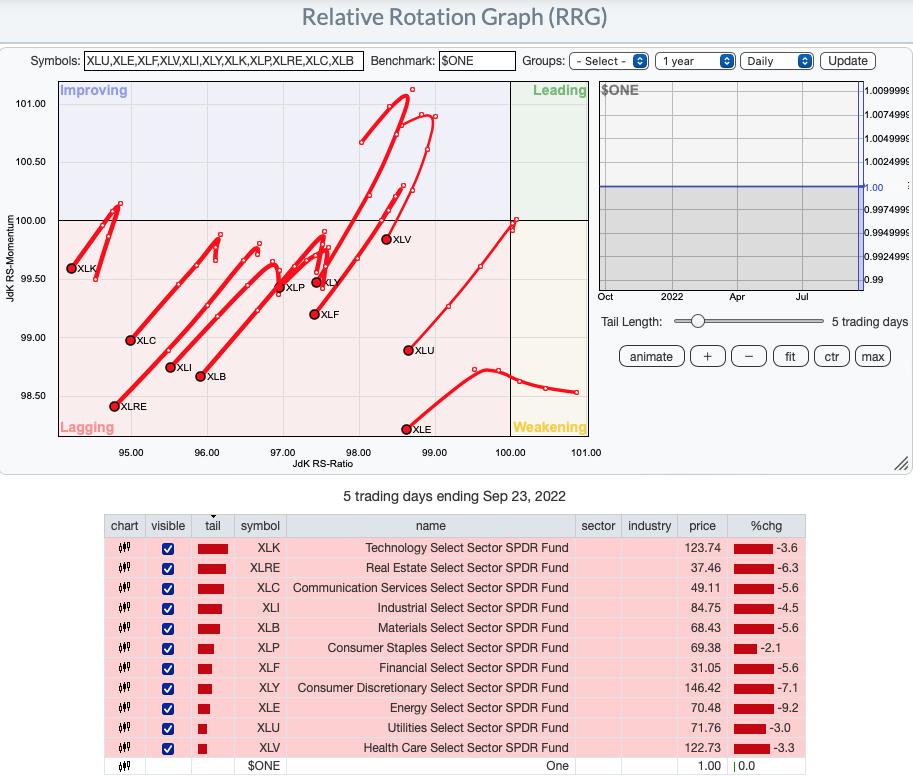
RRG® Daily Chart ($ONE Benchmark):
Can't get much more bearish than what we are seeing, but the sectors are likely to move even further into the Lagging quadrant given the forcefulness of the reversals into bearish southwest headings. This chart shouldn't surprise you.
RRG® Weekly Chart ($ONE Benchmark):
The weekly RRG is deteriorating but isn't as bearish as the daily version. Still, this week we saw the deterioration of XLC, XLV (now in Lagging quadrant) and XLP. All three have bearish southwest headings.
That doesn't mean that the other sectors are bullish. We have three in the Leading quadrant and although XLU has tipped over southward, it should stay in Leading for a bit longer. XLE is the only sector with a bullish northeast heading and it managed to work its way into the Leading quadrant. XLY also managed to move into the Leading quadrant and despite a southward component to its heading, it looks safe from the negative Weakening and Lagging quadrants.
The rest are starting to add southward components to their headings that could put most of them in the Lagging quadrant. XLI has an opportunity to peek into the Leading quadrant, but with that hook it is making, it wouldn't likely last long.
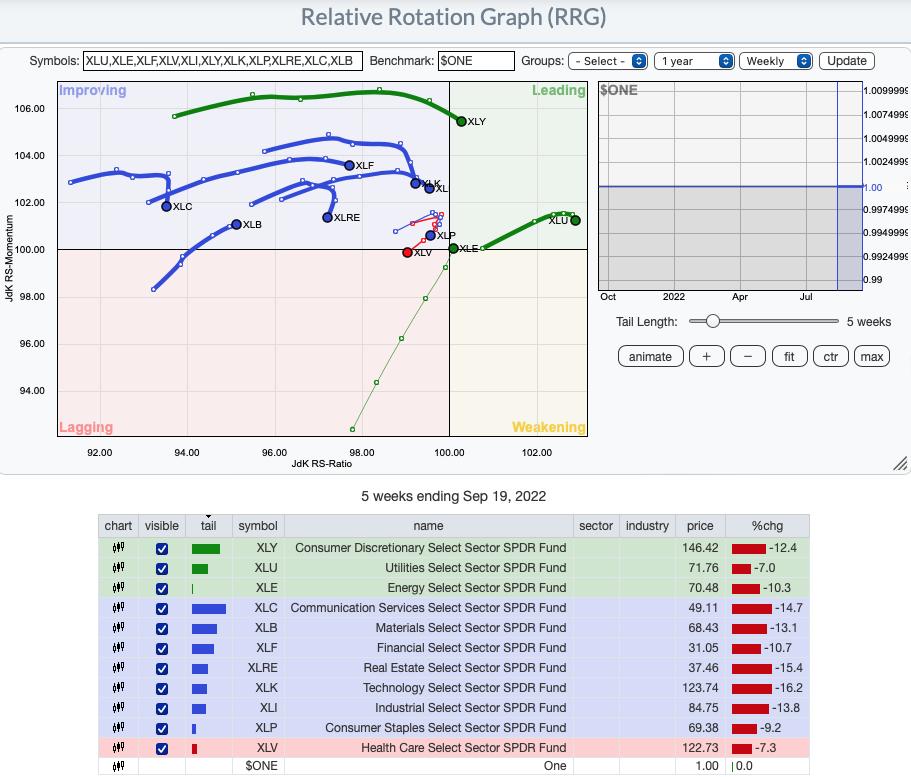
RRG® charts show you the relative strength and momentum for a group of stocks. Stocks with strong relative strength and momentum appear in the green Leading quadrant. As relative momentum fades, they typically move into the yellow Weakening quadrant. If relative strength then fades, they move into the red Lagging quadrant. Finally, when momentum starts to pick up again, they shift into the blue Improving quadrant.
CLICK HERE for an animated version of the RRG charts.
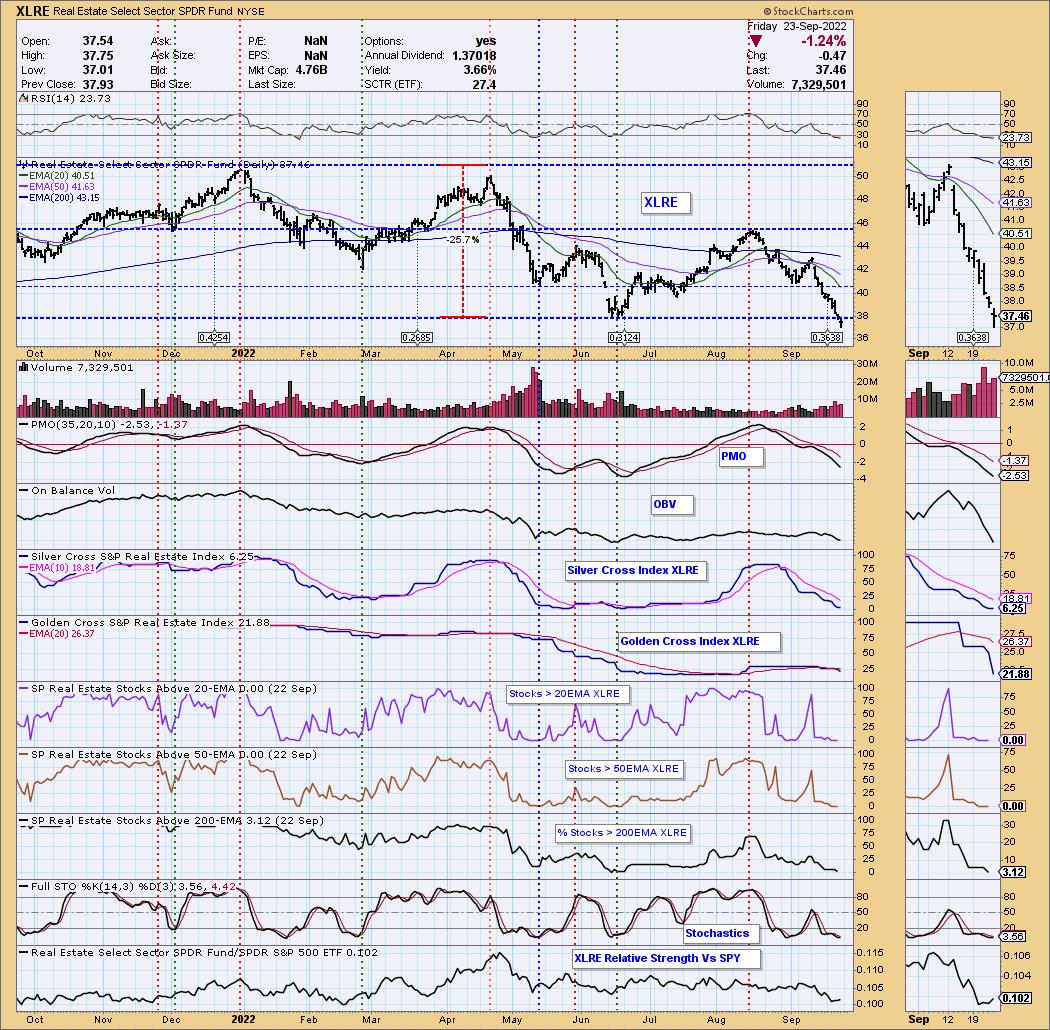
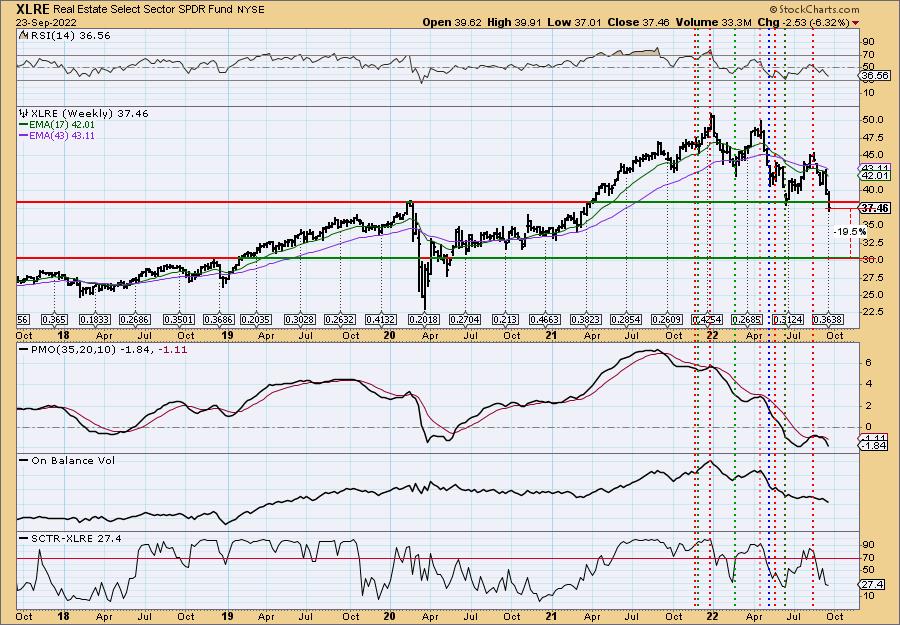
BEARISH Sector to Watch: Real Estate (XLRE)
I decided in the Diamond Mine that Real Estate is breaking down more so than others. Participation is nowhere to be found as we ZERO stocks above their 20/50-day EMAs and a mere 3.12% above their 200-day EMAs. The industry groups looked terrible. This is a major support level based on the weekly chart. Losing strong support suggests more downside ahead.
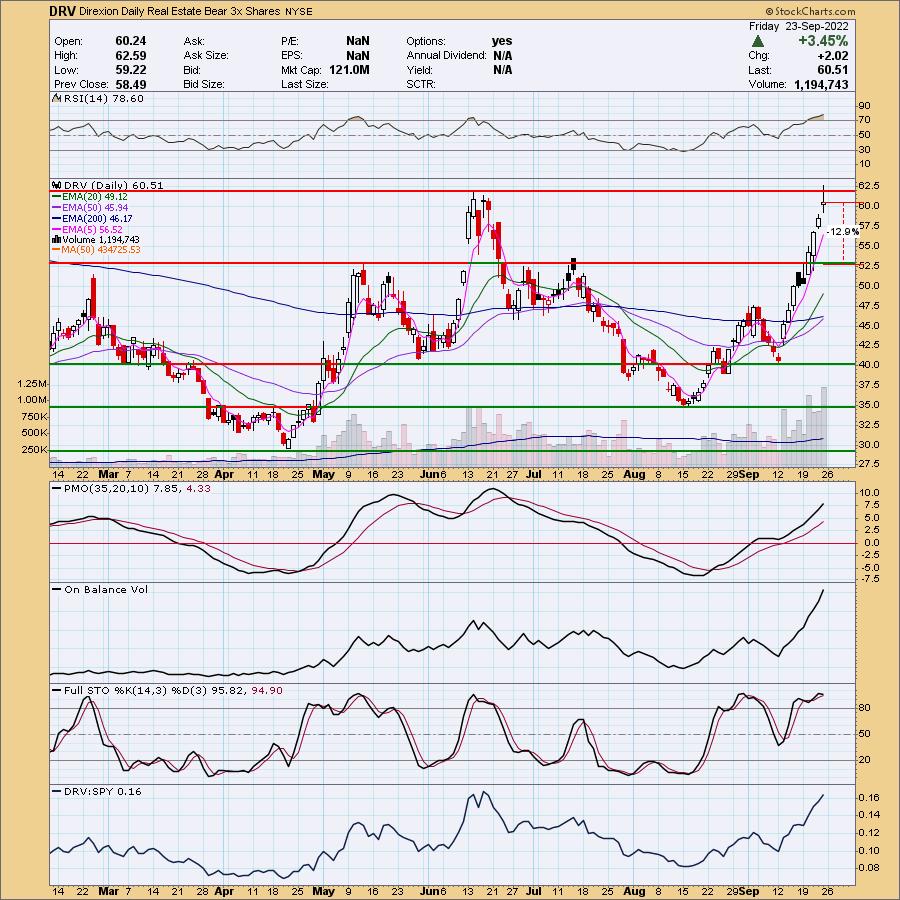
Below is the inverse Real Estate ETF (DRV): It hasn't broken out yet, but based on the sector chart, it should. The PMO is rising strongly and isn't overbought. Stochastics are above 80. Main problem is the RSI is overbought. Because this is a 3x ETF, the stop is deep. Another reason to position size appropriately (1/3rd of the position you would take on a 1x ETF.
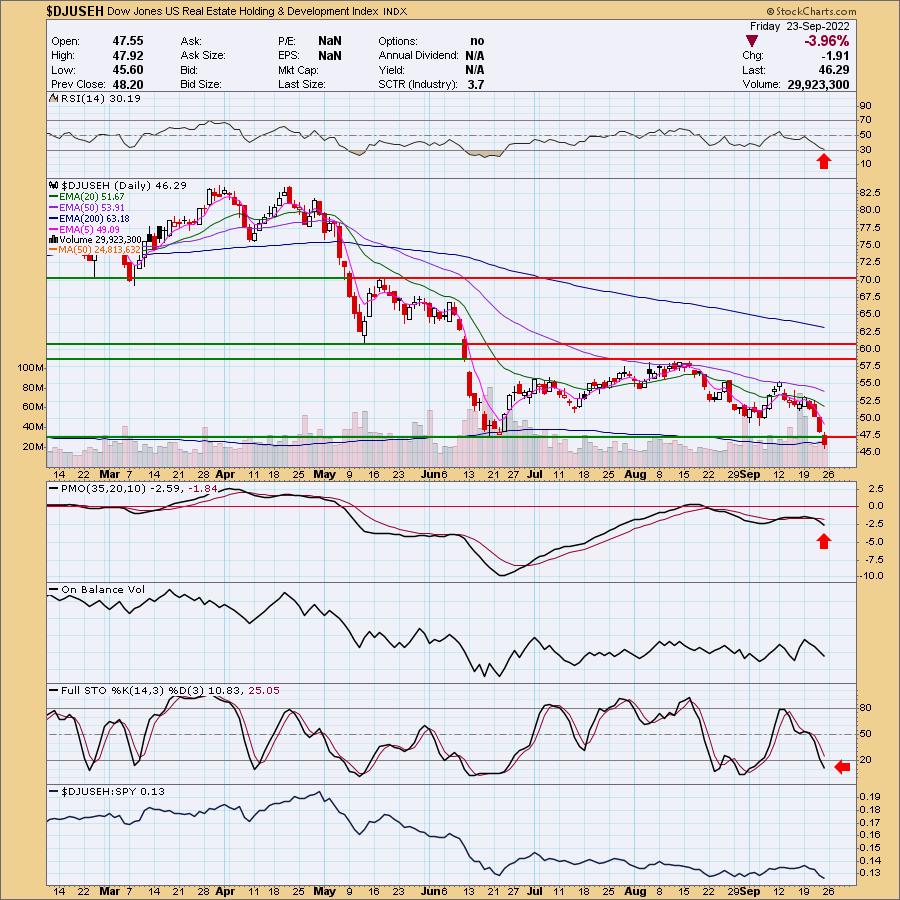
BEARISH Industry Group to Watch: Real Estate Holding & Development ($DJUSEH)
This industry group wasn't actually on my list but after reviewing it post-close, it really looked the most bearish to me. Major support has been broken, negative RSI, falling PMO and Stochastics pointed downward in negative territory. A few symbols for possible shorts would be RDFN and JOE. Although I have to say any of the members in this group that have lost major support would be candidates too.
Go to our Sector ChartList on DecisionPoint.com to get an in-depth view of all the sectors. On StockCharts.com you can find the Industry Summary.
Have a great weekend! Good Luck & Good Trading!
- Erin
erin@decisionpoint.com
Full Disclosure: I'm 15% exposed.
Watch the latest episode of DecisionPoint with Carl & Erin Swenlin on Mondays 7:00p EST or on the DecisionPoint playlist on the StockCharts TV YouTube channel here!
Technical Analysis is a windsock, not a crystal ball. --Carl Swenlin
NOTE: The stocks reported herein are from mechanical trading model scans that are based upon moving average relationships, momentum and volume. DecisionPoint analysis is then applied to get five selections from the scans. The selections given should prompt readers to do a chart review using their own analysis process. This letter is not a call for a specific action to buy, sell or short any of the stocks provided. There are NO sure things or guaranteed returns on the daily selection of "diamonds in the rough."
Helpful DecisionPoint Links:
DecisionPoint Shared ChartList and DecisionPoint Chart Gallery
Price Momentum Oscillator (PMO)
Swenlin Trading Oscillators (STO-B and STO-V)
(c) Copyright 2022 DecisionPoint.com