
Still not having luck with my scans as they are written. It now takes a few tweaks just to get results. The biggest tweak? Allowing EMAs to be configured negatively (20-day < 50-day < 200-day EMAs). I don't like that for my portfolio. I would just consider any entry on any stock or ETF carefully for risk/reward and appetite for risk.
Tomorrow is ETF Day! We will have to see if inverses rule the results or not.
Good Luck & Good Trading!
Erin
Today's "Diamonds in the Rough": ADTN, FGEN and INST
Runners Up: INBX, PBF, KNSA, SILK and KNX.

RECORDING LINK (9/23/2022):
Topic: DecisionPoint Diamond Mine (9/23/2022) LIVE Trading Room
Start Time: Sept 23, 2022 09:00 AM
Passcode: Sept*23rd
REGISTRATION For Friday 9/30 Diamond Mine:
When: Sep 30, 2022 09:00 AM Pacific Time (US and Canada)
Topic: DecisionPoint Diamond Mine (9/30/2022) LIVE Trading Room
Register in advance for this webinar HERE
Save the registration confirmation email with login instructions in case Zoom doesn't notify you in time.
*** NO DIAMOND MINE ON 10/7 ***
I will be at ChartCon 2022 on Friday and unable to hold the trading room. I'm planning on doing the Recap, but that is tentative. You will receive your ten picks for the week including ETF Day and Reader Request Day.
I'll be running trading rooms with Dave Landry so you might want to sign up to attend ChartCon 2022! I'll also be debating my friend, Tom Bowley point/counterpoint style bear v. bull! The event will not be like it was in the past. It is more of a television production with entertaining segments that will make education fun! Here is the link.

Here is the Monday 9/26 recording:
Welcome to DecisionPoint Diamonds, wherein I highlight ten "Diamonds in the Rough" per week. These are selected from the results of my DecisionPoint Scans, which search for stocks that could benefit from the trend and condition of the market. Remember, these are not recommendations to buy or sell, but are the most interesting of the stocks that surfaced in my scans. My objective is to save you the work of the initial, tedious culling process, but you need to apply your own analysis to see if these stocks pique your interest as well. There are no guaranteed winners here!
"Predefined Scans Triggered" are taken from StockCharts.com using the "Symbol Summary" option instead of a "SharpChart" on the workbench.
ADTRAN, Inc. (ADTN)
EARNINGS: 11/2/2022 (AMC)
ADTRAN Holdings, Inc. develops and provides network access solutions. It is a global provider of open, disaggregated networking and communications equipment that enable voice, data, video and internet communications across any network infrastructure. The company was founded in 1985 and is headquartered in Huntsville, AL.
Predefined Scans Triggered: Bullish MACD Crossovers.
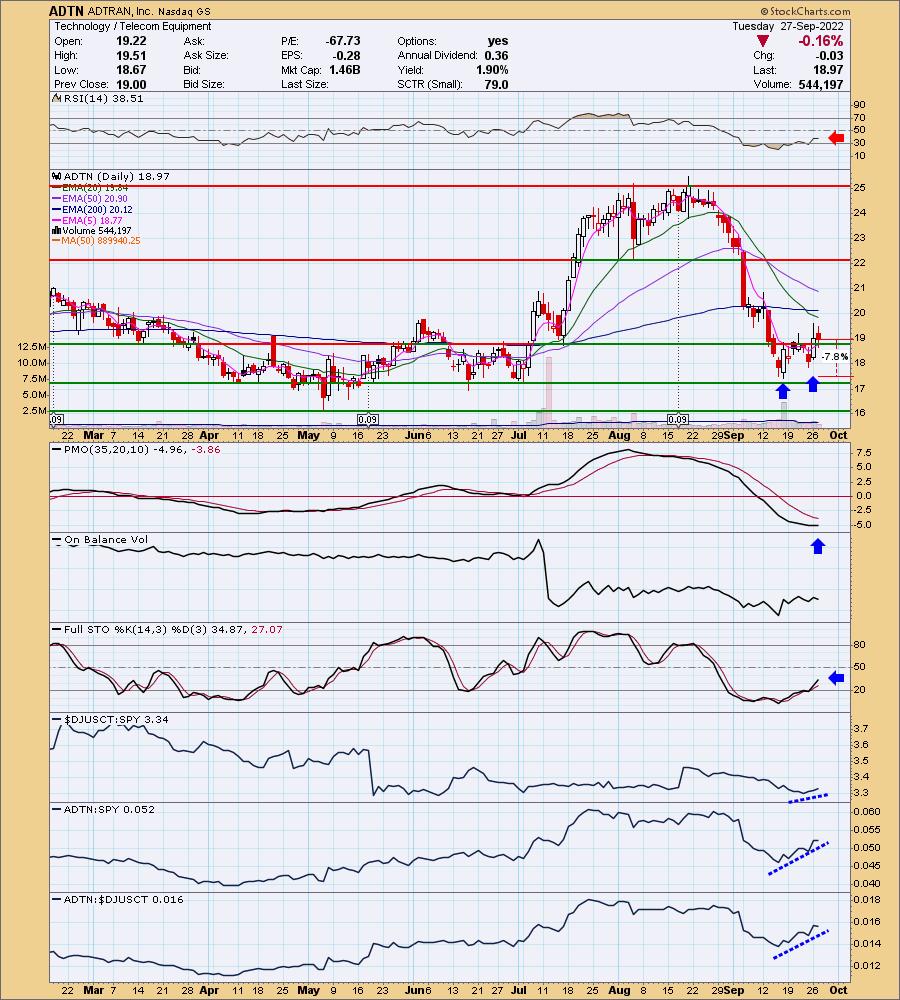
ADTN is unchanged in after hours trading. One of the things that caught my eye was the double-bottom formation. Not thrilled with the negative RSI, but the PMO did start to rise today. The OBV does show a confirmation with rising bottoms matching price bottoms. Stochastics are rising but still negative. It is a relatively strong performer against its group and the SPY. Would like to see the group itself begin outperforming more. The stop is set at 7.8% or around $17.49.
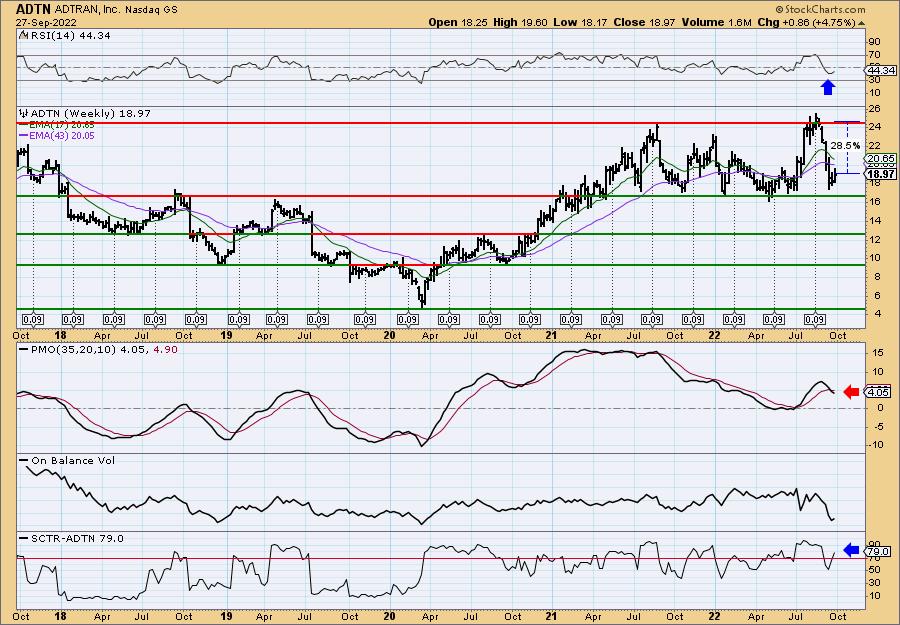
I like that it is in a trading range, mainly because it is currently sitting near the bottom of it. The weekly RSI is rising but negative. The weekly PMO looks bad, but we do see the SCTR is an acceptable 79%.
FibroGen, Inc. (FGEN)
EARNINGS: 11/8/2022 (AMC)
FibroGen, Inc. is a biopharmaceutical company, which engages in the discovery, development, and commercialization of novel therapeutics. It focuses on the hypoxia-inducible factor and connective tissue growth factor biology to develop medicines for the treatment of anemia, fibrotic disease, and cancer. The company was founded by Thomas B. Neff on September 29, 1993 and is headquartered in San Francisco, CA.
Predefined Scans Triggered: Elder Bar Turned Green and Bullish MACD Crossovers.
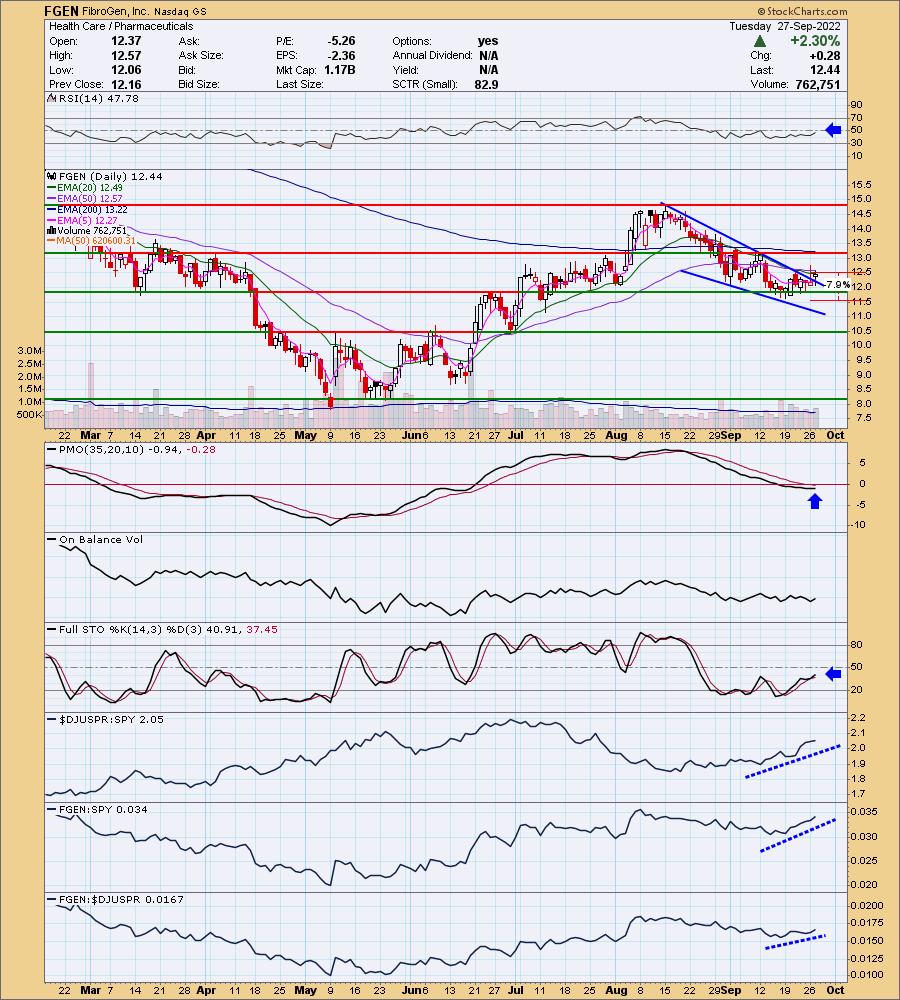
FGEN is down -0.24% in after hours trading. I like the breakout that confirms the bullish falling wedge. It would be nice if price would get above the 20/50-day EMAs, but given the setup it should. The RSI is negative but at least rising. The PMO just turned up today. Stochastics are rising, but not with enthusiasm. Relative strength analysis is very good as the group is improving and FGEN is one of the outperforming members of the group. The stop is set below support at 7.9% around $11.46.
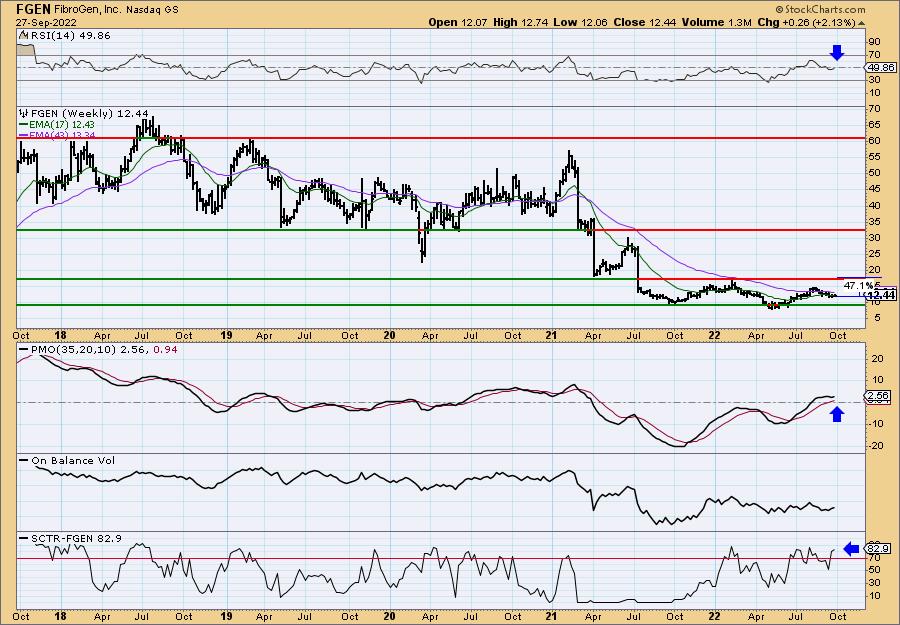
Upside potential is excellent. The weekly RSI is near positive territory. The weekly PMO has turned up above its signal line. The OBV lows are angling upward with price. We have a strong 82.9% SCTR.
Instructure Holdings Inc. (INST)
EARNINGS: 11/1/2022 (AMC)
Instructure Holdings, Inc. engages in the development and provision of cloud-based learning management, assessment and performance systems. The company was founded in 2008 and is headquartered in Salt Lake City, UT.
Predefined Scans Triggered: Elder Bar Turned Green and Bullish MACD Crossovers.
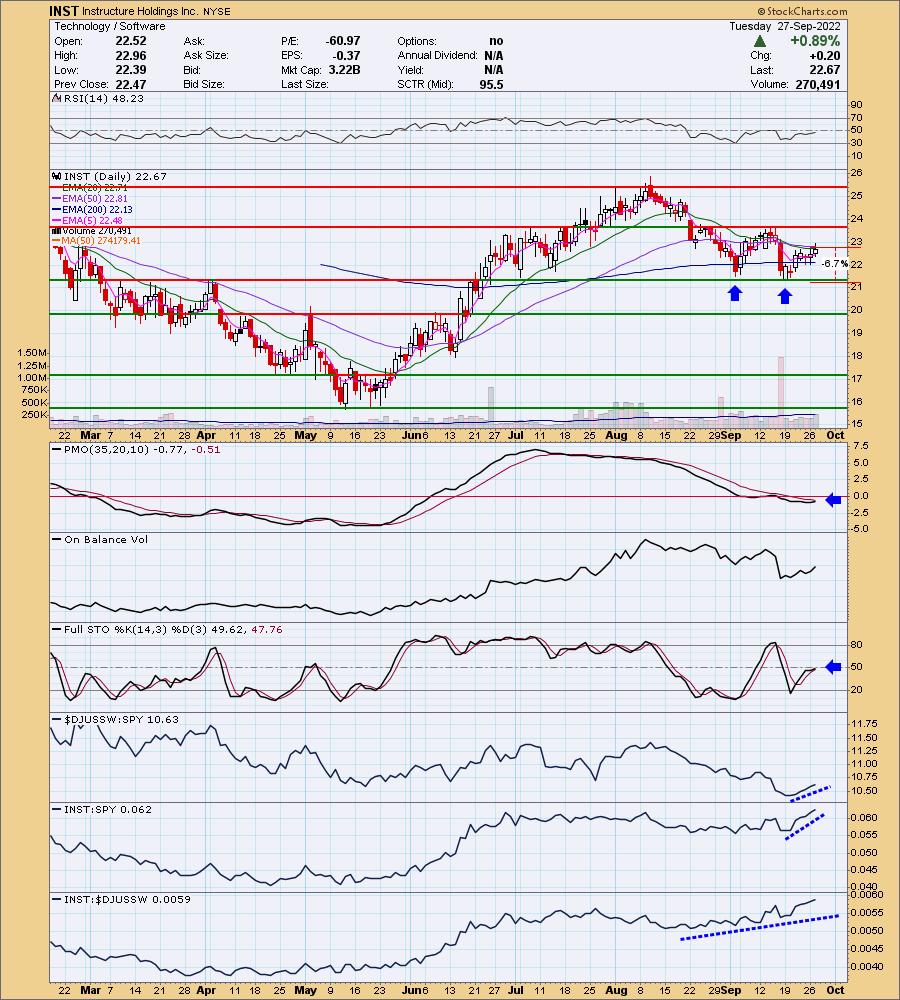
INST is unchanged in after hours trading. We have another bullish double-bottom pattern. The RSI is negative but rising a bit. The PMO has turned up and is nearing a positive crossover. Stochastics are rising and should reach positive territory soon. Relative strength is picking up for the group (a little bit) and INST is outperforming both the group and the SPY. I've set the stop below support at 6.7% around $21.15.
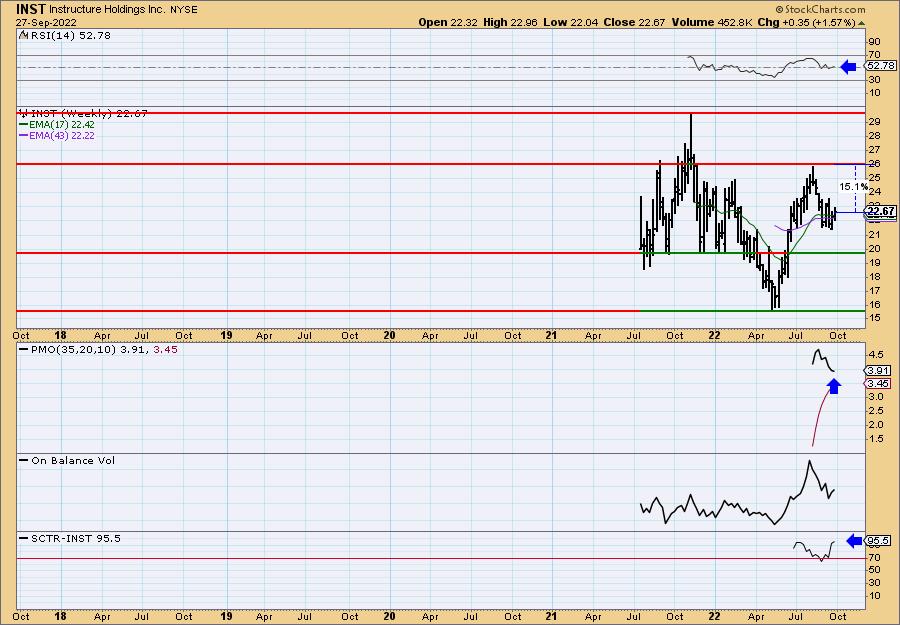
We can't make sweeping conclusion on the weekly chart because it doesn't have much data. Still, the weekly RSI is positive and the weekly PMO is decelerating. The SCTR is fantastic at 95.5%, meaning INST is in the top 5% of all mid-cap stocks. The upside potential isn't as exciting, but it is still a 2 to 1 risk reward ratio.
Don't forget, on Thursdays I look at reader-requested symbols, click HERE to send me an email. I read every email I receive and try to answer them all!
Current Market Outlook:
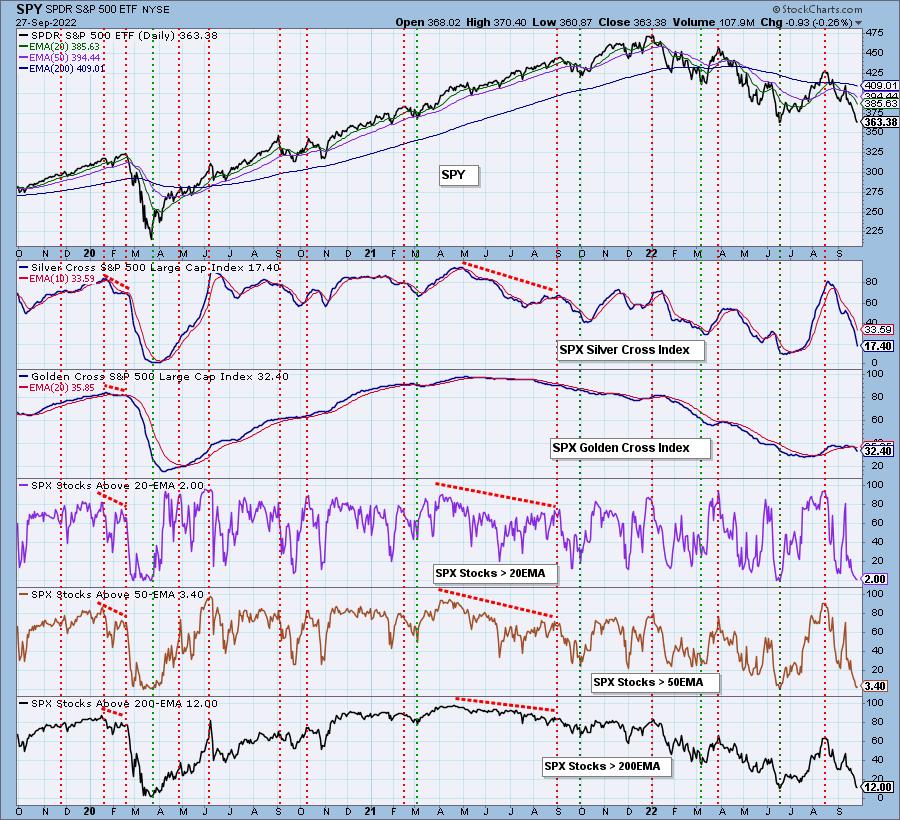
Market Environment: It is important to consider the odds for success by assessing the market tides. The following chart uses different methodologies for objectively showing the depth and trend of participation for intermediate- and long-term time frames.
- The Silver Cross Index (SCI) shows the percentage of SPX stocks on IT Trend Model BUY signals (20-EMA > 50-EMA)
- The Golden Cross Index (GCI) shows the percentage of SPX stocks on LT Trend Model BUY signals (50-EMA > 200-EMA)
Don't forget that as a "Diamonds" member, you have access to our GCI/SCI curated ChartList on DecisionPoint.com. You'll find it under "Members Only" links on the left side on the Blogs and Links Page.
Here is the current chart:
Full Disclosure: I am 10% exposed with 5% hedges.
I'm required to disclose if I currently own a stock I mention and/or may buy/short it within the next 72 hours.
"Technical Analysis is a windsock, not a crystal ball." - Carl Swenlin
(c) Copyright 2022 DecisionPoint.com
Watch the latest episode of DecisionPoint with Carl & Erin Swenlin on Mondays 7:00p EST or on the DecisionPoint playlist on the StockCharts TV YouTube channel here!
NOTE: The stocks reported herein are from mechanical trading model scans that are based upon moving average relationships, momentum and volume. DecisionPoint analysis is then applied to get five selections from the scans. The selections given should prompt readers to do a chart review using their own analysis process. This letter is not a call for a specific action to buy, sell or short any of the stocks provided. There are NO sure things or guaranteed returns on the daily selection of "Diamonds in the Rough."
Regarding BUY/SELL Signals: The signal status reported herein is based upon mechanical trading model signals and crossovers. They define the implied bias of the price index/stock based upon moving average relationships and momentum, but they do not necessarily call for a specific action. They are information flags that should prompt chart review. Further, they do not call for continuous buying or selling during the life of the signal. For example, a BUY signal will probably (but not necessarily) return the best results if action is taken soon after the signal is generated. Additional opportunities for buying may be found as price zigzags higher, but the trader must look for optimum entry points. Conversely, exit points to preserve gains (or minimize losses) may be evident before the model mechanically closes the signal.
Helpful DecisionPoint Links:
DecisionPoint Shared ChartList and DecisionPoint Chart Gallery
Price Momentum Oscillator (PMO)
Swenlin Trading Oscillators (STO-B and STO-V)
For more links, go to DecisionPoint.com