
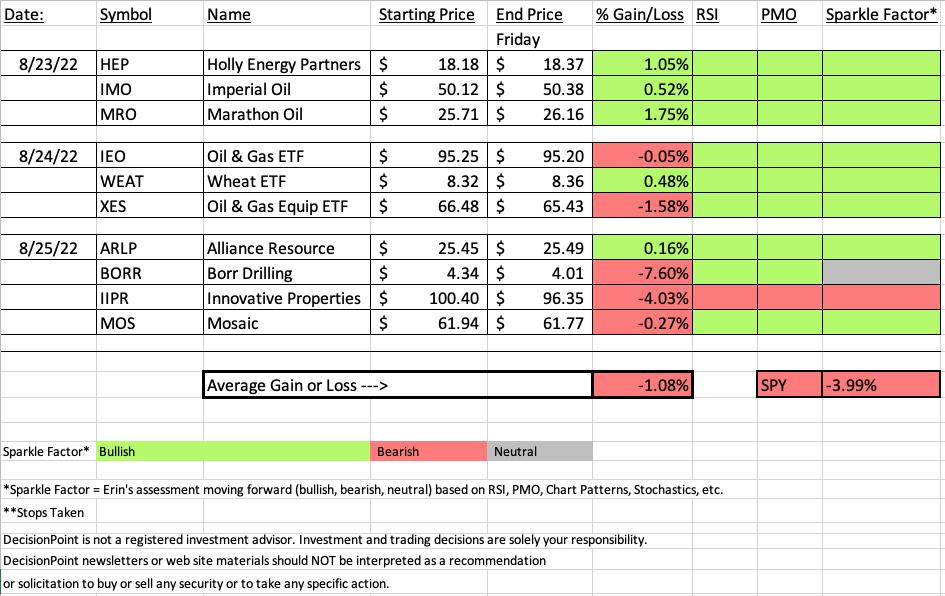
The SPY fell apart today causing a weekly loss of -3.99%. "Diamonds in the Rough" were sitting pretty, but yesterday on reader request fell way short and my addition yesterday also dropped significantly in one day. Had these two been subtracted "Diamonds in the Rough", the average for the week would've been up +0.26%. Unfortunately, when those two are included the was -1.08%. I still feel good about this given the decimation of the SP500 this week.
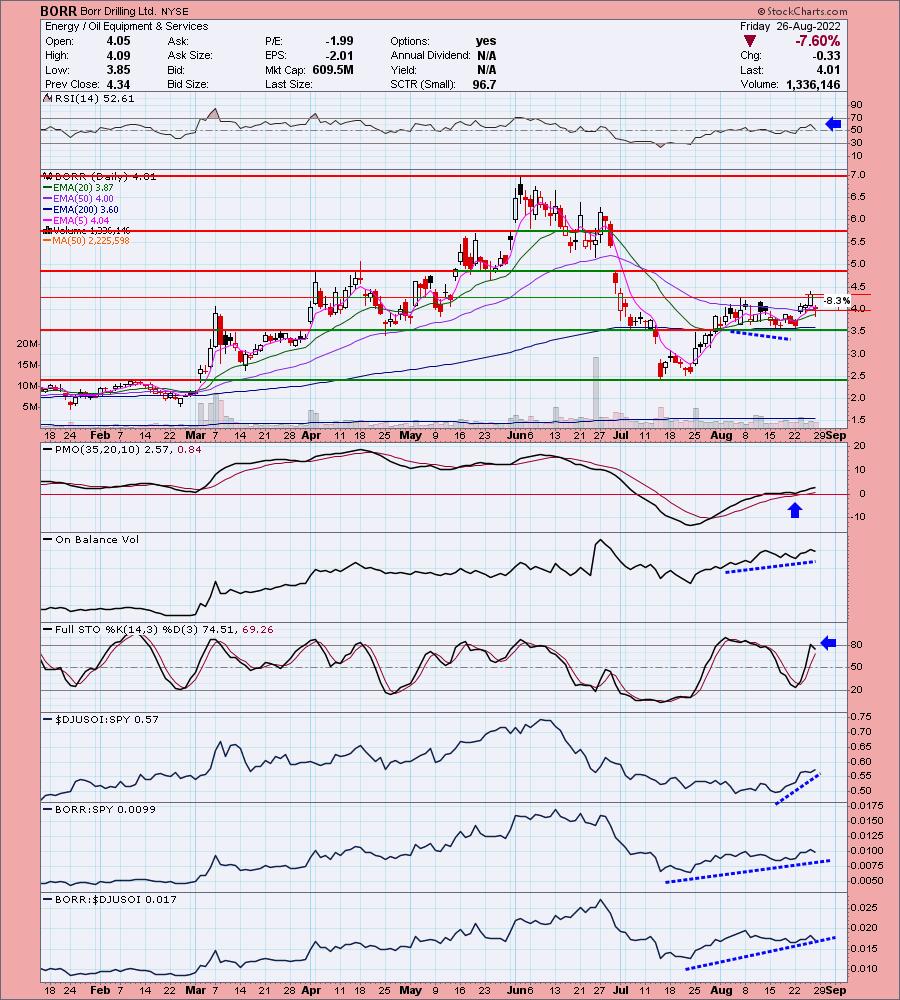
BORR was the "Dud", down -7.6%. It didn't hit the 8.1% stop level, but it did dip below during the day. It's an Energy stock and was quite a surprise for all of us this morning in the Diamond Mine trading room. Apparently it has something to do with share buybacks. It was hard to decipher what pushed it over the edge today. IIPR I brought to the table yesterday. It is watch list material at this point.
The "Darling" this week was Marathon Oil (MRO). Energy is still outperforming and while this one only finished up +1.75%, it looks excellent moving forward. The Crude Oil chart is suspect though so keep your finger on the pulse of USO.
You'll find the "Sector to Watch" and "Industry Group to Watch" as well as a few symbols to monitor going into next week.
The recording link for today's Diamond Mine is below as well as the registration for next Friday's Diamond Mine. Have a great weekend!
Good Luck & Good Trading,
Erin

TODAY'S RECORDING LINK (8/26/2022):
Topic: DecisionPoint Diamond Mine (8/26/2022) LIVE Trading Room
Start Time: Aug 26, 2022 09:00 AM
Meeting Recording Link
Access Passcode: August*26
REGISTRATION For Friday 9/2 Diamond Mine:
When: Sep 2, 2022 09:00 AM Pacific Time (US and Canada)
Topic: DecisionPoint Diamond Mine (9/2/2022) LIVE Trading Room
Register in advance for this webinar HERE
Save the registration confirmation email with login instructions in case Zoom doesn't notify you in time.

Here is the link to the August 22nd The DecisionPoint Trading Room:
A few items about the spreadsheet: I've put on the spreadsheet whether the RSI is positive (green) or negative (red). The PMO column tells you if it is rising (green) or falling (red). Finally I've added my own "Sparkle Factor" that gives you my assessment going forward, bullish (green), bearish (red) or neutral (gray). The Sparkle Factor is basically my thoughts on whether I expect it to rise or fall. A neutral means it could really go either way so it could be added to a watch list. If you're in a stock I consider "neutral" going forward, the ball is in your court.
Darling:
Marathon Oil (MRO)
EARNINGS: 11/2/2022 (AMC)
Marathon Oil Corp. engages in the exploration, production, and marketing of liquid hydrocarbons and natural gas. It operates through the following two segments: United States (U. S.) and International. The U. S. segment engages in oil and gas exploration, development and production activities in the U.S. The International segment engages in oil and gas development and production across international locations primarily in Equatorial Guinea and the United Kingdom. The company was founded in 1887 and is headquartered in Houston, TX.
Predefined Scans Triggered: Moved Above Upper Price Channel and P&F Double Top Breakout.
Below are the commentary and chart from Tuesday 8/23:
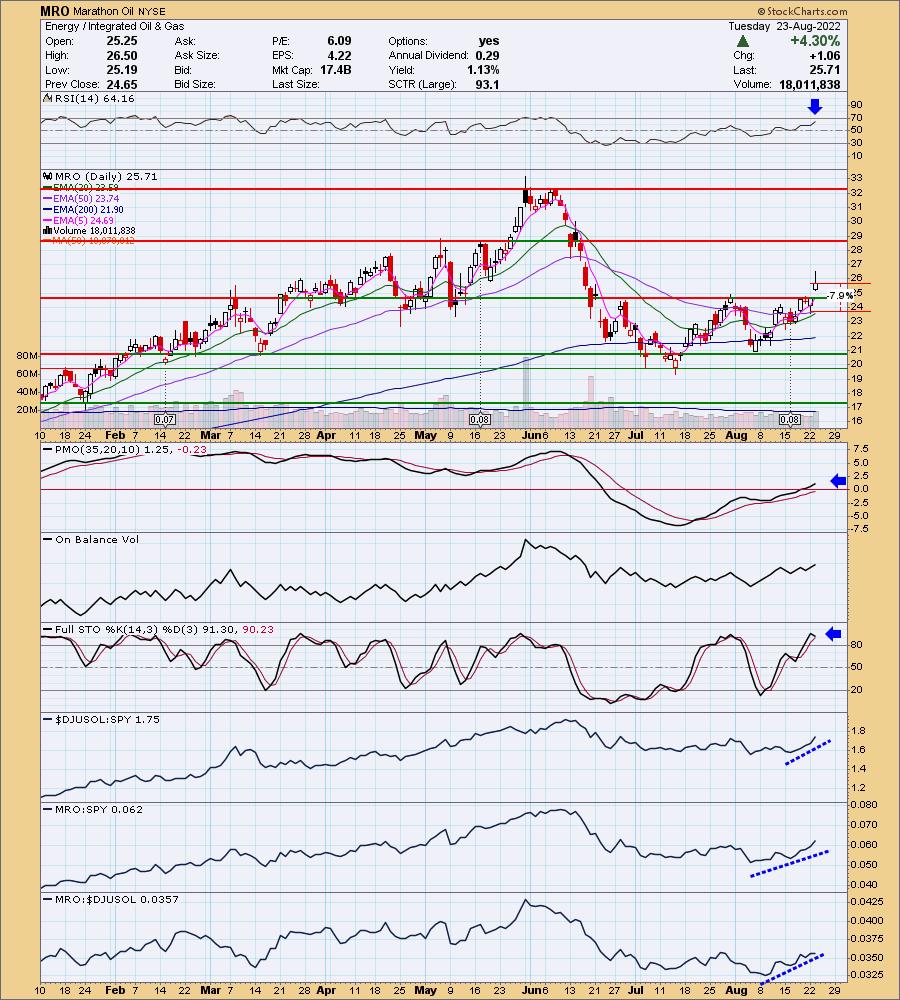
"MRO is up +0.43% in after hours trading. I covered it on April 14th 2022 (position closed). Here is another double-bottom confirmation breakout. What I like about these is that they aren't overbought. The RSI is positive and the PMO only just reached above the zero line. The OBV is confirming the rally. Stochastics did tip over, but they were running out of headroom. As long as they remain above 80, we should be good. This is another strong relative performer against the group. The stop is set at 7.9% around $23.28."
Here is today's chart:
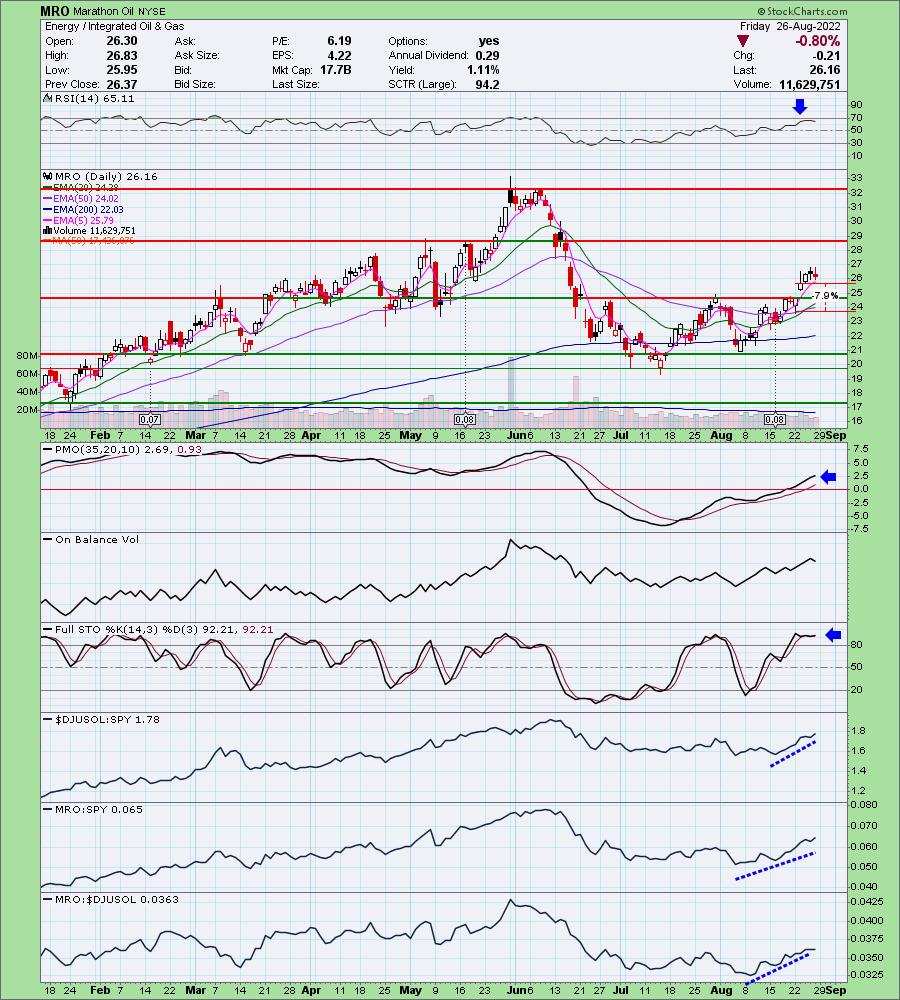
MRO was not immune to today's decline, but it was hardly noticeable compared to the vast majority of stocks that were down today. Yesterday's filled black candlestick suggested today would be a pullback. The chart didn't deteriorate today and actually is improving as the RSI is moving away from overbought territory but staying firmly above net neutral (50). I expect this one to continue higher. But as noted in the opening, we need to keep a close eye on Crude. It's acting toppy.
Don't forget, on Thursdays I look at reader-requested symbols, so shoot me an email at erin@decisionpoint.com. I read every email I receive and try to answer them all!
Dud:
Borr Drilling Ltd. (BORR)
EARNINGS: 11/30/2022 (BMO)
Borr Drilling Ltd. engages in the provision of offshore drilling services to the oil and gas industry. It operates through Dayrate; and Integrated Well Services (IWS) segments. The Dayrate segment consists of rig charters and ancillary services. The IWS segment provides integrated well services through Opex and Akal. The company was founded by Tor Olav Trøim on August 8, 2016 and is headquartered in Hamilton, Bermuda.
Predefined Scans Triggered: Moved Above Upper Bollinger Band, Moved Above Upper Price Channel, Stocks in a New Uptrend (Aroon), Parabolic SAR Buy Signals and P&F Low Pole.
Below are the commentary and chart from yesterday 8/25:
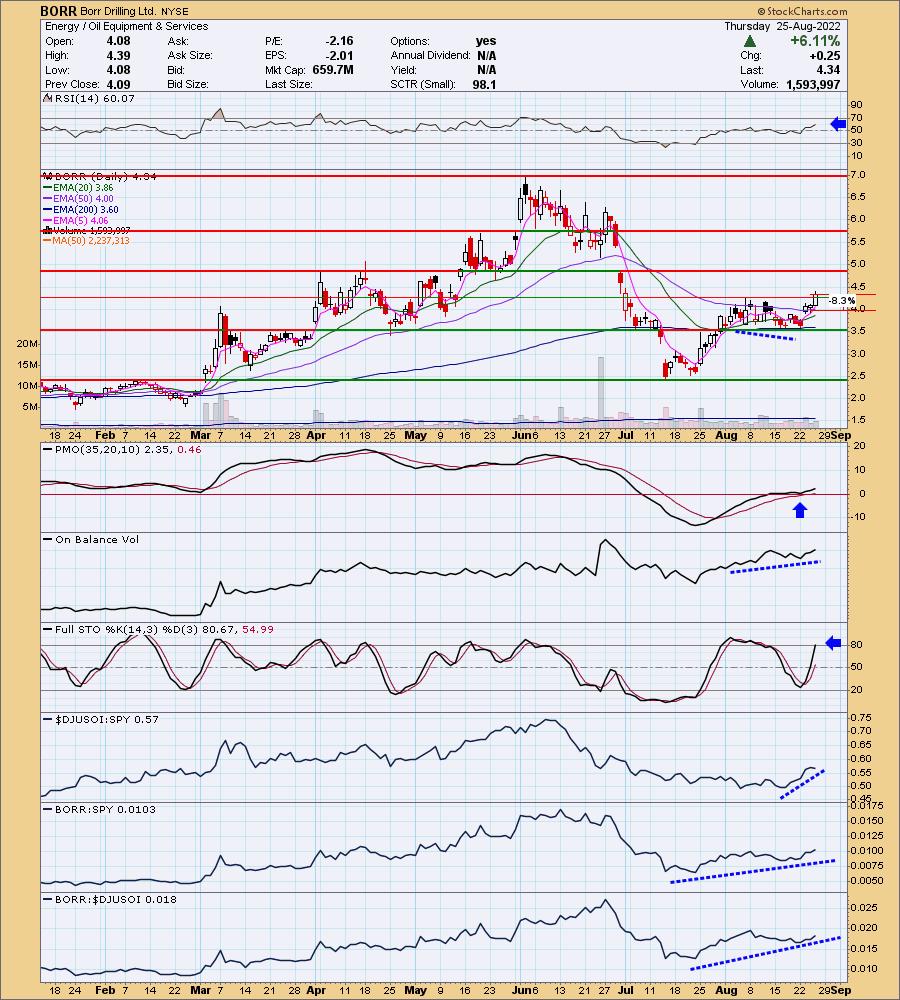
"BORR is unchanged in after hours trading. Today's breakout was impressive on a 6%+ gain. The RSI is positive and not overbought. The PMO is rising after bottoming above both the signal line and zero line. There is a positive OBV divergence leading into this breakout which implies a rally continuation. Stochastics just moved above 80. Relative strength over the past two months been picking up for BORR and in the very short term it is outperforming again. The stop is set around the 50-day EMA at 8.3% or $3.98. Which reminds me... this is a very low-priced stock so position size wisely."
Here is today's chart:
Rather continue higher after its breakout, it has now returned to its prior trading range. As noted in the opening, we smelled something fishy in the trading room on this one. Energy sector looks excellent as does this industry group. Clearly there are better choices than this one. However, the PMO is still rising and the RSI is positive. Unfortunately the RSI and Stochastics are deteriorating.
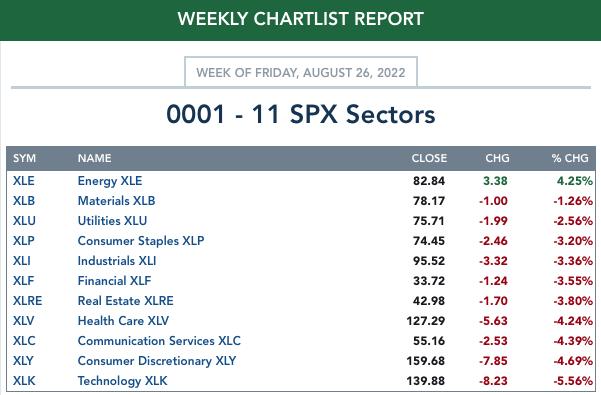
THIS WEEK's Sector Performance:
DecisionPoint Sector Scoreboard (Mechanical Trend Model Signals):

Click Here to view Carl's annotated Sector ChartList!
RRG® Daily Chart ($ONE Benchmark):
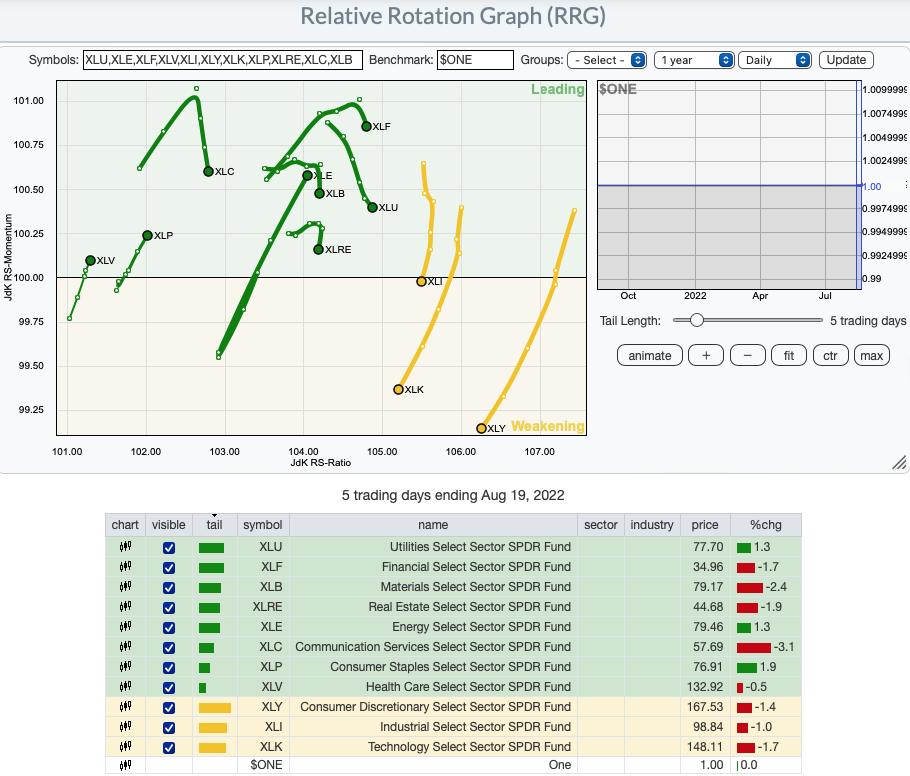
The daily RRG turned very bearish in just one week. Below is last week's:
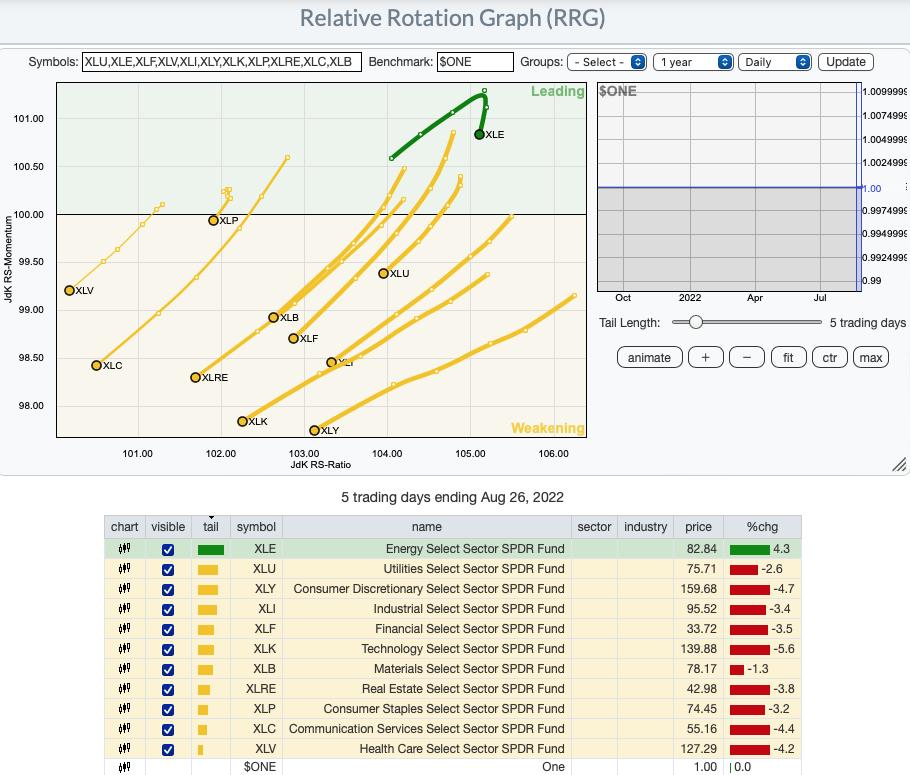
This week saw a major shift as every sector has a bearish southwest heading. Energy is the clear leader even when you don't see it on an RRG, so it isn't surprising that it remains in the Leading quadrant. Its heading tells us that the bear market is pressuring every sector not just a few.
RRG® Weekly Chart ($ONE Benchmark):
The weekly RRG gives the bulls ammunition. In this longer-term RRG, every sector has a bullish northeast heading. This is reflective of the intermediate-term rally off the June lows. If price continues to fall here, look for this RRG to get bearish. For now, it does give us hope that this is not the beginning of a big down leg.
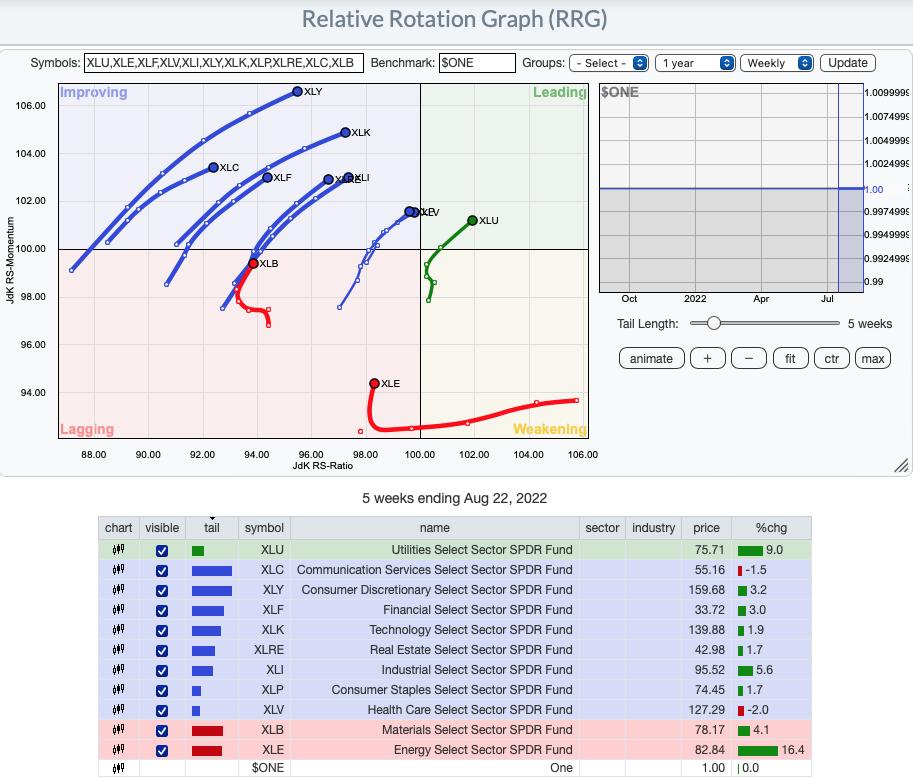
RRG® charts show you the relative strength and momentum for a group of stocks. Stocks with strong relative strength and momentum appear in the green Leading quadrant. As relative momentum fades, they typically move into the yellow Weakening quadrant. If relative strength then fades, they move into the red Lagging quadrant. Finally, when momentum starts to pick up again, they shift into the blue Improving quadrant.
CLICK HERE for an animated version of the RRG charts.
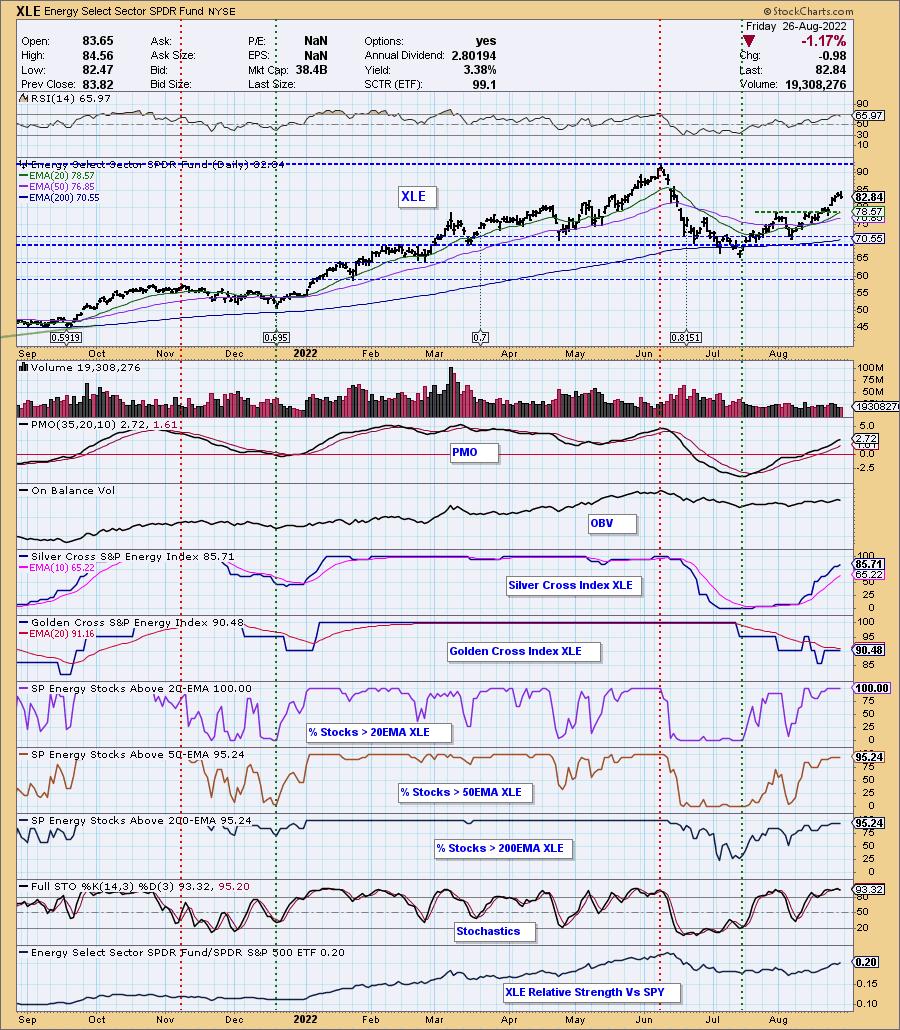
Sector to Watch: Energy (XLE)
It was a no brainer this week for "Sector to Watch". Energy is the only sector showing leadership and the only sector with very strong participation. I will say that Materials (XLB) is looking interesting right now too, but participation is not as robust as XLE's. XLE is the only sector to finish higher this week and it was by a whole lot at +4.25%. The next best sector was XLB, but it finished the week down -1.26%. The PMO is rising and isn't overbought. The RSI pulled out of overbought territory on today's decline. The Silver Cross Index (SCI) is reading a strong 85.71% and it still climbing. The Golden Cross Index (GCI) is a strong 90.48%! %Stocks > 20/50/200-day EMAs are 95% or better.
Industry Group to Watch: Aluminum ($DJUSAL)
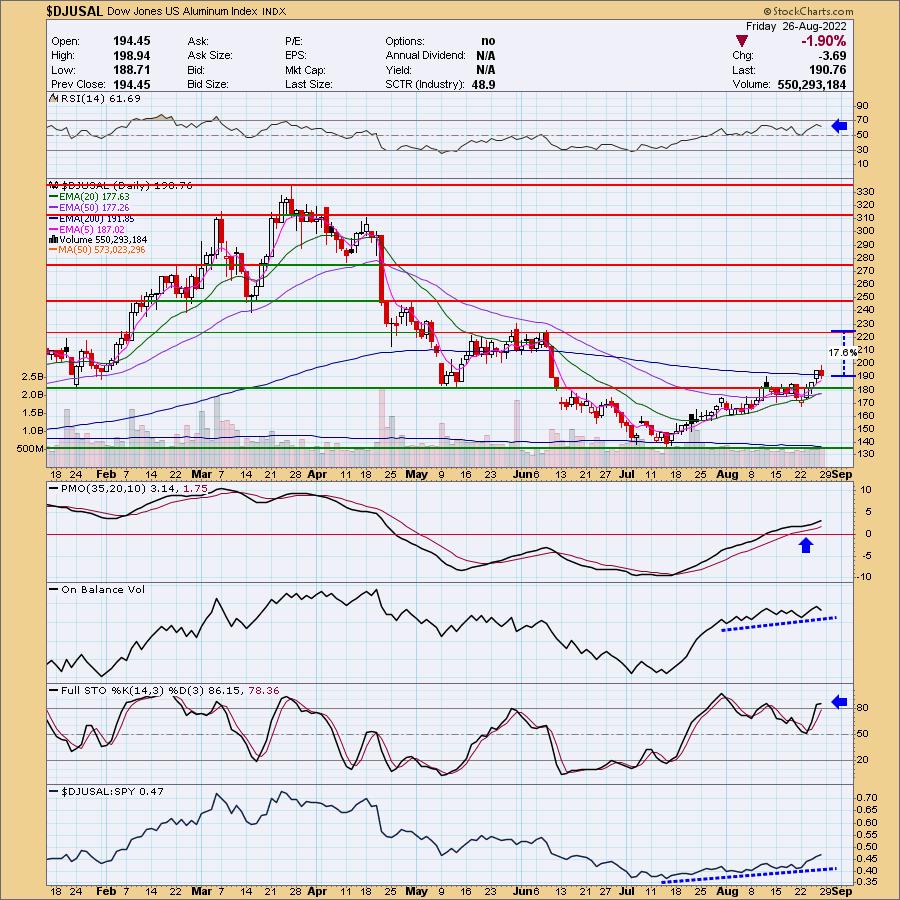
Let me preface by saying that every Energy industry group could be named the "one to watch". I decided to go out of the sector and find something else. Of all of the industry groups that StockCharts tracks (not counting Energy groups), only seven groups have rising momentum. I examined those closely and decided that with Materials perking up, I would go with Aluminum. The RSI is positive and the PMO is rising. It is early in this move so there is plenty of upside opportunity. Even if it gets to the next line of resistance, that would be a 17%+ gain. A few stocks symbols to consider are: AA, NHYDY and ACH. Alcoa (AA) looks the most promising.
Go to our Sector ChartList on DecisionPoint.com to get an in-depth view of all the sectors. On StockCharts.com you can find the Industry Summary.
Have a great weekend! Good Luck & Good Trading!
- Erin
erin@decisionpoint.com
Full Disclosure: I'm 40% exposed.
Watch the latest episode of DecisionPoint with Carl & Erin Swenlin on Mondays 7:00p EST or on the DecisionPoint playlist on the StockCharts TV YouTube channel here!
Technical Analysis is a windsock, not a crystal ball. --Carl Swenlin
NOTE: The stocks reported herein are from mechanical trading model scans that are based upon moving average relationships, momentum and volume. DecisionPoint analysis is then applied to get five selections from the scans. The selections given should prompt readers to do a chart review using their own analysis process. This letter is not a call for a specific action to buy, sell or short any of the stocks provided. There are NO sure things or guaranteed returns on the daily selection of "diamonds in the rough."
Helpful DecisionPoint Links:
DecisionPoint Shared ChartList and DecisionPoint Chart Gallery
Price Momentum Oscillator (PMO)
Swenlin Trading Oscillators (STO-B and STO-V)
(c) Copyright 2022 DecisionPoint.com