
We didn't have a huge amount of reader requests this week, but I thought the selections were very good. Most are in the Energy sector, but I did have an interesting one cross my desk today.
First, based on our ETF Tracker "universe" (if you want the list, StockCharts members can get a link to it on their platform or I'm happy to send you just the list), the Marijuana ETF (MJ) was the best performer today and yesterday it was the second best performer. While it may be too early for this industry politically, it is thriving in states it's been legalized in...with one problem: lack of access to financial institutions. Today, one of my newsletters talked about a high yield Real Estate stock that was helping the industry to keep and rent space. You can read more about it. I would send you the link, but the research is part of a paid newsletter I follow. The chart has merits.
The other three are reader requests that I found interesting. I'm only doing four stocks today (it fulfills my minimum 10 stock picks per week) as my brother is in town and I want to finish up work on time. The Diamond Mine will be open as usual tomorrow at 9a PT. The link is below the Diamonds logo below, as is the recording from last week.
Good Luck & Good Trading!
Erin
Today's "Diamonds in the Rough": ARLP, BORR, IIPR and MOS.
Other requests: ALB, CF, COP, DCGO, EQT, NEX, SM, SQM, ARKK, UNG, TSLA, BGS and FCX.

RECORDING LINK (8/19/2022):
Topic: DecisionPoint Diamond Mine (8/19/2022) LIVE Trading Room
Start Time: Aug 19, 2022 09:00 AM PT
Meeting Recording Link
Passcode: August*19
REGISTRATION FOR Friday 8/26 Diamond Mine:
When: Aug 26, 2022 09:00 AM Pacific Time (US and Canada)
Topic: DecisionPoint Diamond Mine (8/26/2022) LIVE Trading Room
Register in advance for this webinar HERE
Save the registration confirmation email with login instructions in case Zoom doesn't notify you in time.

Last Monday's Recording:
Welcome to DecisionPoint Daily Diamonds, wherein I highlight ten "Diamonds in the Rough" per week. These are selected from the results of my DecisionPoint Scans, which search for stocks that could benefit from the trend and condition of the market. Remember, these are not recommendations to buy or sell, but are the most interesting of the stocks that surfaced in my scans. My objective is to save you the work of the initial, tedious culling process, but you need to apply your own analysis to see if these stocks pique your interest as well. There are no guaranteed winners here!
"Predefined Scans Triggered" are taken from StockCharts.com using the "Symbol Summary" option instead of a "SharpChart" on the workbench.
Alliance Resource Partners, L.P. (ARLP)
EARNINGS: 10/31/2022 (BMO)
Alliance Resource Partners LP is a natural resource company, which produces and markets coal to United States utilities and industrial users. It operates through the following segments: Illinois Basin, Appalachia, Minerals, and Other & Corporate. The Illinois Basin segment is comprised of Webster County coal's Dotiki mining complex, Gibson mining complex, which includes the Gibson north mine and the Gibson south project, Hopkins County coal's Elk Creek mining complex, White County coal's Pattiki mining complex, Warrior's mining complex, River View's mining complex, the Sebree property and certain properties of Alliance Resource Properties and ARP Sebree LLC. The Appalachian segment is composed of Pontiki and MC Mining complexes. The Minerals segment includes its oil & gas mineral interests, which are located primarily in the Permian, Anadarko, and Williston basins. The Other and Corporate segment includes marketing and administrative expenses, Mt. Vernon dock activities, coal brokerage activity, its equity investment in Mid-America Carbonates LLC and certain activities of Alliance Resource Properties. The company was founded in 1971 and is headquartered in Tulsa, OK.
Predefined Scans Triggered: Filled Black Candles, P&F Ascending Triple Top Breakout and P&F Double Top Breakout.
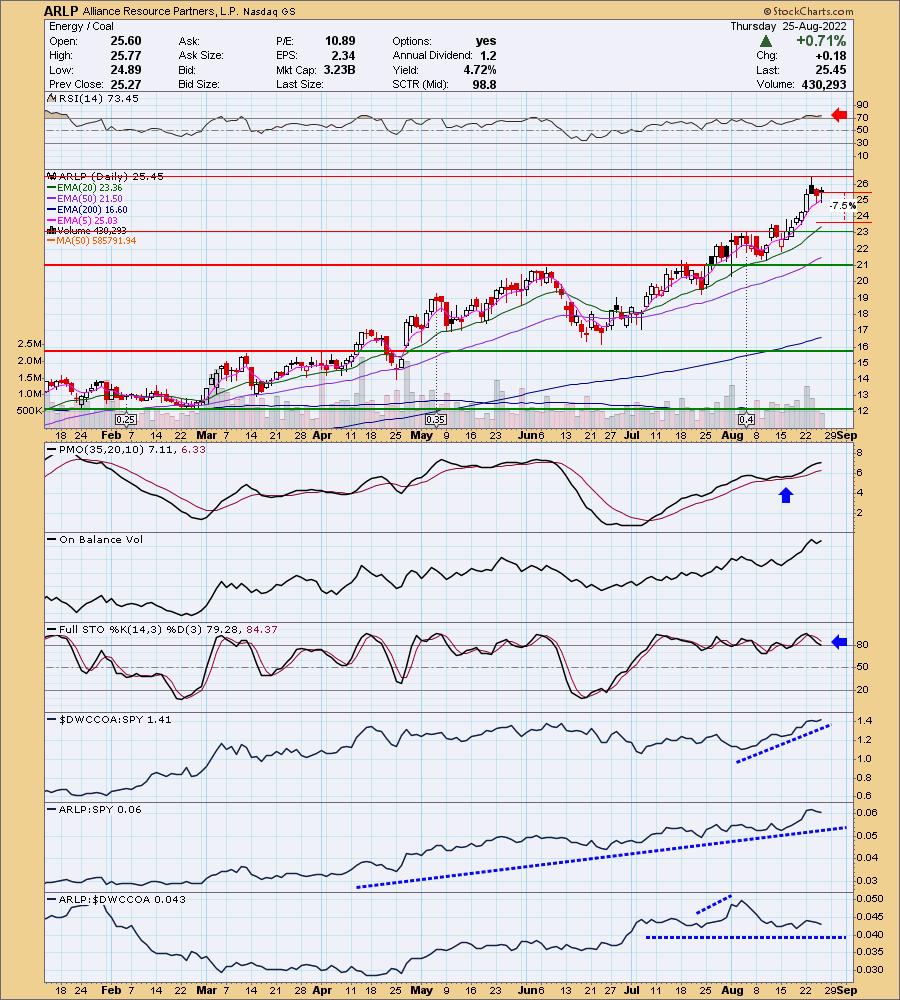
ARLP is up +0.20% in after hours trading. We haven't talked about Coal much considering it is part of the one sector that is outperforming the rest. I was anticipating doing a "this or that" here, but the charts of the major Coal stocks weren't as impressive as ARLP. It is making all-time highs while the others are not even at overhead resistance. There are some issue though. Because it is outperforming, it is now more overbought than the rest. Additionally, the PMO is decelerating while the RSI is overbought. Stochastics dipped below 80. Yes, this isn't my typical "Diamond in the Rough", but it is, if nothing else, great watch list material. Volume is coming in. Overall ARLP is performing in line with the industry group since July, but it has been outperforming the SPY April. I've listed a stop of 7.5% or around $23.54.
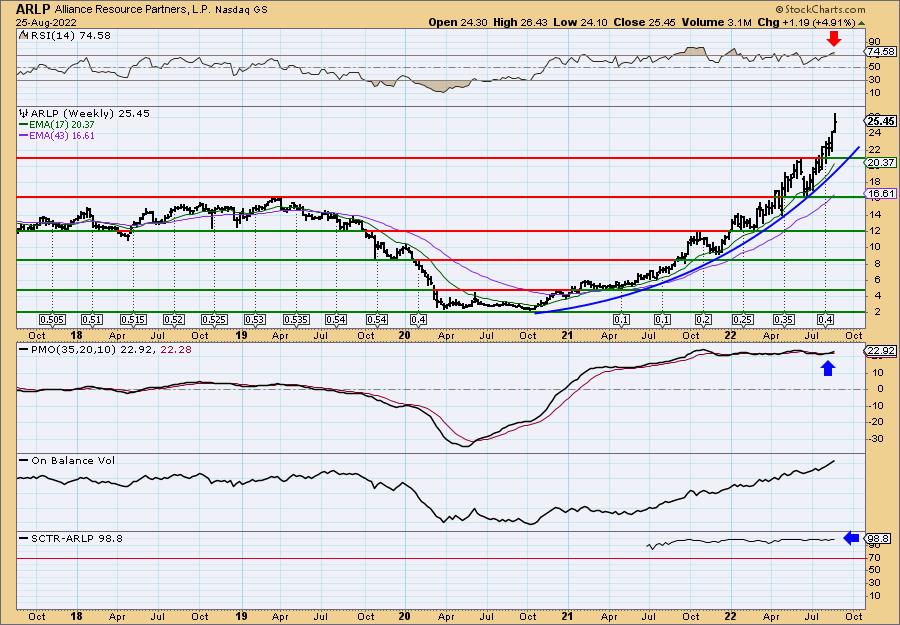
Very strong weekly chart with the exception of overbought conditions and a parabolic rise. The RSI and PMO are overbought. The parabola isn't that steep, but is certainly something to keep in mind if you're looking at this for a longer-term purchase. The weekly PMO is on a BUY signal and the OBV is strongly rising. The SCTR is an excellent 98.8%. Since it is making new all-time highs, consider an upside target around 17% or around $29.78.
Borr Drilling Ltd. (BORR)
EARNINGS: 11/30/2022 (BMO)
Borr Drilling Ltd. engages in the provision of offshore drilling services to the oil and gas industry. It operates through Dayrate; and Integrated Well Services (IWS) segments. The Dayrate segment consists of rig charters and ancillary services. The IWS segment provides integrated well services through Opex and Akal. The company was founded by Tor Olav Trøim on August 8, 2016 and is headquartered in Hamilton, Bermuda.
Predefined Scans Triggered: Moved Above Upper Bollinger Band, Moved Above Upper Price Channel, Stocks in a New Uptrend (Aroon), Parabolic SAR Buy Signals and P&F Low Pole.
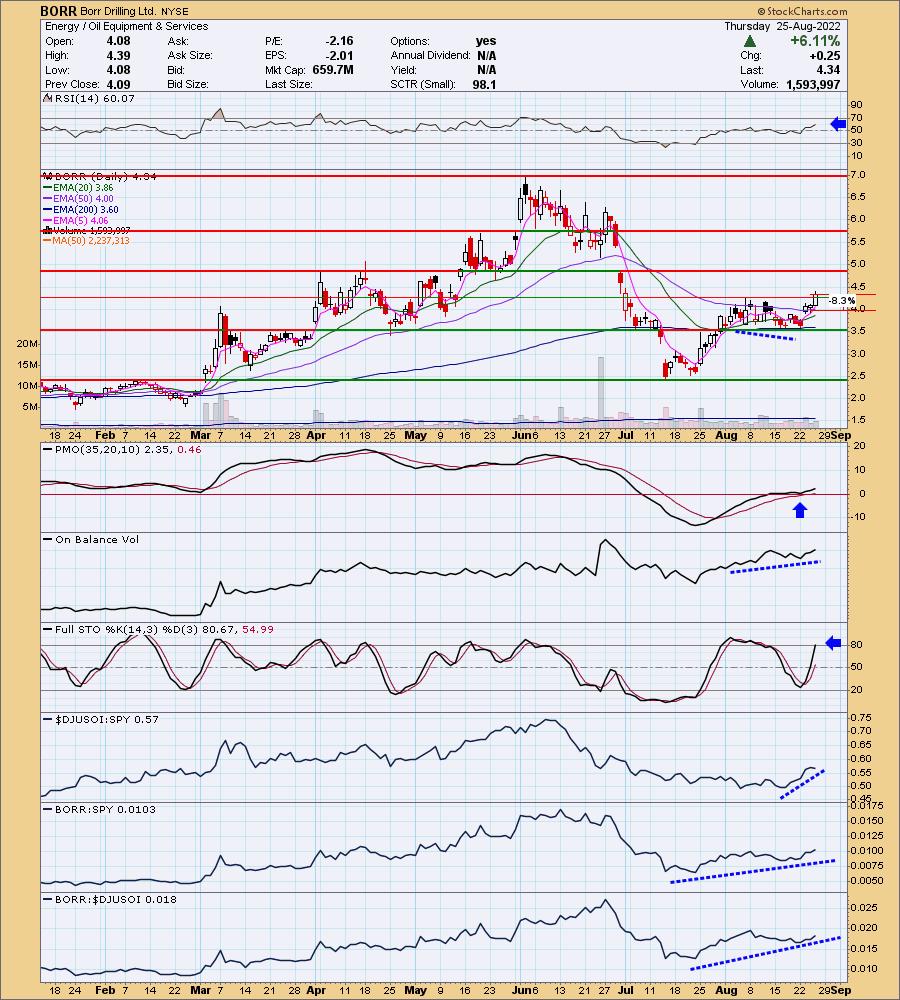
BORR is unchanged in after hours trading. Today's breakout was impressive on a 6%+ gain. The RSI is positive and not overbought. The PMO is rising after bottoming above both the signal line and zero line. There is a positive OBV divergence leading into this breakout which implies a rally continuation. Stochastics just moved above 80. Relative strength over the past two months been picking up for BORR and in the very short term it is outperforming again. The stop is set around the 50-day EMA at 8.3% or $3.98. Which reminds me... this is a very low-priced stock so position size wisely.
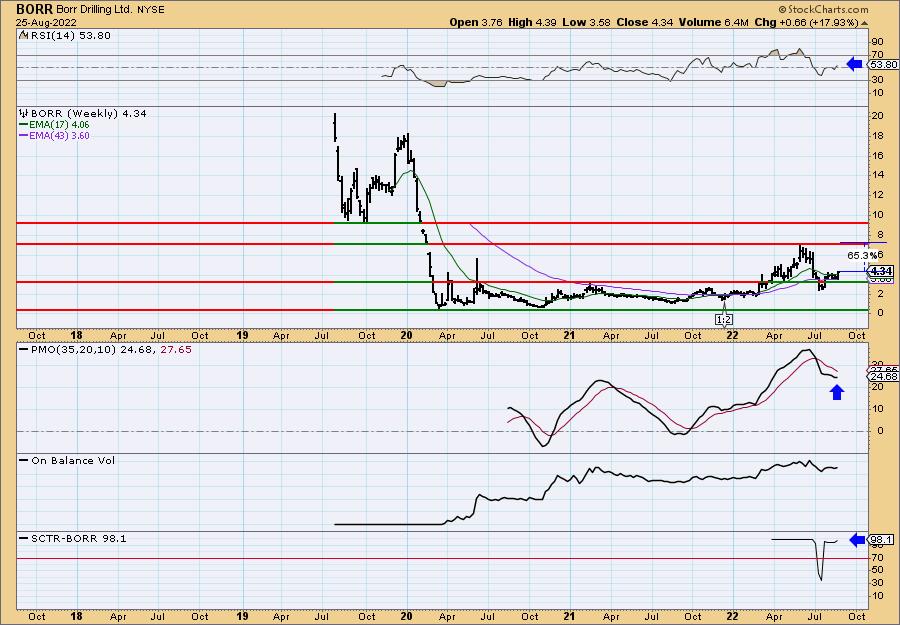
The weekly RSI is now above net neutral (50) and the weekly PMO is turning up. It early for the SCTR calculation, but it still shows its in the top 2% of all small-caps.
Innovative Industrial Properties, Inc. (IIPR)
EARNINGS: 11/2/2022 (AMC)
Innovative Industrial Properties, Inc. is a real estate investment trust, which engages in the acquisition, ownership, and management of industrial properties. It operates through the following geographical segments: Arizona, California, Colorado, Florida, Illinois, Maryland, Massachusetts, Michigan, Minnesota, Missouri, Nevada, New Jersey, New York, North Dakota, Ohio, Pennsylvania, Texas, Virginia and Washington. The firm's property portfolio includes PharmaCann, Inc., SH Parent, Inc., Ascend Wellness Holdings, Inc., Cresco Labs Inc., and Kings Garden Inc. The company was founded by Alan D. Gold and Paul E. Smithers on June 15, 2016 and is headquartered in Park City, UT.
Predefined Scans Triggered: Moved Above Upper Price Channel and P&F Double Top Breakout.
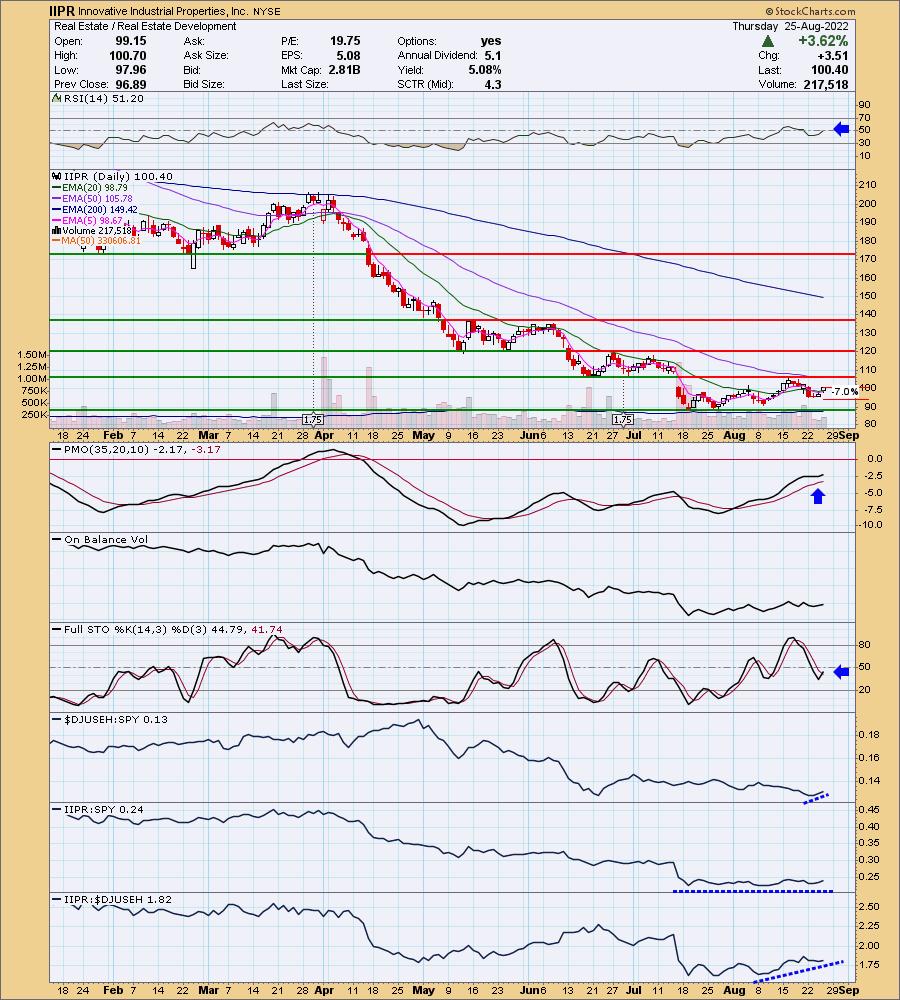
IIPR is down -0.61% in after hours trading. Notice in their description they are rather stealth about their connection to the cannabis industry. It has a great 5%+ yield. The indicators are perking up. The RSI is back above net neutral (50) and the PMO has bottomed above its signal line. Stochastics ticked up today. Performance hasn't been spectacular, but it is in a sector that is underperforming itself. The stop is set below short-term support at about 7% or $93.37.
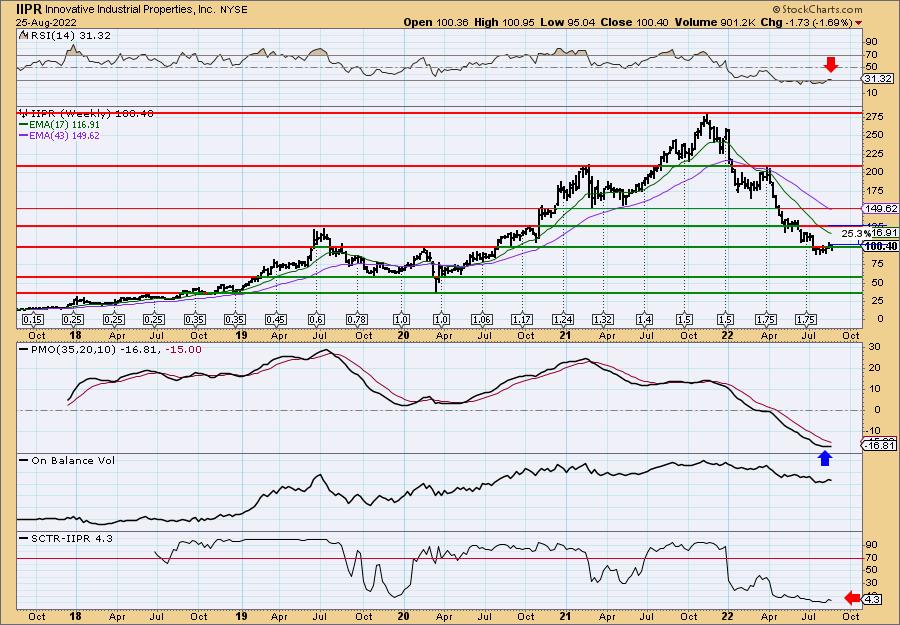
The weekly chart is beginning to turn around, but it is still early. The weekly RSI is negative, but oversold. The weekly PMO is decelerating in oversold territory. Not surprisingly the SCTR is only 4.3%. This is an early catch, but with that comes more risk. If it can continue to move higher, a trip to the 2019 high would mean an over 25% gain.
Mosaic Co. (MOS)
EARNINGS: 10/31/2022 (AMC)
The Mosaic Co. engages in the production and marketing of concentrated phosphate and potash crop nutrients. The company operates its businesses through its wholly and majority owned subsidiaries. It operates through the following segments: Phosphates, Potash, and Mosaic Fertilizantes. The Phosphates segment owns and operates mines and production facilities in North America which produces concentrated phosphate crop nutrients and phosphate-based animal feed ingredients, and concentrated crop nutrients. The Potash segment owns and operates potash mines and production facilities in North America which produce potash-based crop nutrients, animal feed ingredients, and industrial products. The Mosaic Fertilizantes segment produces and sells phosphate and potash-based crop nutrients, and animal feed ingredients, in Brazil. The company was founded on October 22, 2004, and is headquartered in Plymouth, MN.
Predefined Scans Triggered: Moved Above Upper Price Channel and P&F Double Top Breakout.
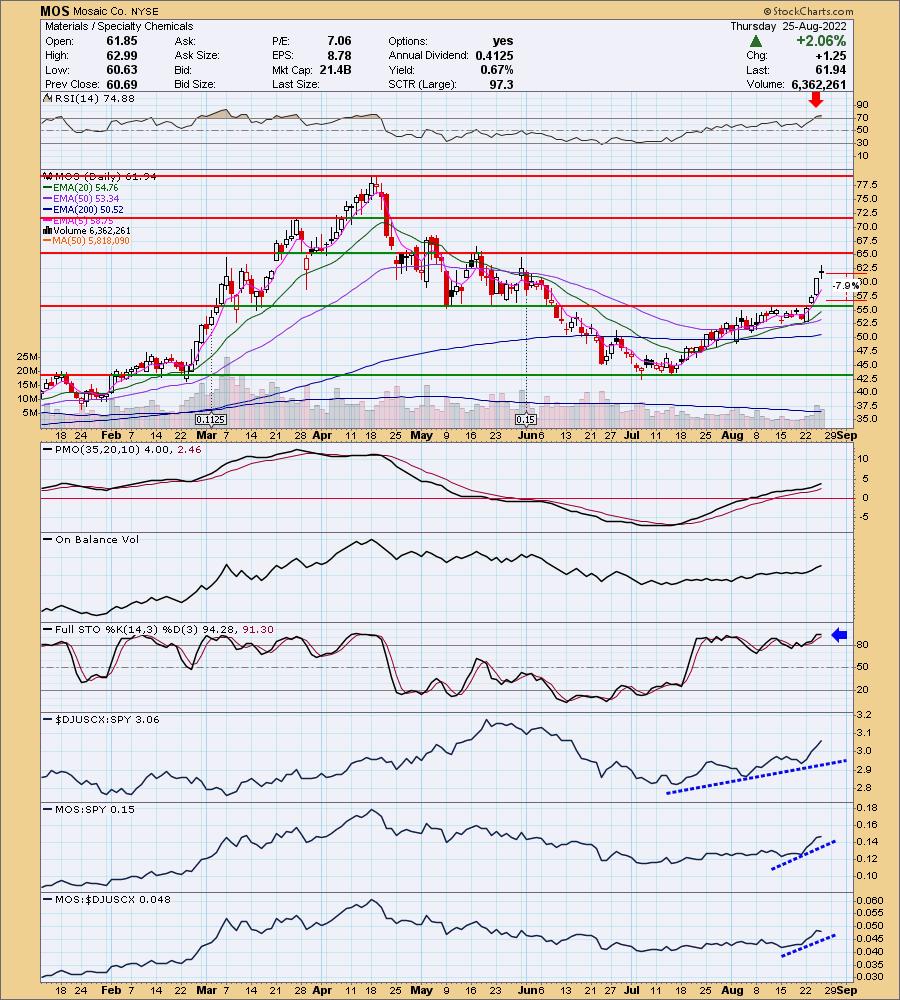
MOS is up +0.05% in after hours trading. I've covered it numerous times. Here is the link to the last time I did on August 12th 2021. The other links will be in that report. I believe that both positions are still open. This week MOS broke out above overhead resistance. It had been consolidating most of August. I honestly get frustrated when I see a chart like this; the PMO was so great on its timing of this rally. Well it has accelerated above the signal line and is far from being overbought. Volume is coming in. Stochastics have been mostly above 80 since mid-July. That's a lot of internal strength. The stop is set where I would expect the 20-day EMA to be in a few days. I would love to set it below support, but that would be an over 9% stop. Certainly if your risk appetite allows, you can expand it. Currently it is at 7.9% or around $57.95.
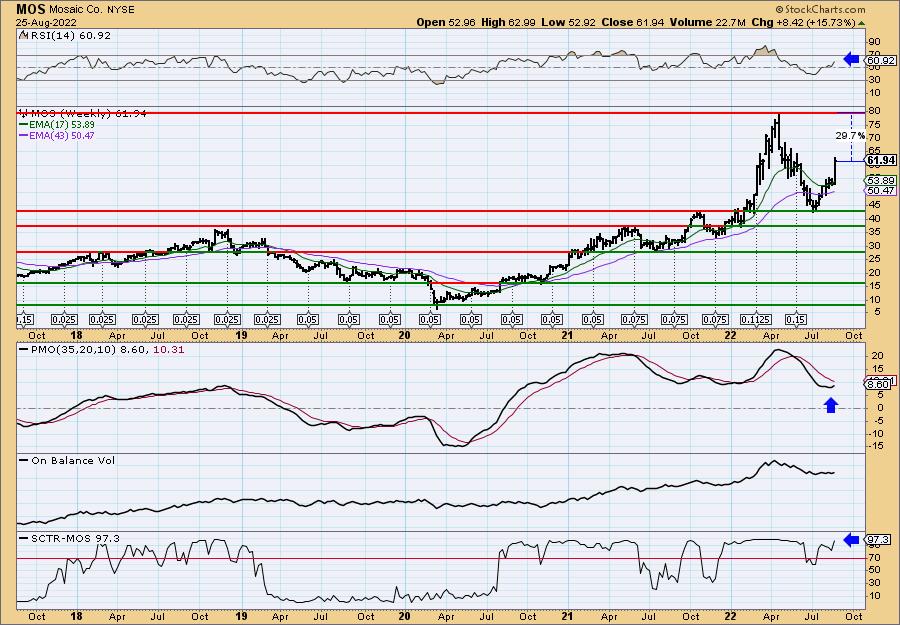
The weekly chart is looking very good. The weekly RSI is in positive territory and is not overbought. The weekly PMO has turned up and the SCTR is a very healthy 97.3%. The weekly OBV isn't great. It should be rising steeply with price and it isn't. That would be my problem here. Dividends look regular and are increasing.
Don't forget, on Thursdays I look at reader-requested symbols, click HERE to send me an email at erin@decisionpoint.com. I read every email I receive and try to answer them all!
Current Market Outlook:
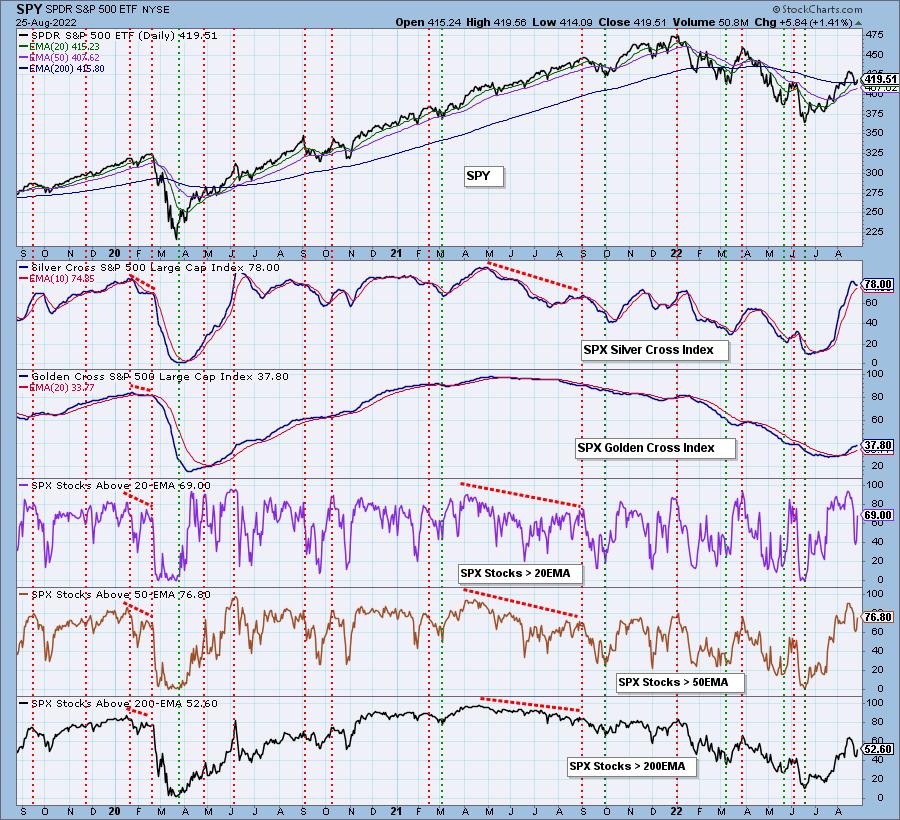
Market Environment: It is important to consider the odds for success by assessing the market tides. The following chart uses different methodologies for objectively showing the depth and trend of participation for intermediate- and long-term time frames.
- The Silver Cross Index (SCI) shows the percentage of SPX stocks on IT Trend Model BUY signals (20-EMA > 50-EMA)
- The Golden Cross Index (GCI) shows the percentage of SPX stocks on LT Trend Model BUY signals (50-EMA > 200-EMA)
Don't forget that as a "Diamonds" member, you have access to our GCI/SCI curated ChartList on DecisionPoint.com. You'll find it under "Members Only" links on the left side on the Blogs and Links Page.
Here is the current chart:
Full Disclosure: I am 45% exposed.
I'm required to disclose if I currently own a stock I mention and/or may buy/short it within the next 72 hours.
"Technical Analysis is a windsock, not a crystal ball." - Carl Swenlin
(c) Copyright 2022 DecisionPoint.com
Watch the latest episode of DecisionPoint with Carl & Erin Swenlin on Mondays 7:00p EST or on the DecisionPoint playlist on the StockCharts TV YouTube channel here!
NOTE: The stocks reported herein are from mechanical trading model scans that are based upon moving average relationships, momentum and volume. DecisionPoint analysis is then applied to get five selections from the scans. The selections given should prompt readers to do a chart review using their own analysis process. This letter is not a call for a specific action to buy, sell or short any of the stocks provided. There are NO sure things or guaranteed returns on the daily selection of "Diamonds in the Rough."
Regarding BUY/SELL Signals: The signal status reported herein is based upon mechanical trading model signals and crossovers. They define the implied bias of the price index/stock based upon moving average relationships and momentum, but they do not necessarily call for a specific action. They are information flags that should prompt chart review. Further, they do not call for continuous buying or selling during the life of the signal. For example, a BUY signal will probably (but not necessarily) return the best results if action is taken soon after the signal is generated. Additional opportunities for buying may be found as price zigzags higher, but the trader must look for optimum entry points. Conversely, exit points to preserve gains (or minimize losses) may be evident before the model mechanically closes the signal.
Helpful DecisionPoint Links:
DecisionPoint Shared ChartList and DecisionPoint Chart Gallery
Price Momentum Oscillator (PMO)
Swenlin Trading Oscillators (STO-B and STO-V)
For more links, go to DecisionPoint.com