
I'm writing today from the fabulous remote location of our local cardiac hospital. Mom is not having a good day so I decided it would be best and most comforting for her if I wrote "on the road". I'll be keeping it short.
On Monday morning someone asked whether it was time to dip back into Natural Gas (UNG). I'm not a fan of the Energy sector, but UNG always seems to have a mind of its own. The chart was looking favorable then, but it dropped yesterday. Today it rebounded nicely. I'm considering it for my portfolio.
Good Luck & Good Trading!
Erin
Today's "Diamonds in the Rough": CTS, KT and UNG.
Runners-Up: CANE and ACLS.

RECORDING LINK (7/8/2022):
Topic: DecisionPoint Diamond Mine (7/8/2022) LIVE Trading Room
Start Time: Jul 8, 2022 08:57 AM
Meeting Recording Link
Access Passcode: July#8th
REGISTRATION FOR Friday 7/15 Diamond Mine:
When: Jul 15, 2022 09:00 AM Pacific Time (US and Canada)
Topic: DecisionPoint Diamond Mine (7/15/2022) LIVE Trading Room
Register in advance for this webinar HERE
Save the registration confirmation email with login instructions in case Zoom doesn't notify you in time.

StockChartsTV is now producing the recording for the free DP Trading Room! It airs at 3p ET, much sooner than I was able to get out the recording links. Carl has joined so you can "ask the master" all those questions you've always wanted his opinion on! If you haven't registered to attend live at Noon ET, you can do so HERE.
Welcome to DecisionPoint Daily Diamonds, wherein I highlight ten "Diamonds in the Rough" per week. These are selected from the results of my DecisionPoint Scans, which search for stocks that could benefit from the trend and condition of the market. Remember, these are not recommendations to buy or sell, but are the most interesting of the stocks that surfaced in my scans. My objective is to save you the work of the initial, tedious culling process, but you need to apply your own analysis to see if these stocks pique your interest as well. There are no guaranteed winners here!
"Predefined Scans Triggered" are taken from StockCharts.com using the "Symbol Summary" option instead of a "SharpChart" on the workbench.
CTS Corp. (CTS)
EARNINGS: 7/26/2022 (BMO)
CTS Corp. engages in the design and manufacture of sensors, connectivity components, and actuators. Its products include controls, pedals, piezo sensing products, sensors, switches, transducers, electromagnetic and radio frequency interference filters, capacitors, frequency control, resistors, piezo microactuators, and rotary microactuators. The company was founded by A. J. Briggs, George A. Briggs, and S. A. Buffington in 1896 and is headquartered in Lisle, IL.
Predefined Scans Triggered: Elder Bar Turned Green.
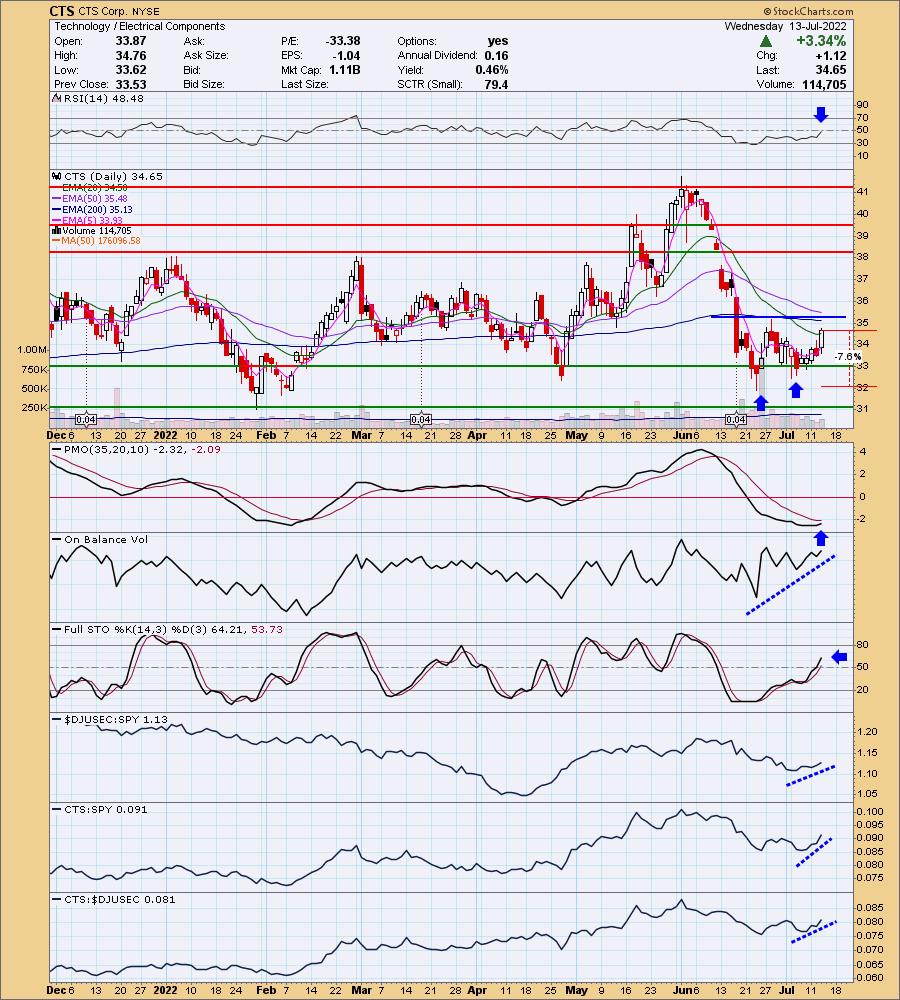
CTS is unchanged in after hours trading. It had a great day so we could see it decline tomorrow. A bullish double-bottom has formed, but will not be confirmed until a break above the blue confirmation line. Today's move above the 20-day EMA suggests it will. The RSI is almost into positive territory. The PMO is making the turn toward a crossover BUY signal. The OBV is rising sharply which is a good sign. Stochastics are positive and rising. Relative strength is picking up for the group and CTS. The stop is set below the June low, but you could tighten that up.
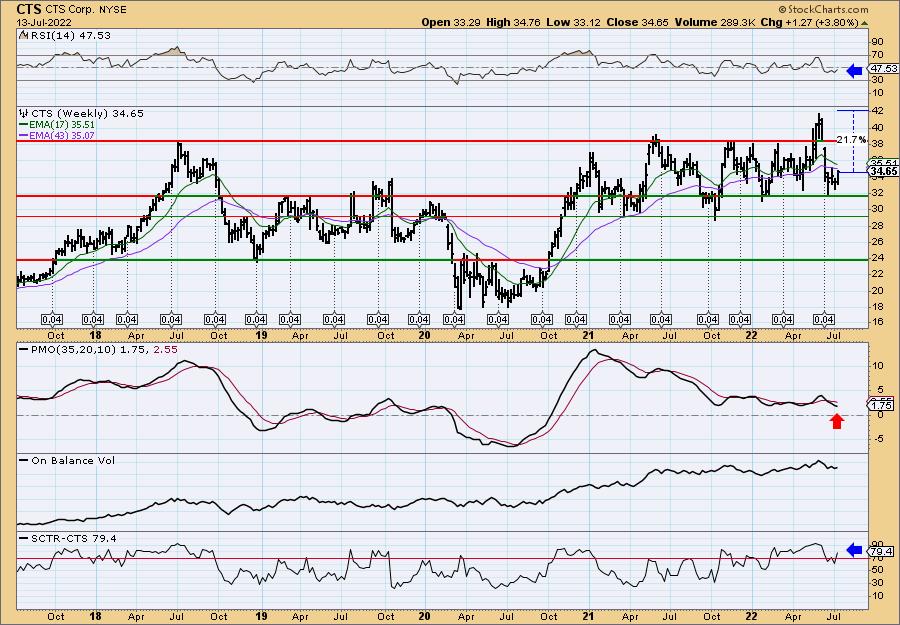
It's been traveling in a trading range and price just bounced off the bottom of it at $32. The weekly RSI is negative, but rising. The PMO doesn't look healthy, but it was a dastardly decline last quarter that requires plenty of positive momentum to overcome. The OBV is steadily rising and the SCTR is in the "hot zone" above 70.
KT Corp. (KT)
EARNINGS: 8/9/2022
KT Corp. engages in the provision of integrated telecommunication services. The company operates through the Customer and Marketing businesses. Its services include wire and wireless phones, internet, and other communication. The company was founded on December 20, 1981 and is headquartered in Seongnam-si, South Korea.
Predefined Scans Triggered: New CCI Buy Signals.
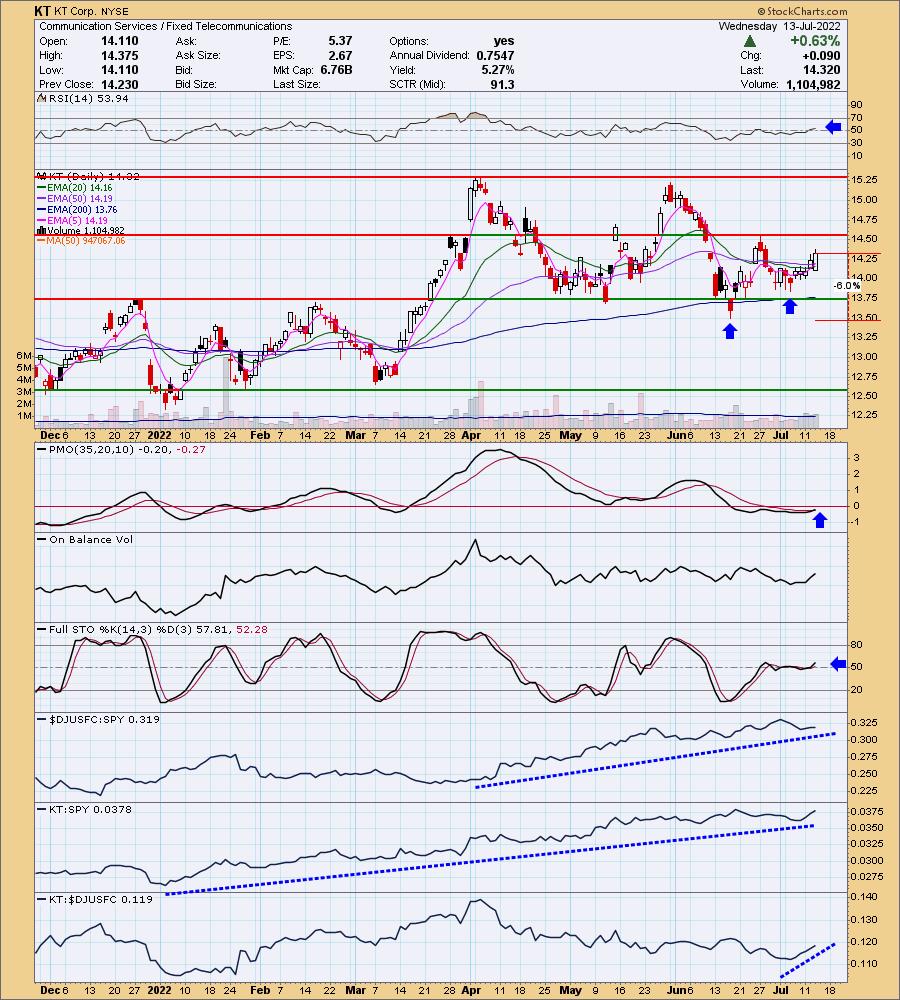
KT is currently up +1.89% in after hours trading which is a good sign. There is a double-bottom forming. It will be confirmed with a breakout above $14.50. The RSI is positive and rising. The PMO generated a crossover BUY signal today. Stochastics had flattened but are now rising in positive territory. Relative strength has been good for the group and now KT is beginning to outperform the group. The stop can be set tightly just below $13.50.
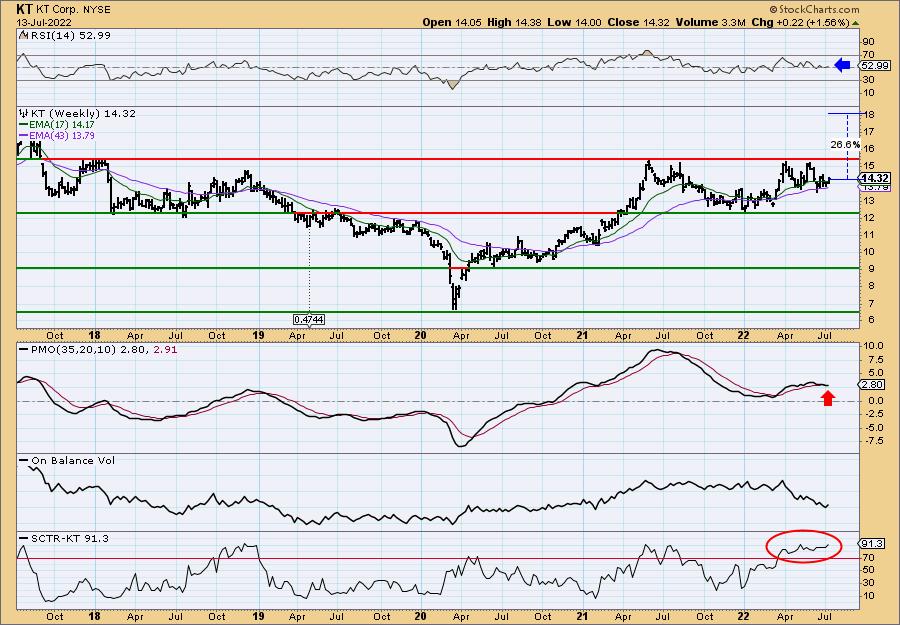
The weekly chart isn't great and to be honest very strong multi-year resistance is arrive at $15.50. However in 2017 it did top at $18 so if we're being optimistic, we could see it pop. Just be prepared for a possible pullback when $15.50 is hit. The weekly RSI is positive, but flat. The weekly PMO is setting up a SELL signal for Friday. The OBV doesn't look good. However, this stock still has a decent SCTR in the 90's.
United States Natural Gas Fund (UNG)
EARNINGS: N/A
UNG holds near-month futures contracts in natural gas, as well as swap contracts.
Predefined Scans Triggered: Elder Bar Turned Green and P&F Double Top Breakout.
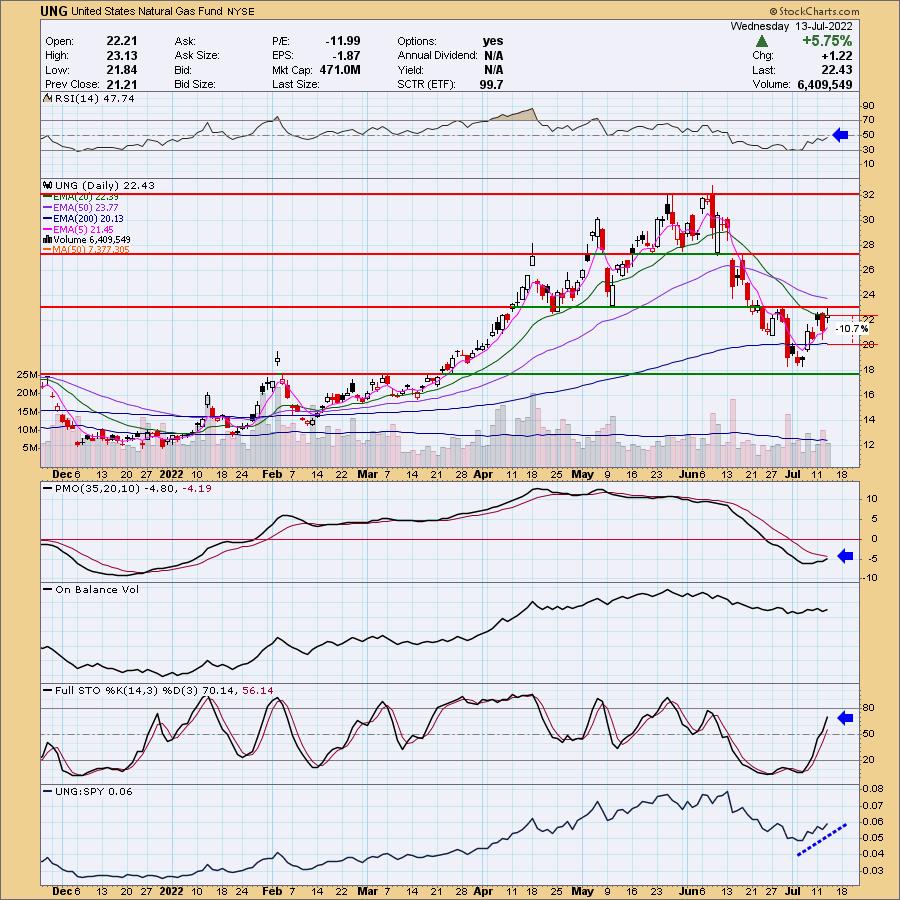
UNG is up +0.31% in after hours trading. I've covered UNG numerous times so here is the link to the September 28th 2021 Diamonds Report. It contains the history of coverage. It hasn't actually broken above short-term price resistance, but it did close above the 20-day EMA for the first time in awhile. The RSI is negative but rising. The PMO is nearing a crossover BUY signal. Stochastics look good and relative strength is improving. A breakout here would suggest a big move upward coming. The stop is deep. UNG has been very volatile, so be prepared.
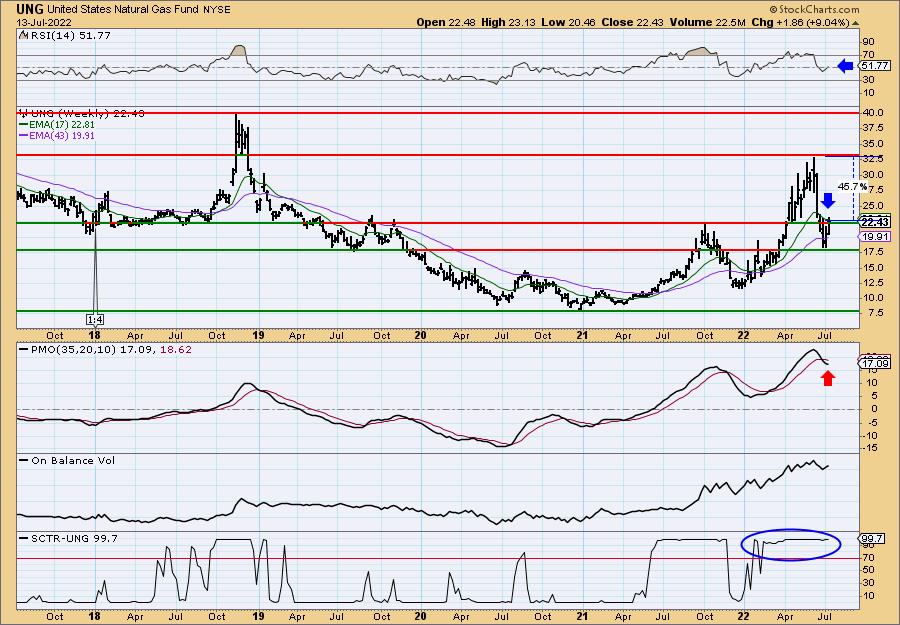
Breaking through resistance here would be excellent. It is attempting to right now. I don't like the PMO SELL signal in overbought territory, but like the symbol above, it has to overcome the deep decline's negative momentum. The SCTR is strong.
Don't forget, on Thursdays I look at reader-requested symbols, click HERE to send me an email. I read every email I receive and try to answer them all!
Current Market Outlook:
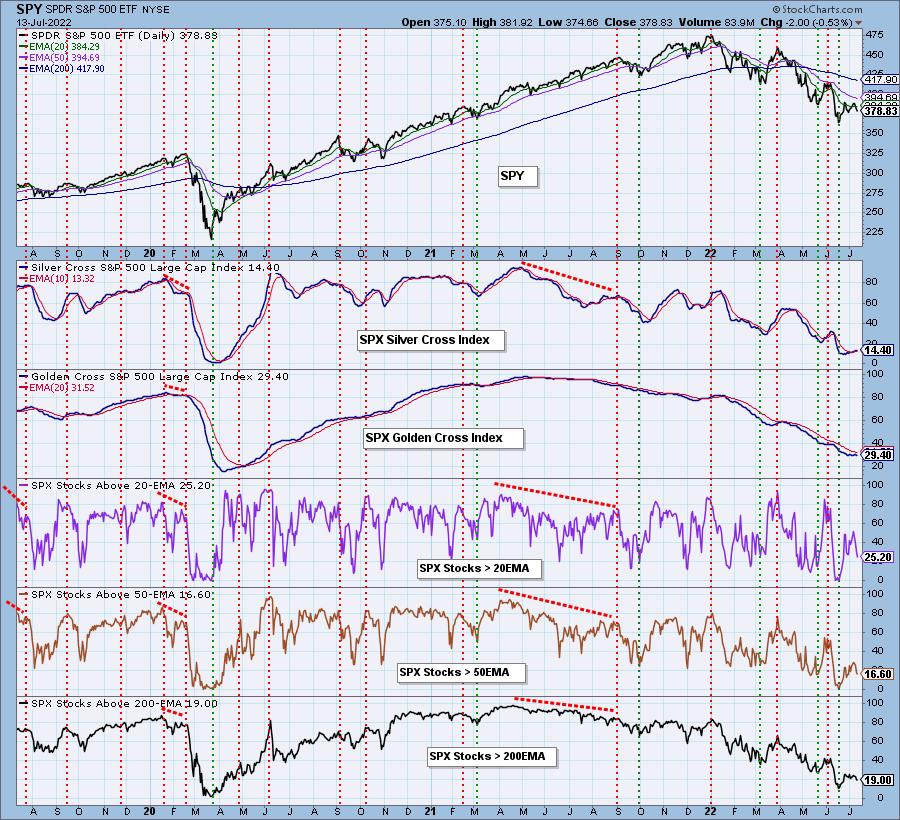
Market Environment: It is important to consider the odds for success by assessing the market tides. The following chart uses different methodologies for objectively showing the depth and trend of participation for intermediate- and long-term time frames.
- The Silver Cross Index (SCI) shows the percentage of SPX stocks on IT Trend Model BUY signals (20-EMA > 50-EMA)
- The Golden Cross Index (GCI) shows the percentage of SPX stocks on LT Trend Model BUY signals (50-EMA > 200-EMA)
Don't forget that as a "Diamonds" member, you have access to our GCI/SCI curated ChartList on DecisionPoint.com. You'll find it under "Members Only" links on the left side on the Blogs and Links Page.
Here is the current chart:
Full Disclosure: I'm 45% exposed.
I'm required to disclose if I currently own a stock I mention and/or may buy/short it within the next 72 hours.
"Technical Analysis is a windsock, not a crystal ball." - Carl Swenlin
(c) Copyright 2022 DecisionPoint.com
Watch the latest episode of DecisionPoint with Carl & Erin Swenlin on Mondays 7:00p EST or on the DecisionPoint playlist on the StockCharts TV YouTube channel here!
NOTE: The stocks reported herein are from mechanical trading model scans that are based upon moving average relationships, momentum and volume. DecisionPoint analysis is then applied to get five selections from the scans. The selections given should prompt readers to do a chart review using their own analysis process. This letter is not a call for a specific action to buy, sell or short any of the stocks provided. There are NO sure things or guaranteed returns on the daily selection of "Diamonds in the Rough."
Helpful DecisionPoint Links:
DecisionPoint Shared ChartList and DecisionPoint Chart Gallery
Price Momentum Oscillator (PMO)
Swenlin Trading Oscillators (STO-B and STO-V)
For more links, go to DecisionPoint.com