
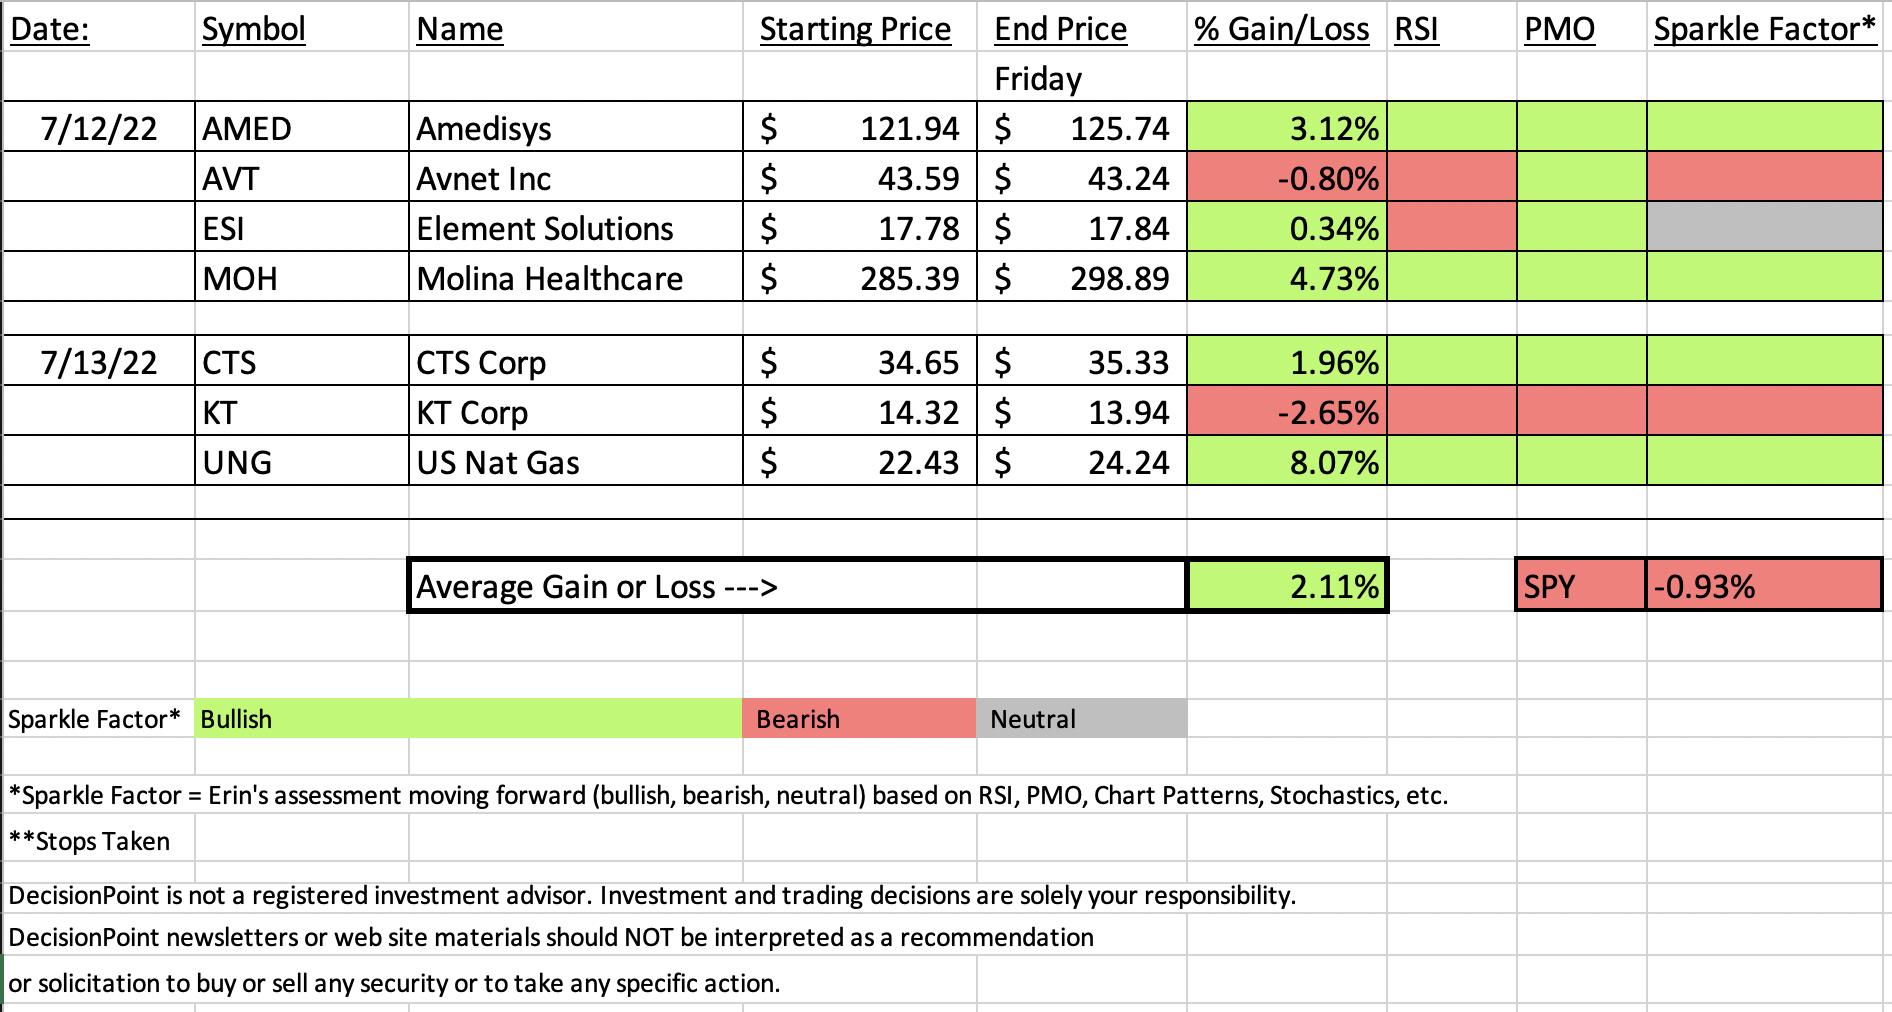
It may not have been excellent week for my mom, but "Diamonds in the Rough" did very well. The average on our seven picks this week was +2.11% while the SPY finished in the red at -0.91%. Again I do remind everyone that "Diamonds in the Rough" don't get a full week to mature as the SPY does. That can work to our advantage, but it can also be a disadvantage depending on the week.
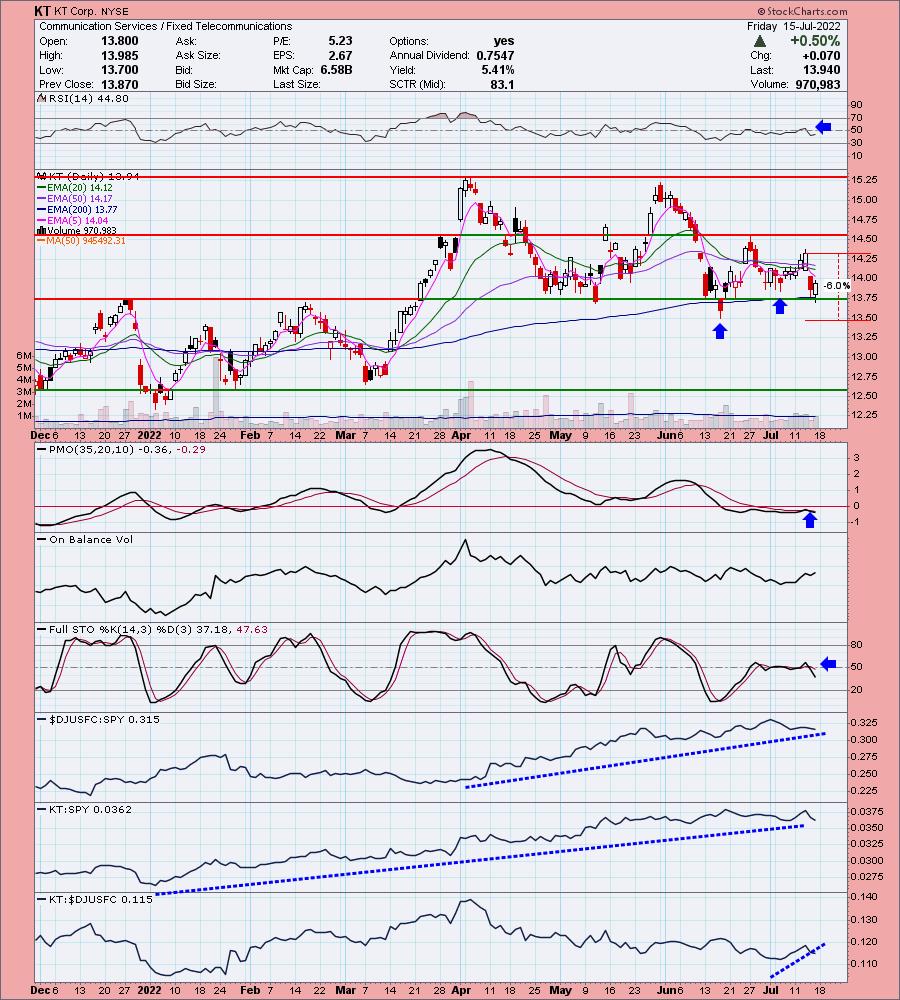
Our "Darling" this week is Natural Gas (UNG) which was up over 8% since it was picked on Wednesday. The "Dud" is KT Corp (KT) which was -2.65% since Wednesday.
When I do the Sparkle Factor, I basically look at the chart and determine whether I would want to buy it right now. Indicators may still look okay, but price action and changes in Stochastics may not and that is when I give you either a "neutral" (gray) or "bearish" (red). If it's neutral, you need to make your own decision as to whether it suits your analysis).
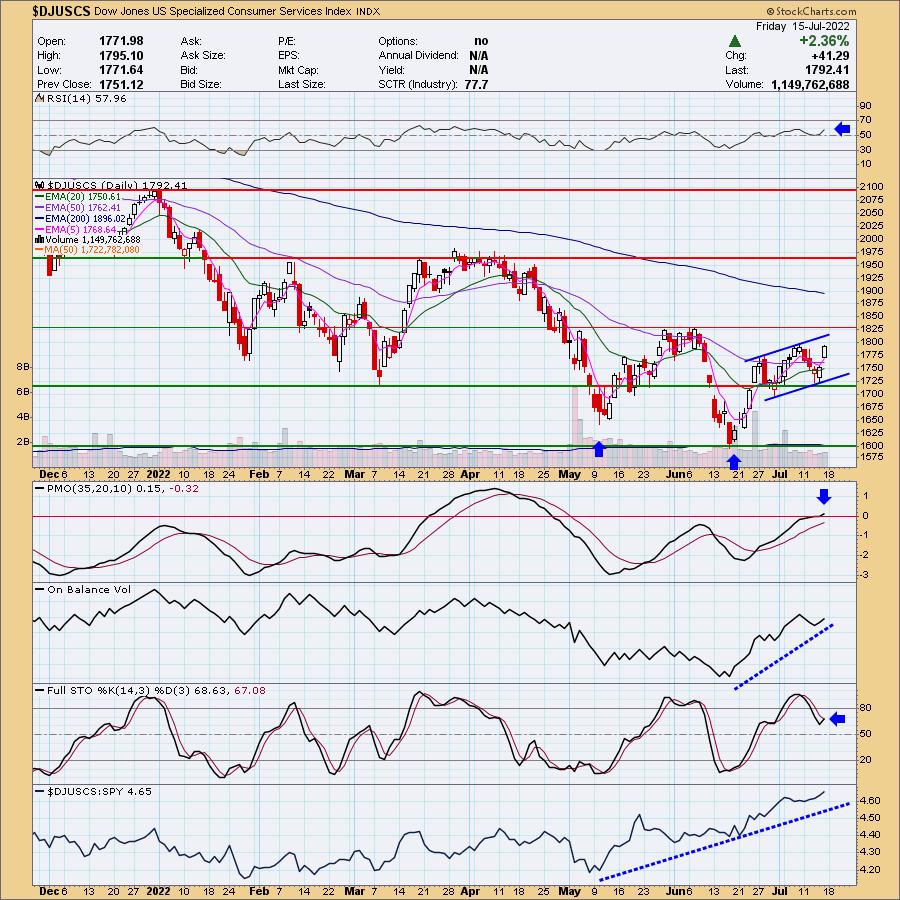
In this morning's Diamond Mine Trading Room I liked XLY for "Sector to Watch". After getting participation data for the day, I still believe XLY is the most bullish. As far as "Industry Group to Watch", I also haven't changed my mind. Specialized Consumer Services is outperforming in a big way and today's rally suggests more upside ahead.
The recording link for today's Diamond Mine is below as well as the registration for next Friday's Diamond Mine.
Good Luck & Good Trading,
Erin

RECORDING LINK (7/15/2022):
Topic: DecisionPoint Diamond Mine (7/15/2022) LIVE Trading Room
Start Time: Jul 15, 2022 09:00 AM
Meeting Recording Link
Access Passcode: July%15th
REGISTRATION FOR Friday 7/22 Diamond Mine:
When: Jul 22, 2022 09:00 AM Pacific Time (US and Canada)
Topic: DecisionPoint Diamond Mine (7/22/2022) LIVE Trading Room
Register in advance for this webinar HERE
Save the registration confirmation email with login instructions in case Zoom doesn't notify you in time.

A few items about the spreadsheet: I've put on the spreadsheet whether the RSI is positive (green) or negative (red). The PMO column tells you if it is rising (green) or falling (red). Finally I've added my own "Sparkle Factor" that gives you my assessment going forward, bullish (green), bearish (red) or neutral (gray). The Sparkle Factor is basically my thoughts on whether I expect it to rise or fall. A neutral means it could really go either way so it could be added to a watch list. If you're in a stock I consider "neutral" going forward, the ball is in your court.
Darling:
United States Natural Gas Fund (UNG)
EARNINGS: N/A
UNG holds near-month futures contracts in natural gas, as well as swap contracts.
Predefined Scans Triggered: Elder Bar Turned Green and P&F Double Top Breakout.
Below are the commentary and chart from Wednesday 7/13:
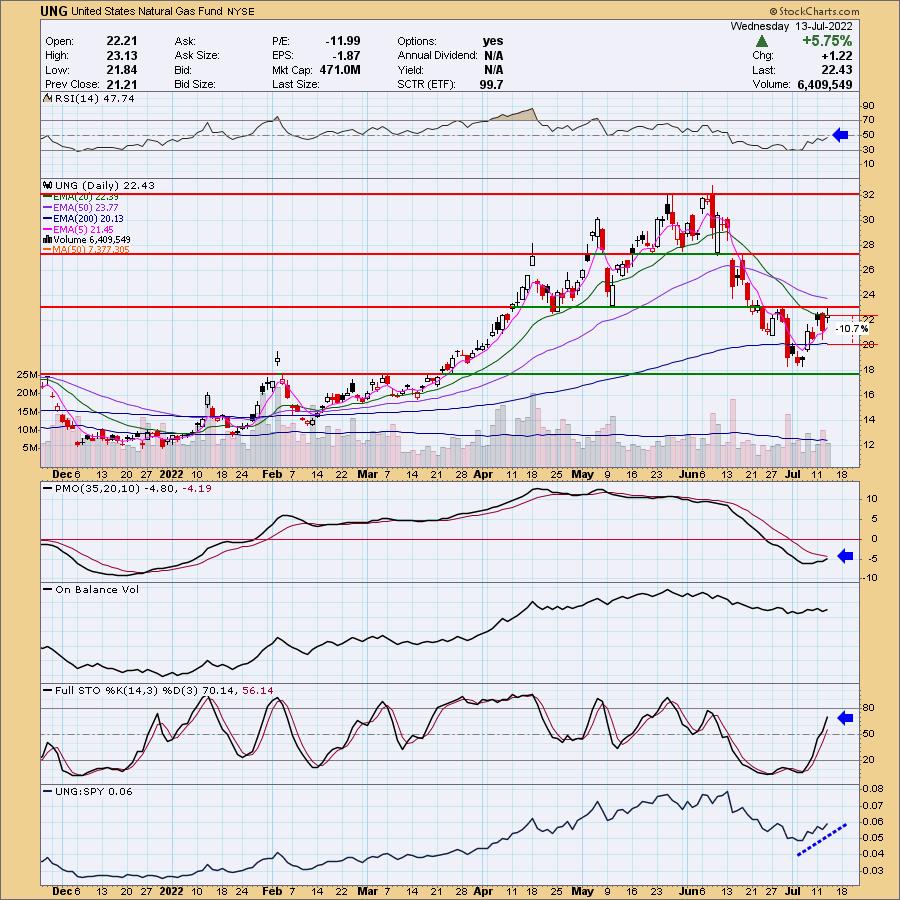
"UNG is up +0.31% in after hours trading. I've covered UNG numerous times so here is the link to the September 28th 2021 Diamonds Report. It contains the history of coverage. It hasn't actually broken above short-term price resistance, but it did close above the 20-day EMA for the first time in awhile. The RSI is negative but rising. The PMO is nearing a crossover BUY signal. Stochastics look good and relative strength is improving. A breakout here would suggest a big move upward coming. The stop is deep. UNG has been very volatile, so be prepared."
Here is today's chart:
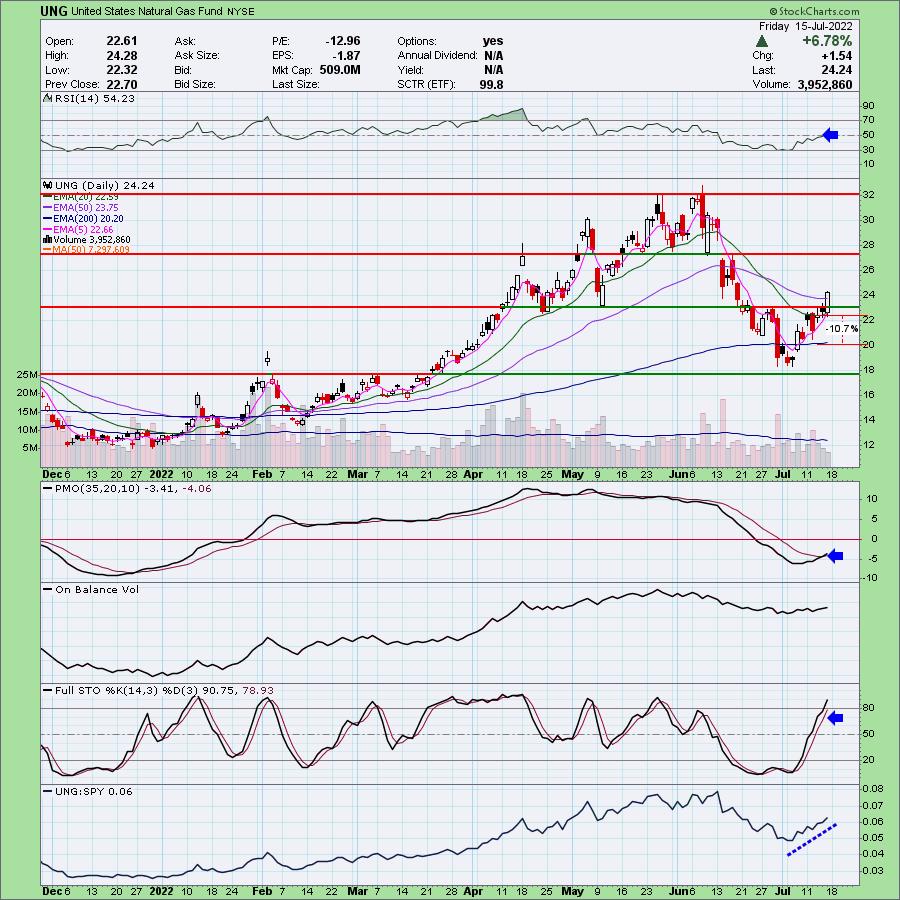
This chart is very strong. The RSI is getting more positive. Price has broken above key resistance and the 50-day EMA. I warned that UNG can be volatile. That volatility can be your friend or enemy. Right now it is definitely our friend given the over 7% gain today. The PMO has generated a crossover BUY signal. Stochastics are rising vertically and relative strength is excellent. If I had one complaint, it would be the diminishing volume. Still the volume is healthy enough given OBV is rising.
Don't forget, on Thursdays I look at reader-requested symbols, so shoot me an email at erin@decisionpoint.com. I read every email I receive and try to answer them all!
Dud:
KT Corp. (KT)
EARNINGS: 8/9/2022
KT Corp. engages in the provision of integrated telecommunication services. The company operates through the Customer and Marketing businesses. Its services include wire and wireless phones, internet, and other communication. The company was founded on December 20, 1981 and is headquartered in Seongnam-si, South Korea.
Predefined Scans Triggered: New CCI Buy Signals.
Below are the commentary and chart from Wednesday 7/13:
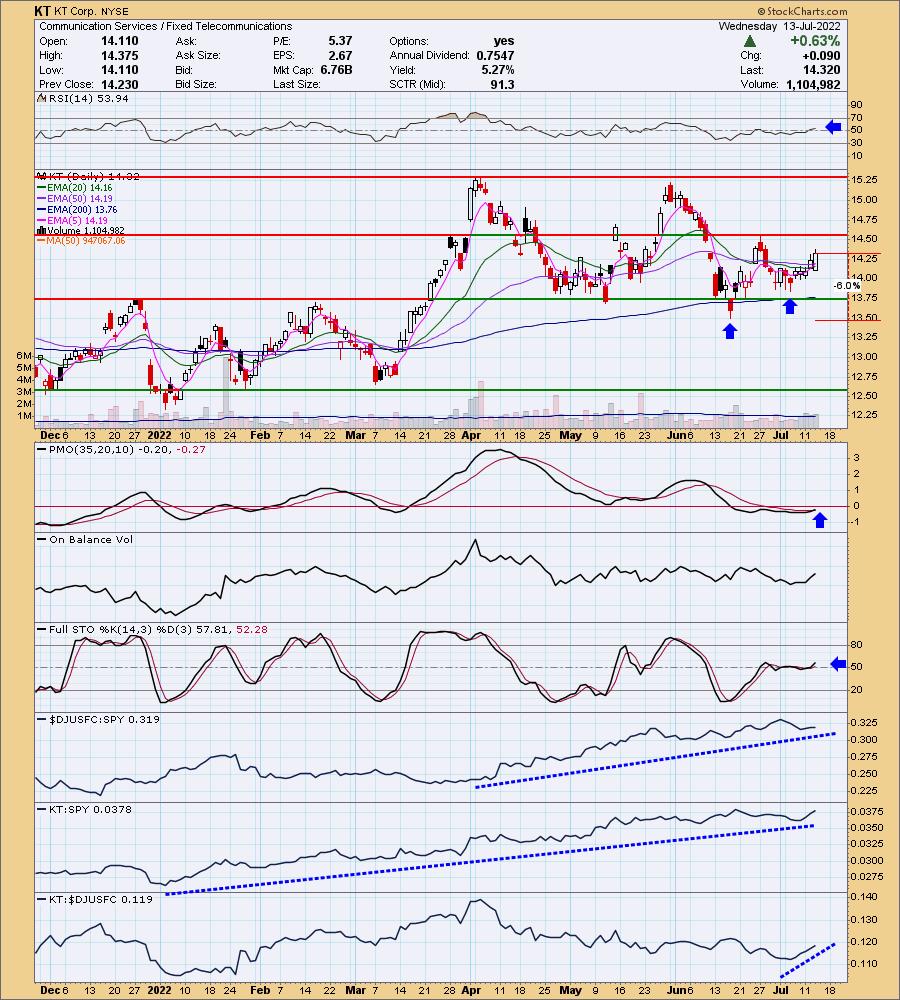
"KT is currently up +1.89% in after hours trading which is a good sign. There is a double-bottom forming. It will be confirmed with a breakout above $14.50. The RSI is positive and rising. The PMO generated a crossover BUY signal today. Stochastics had flattened but are now rising in positive territory. Relative strength has been good for the group and now KT is beginning to outperform the group. The stop can be set tightly just below $13.50."
Here is today's chart:
I don't like this chart anymore. We had a bullish double-bottom, and now it looks like a double-top. Support held, but indicators are moving south. If I owned it, I would likely hold it to see if support holds. The current stop level is good.
THIS WEEK's Sector Performance:

DecisionPoint Sector Scoreboard (Mechanical Trend Model Signals):

Click Here to view Carl's annotated Sector ChartList!
RRG® Daily Chart ($ONE Benchmark):
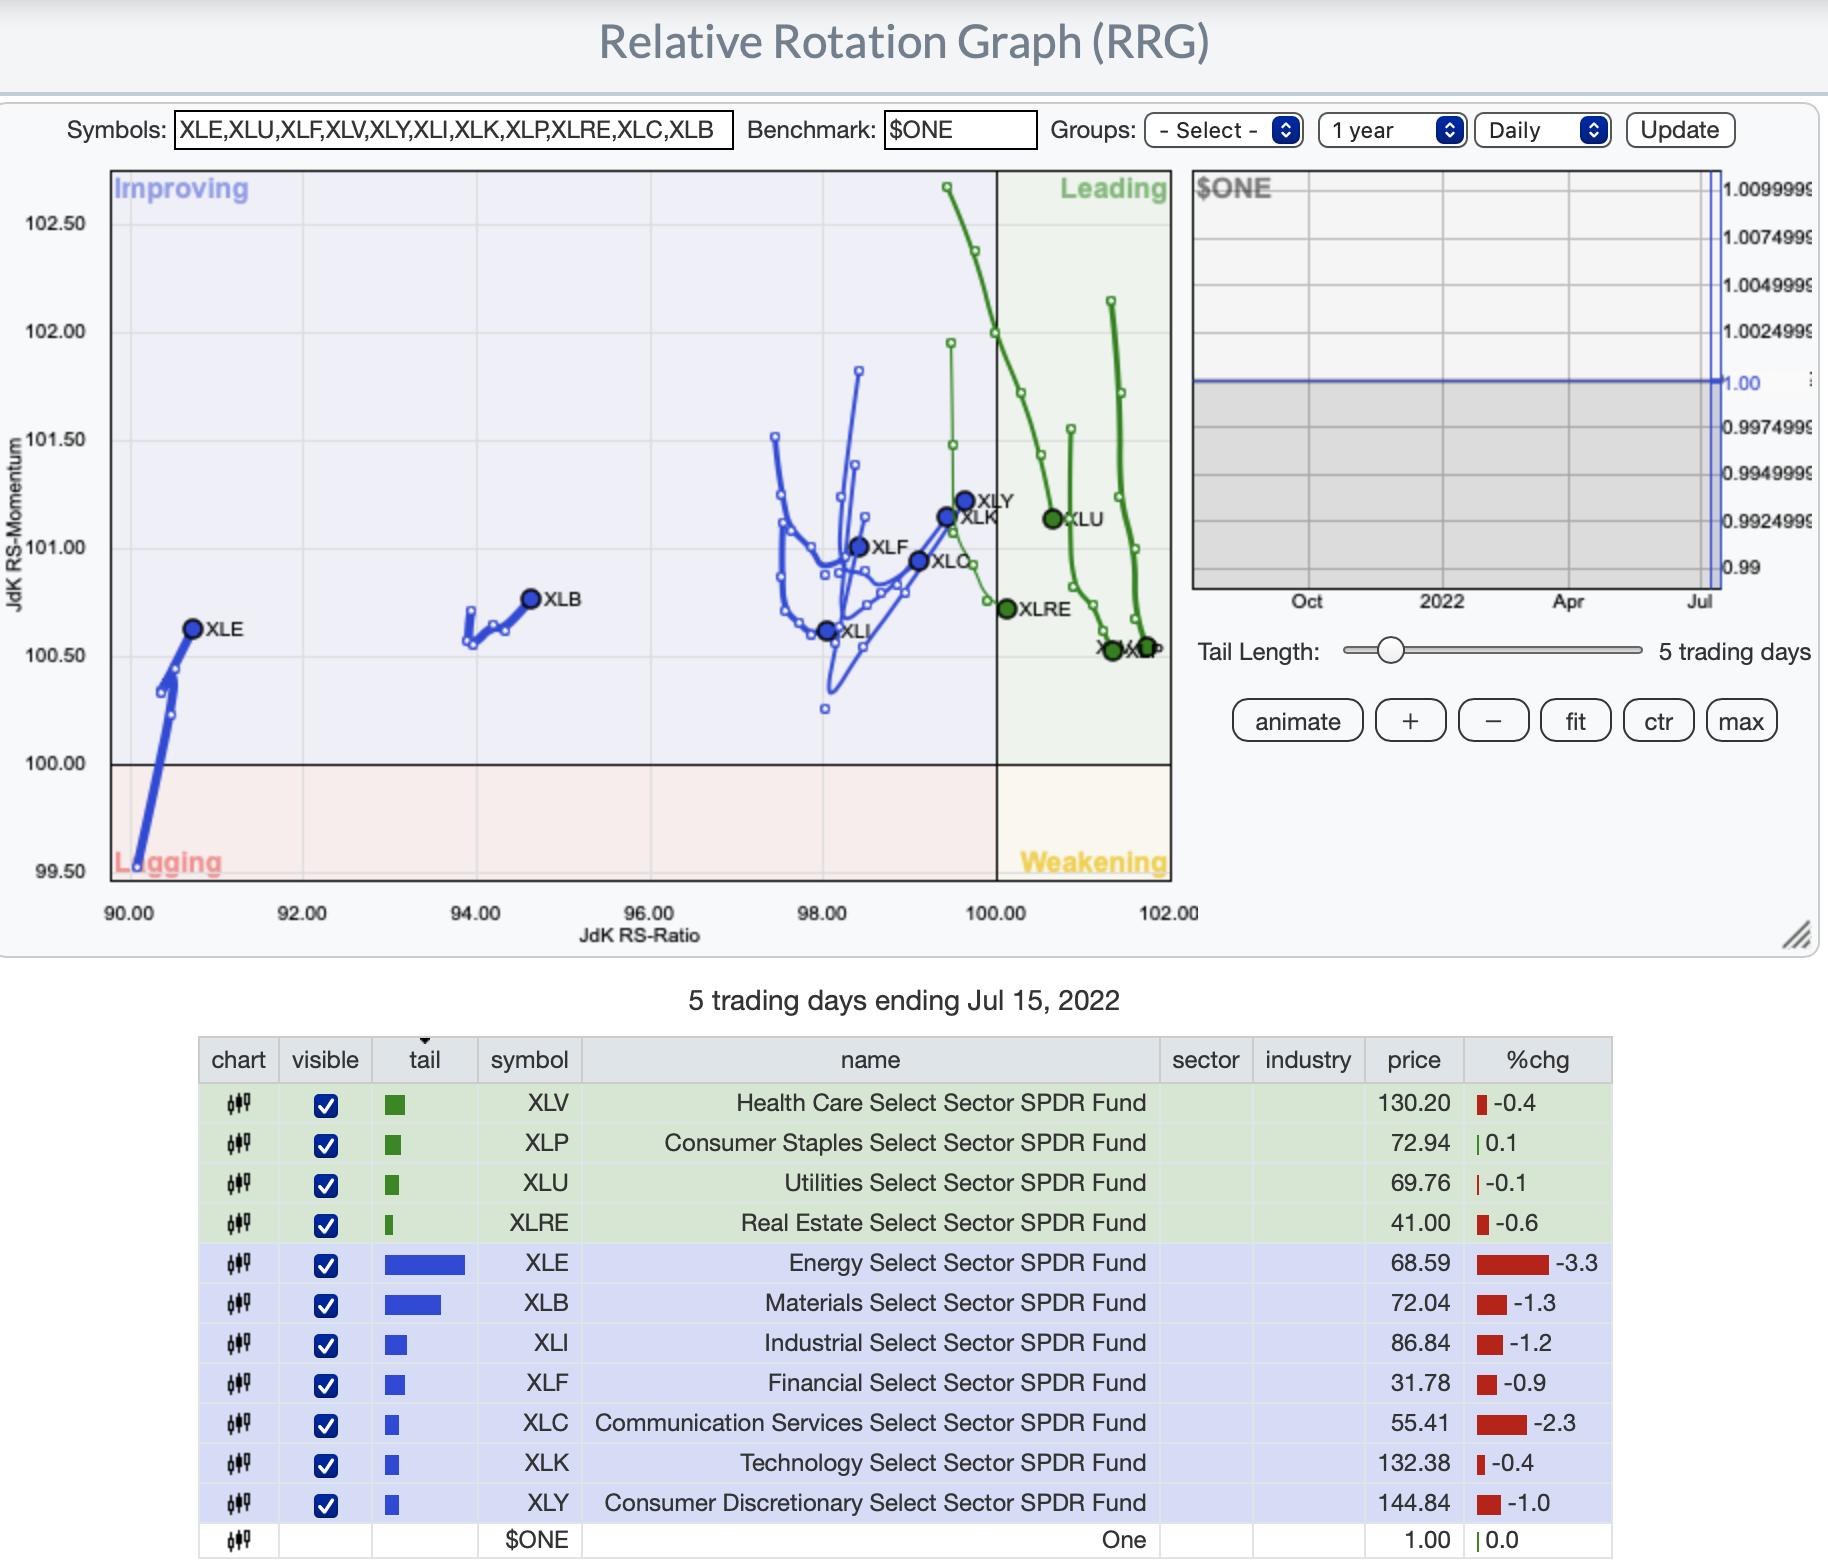
This RRG tells a story. While the defensive sectors are the Leading quadrant they are all moving southward toward the Weakening quadrant. On the other hand, all other sectors have bullish northeast headings, including aggressive sectors like XLK, XLY and XLC. XLE has reversed out of its bearish southwest direction and now has a bullish heading.
RRG® Weekly Chart ($ONE Benchmark):
The weekly RRG is also improving with the exception that all sectors are in Weakening or Lagging quadrants. There are now a handful of sectors with bullish northeast headings: aggressive sectors, XLC, XLK and XLY; as well as XLV. XLE and XLB are still in the dog house with their bearish southwest heading.
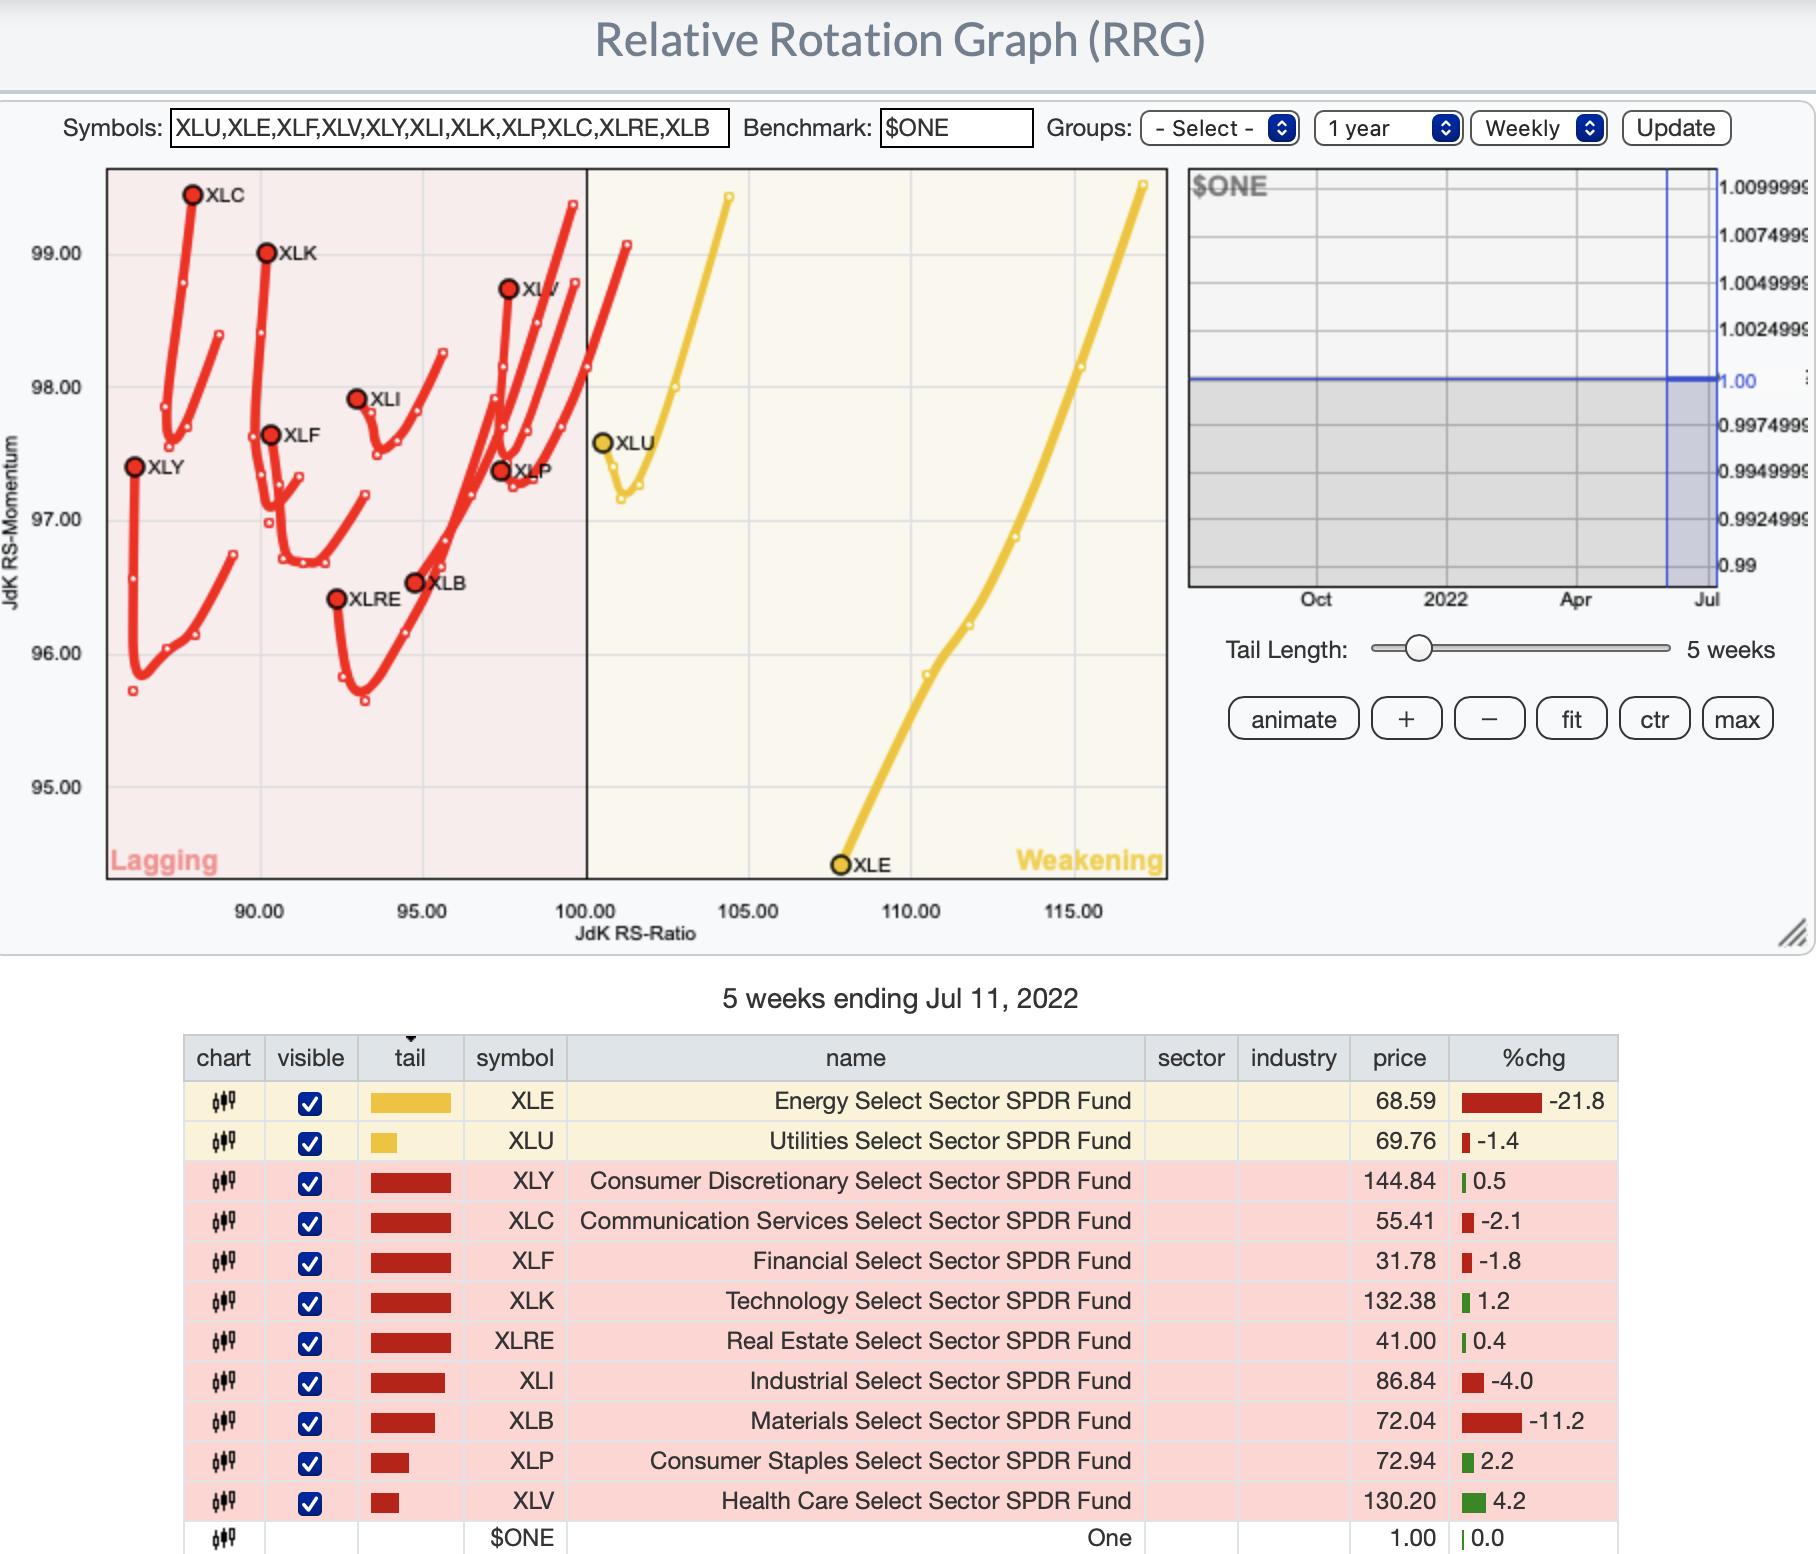
RRG® charts show you the relative strength and momentum for a group of stocks. Stocks with strong relative strength and momentum appear in the green Leading quadrant. As relative momentum fades, they typically move into the yellow Weakening quadrant. If relative strength then fades, they move into the red Lagging quadrant. Finally, when momentum starts to pick up again, they shift into the blue Improving quadrant.
CLICK HERE for an animated version of the RRG charts.
Sector to Watch: Consumer Discretionary (XLY)
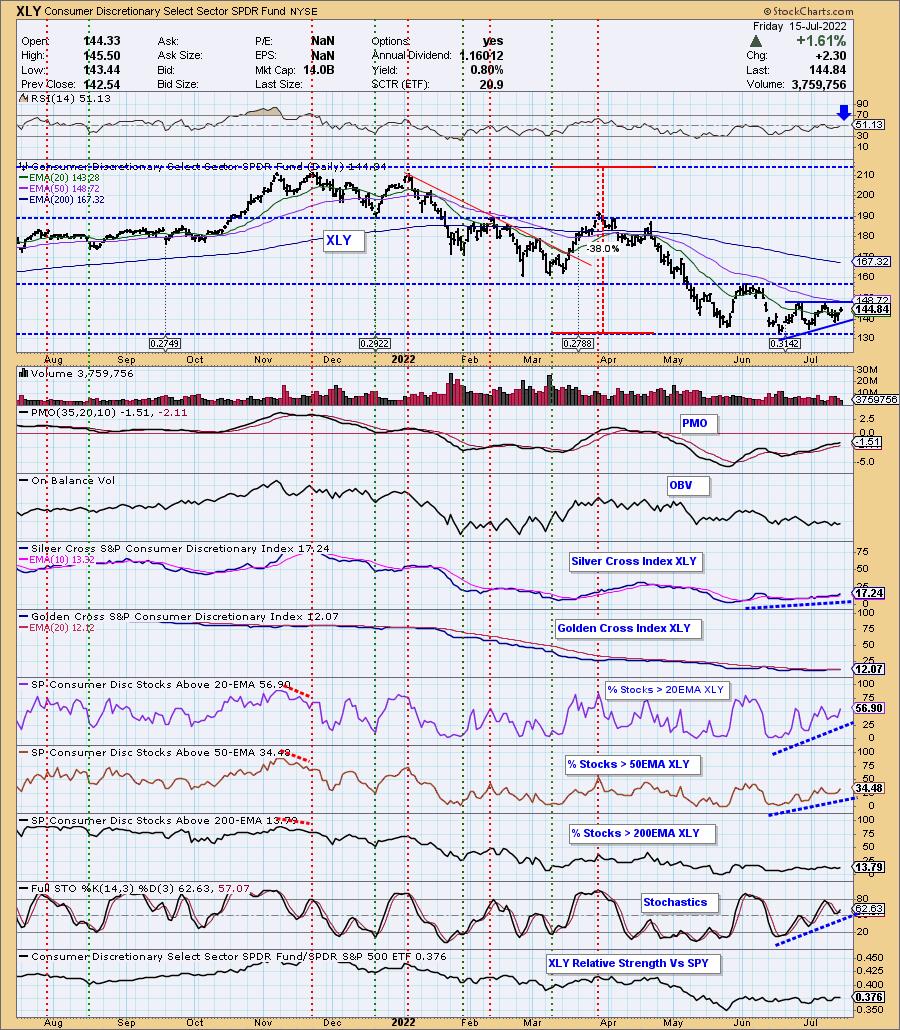
I decided to go with XLY, but XLC and XLK were close seconds. My reasoning for this one over those was that we have better participation of stocks above their 50-day EMAs and the SCI reading was higher than the others and rising steadily. We have a bullish ascending triangle that implies a breakout above the confirmation line and 50-day EMA.
Industry Group to Watch: Specialized Consumer Services ($DJUSCS)
There were some interesting groups out there within XLY, but this chart floated to top. The RSI is positive, rising and not overbought. The PMO just accelerated above the zero line. Stochastics have tipped up. Not only is there an intermediate-term bullish double-bottom, price is traveling in a rising trend channel.
Go to our Sector ChartList on DecisionPoint.com to get an in-depth view of all the sectors.
Have a great weekend! Good Luck & Good Trading!
- Erin
erin@decisionpoint.com
Full Disclosure: I'm 45% exposed.
Watch the latest episode of DecisionPoint with Carl & Erin Swenlin on Mondays 7:00p EST or on the DecisionPoint playlist on the StockCharts TV YouTube channel here!
Technical Analysis is a windsock, not a crystal ball. --Carl Swenlin
NOTE: The stocks reported herein are from mechanical trading model scans that are based upon moving average relationships, momentum and volume. DecisionPoint analysis is then applied to get five selections from the scans. The selections given should prompt readers to do a chart review using their own analysis process. This letter is not a call for a specific action to buy, sell or short any of the stocks provided. There are NO sure things or guaranteed returns on the daily selection of "diamonds in the rough."
Helpful DecisionPoint Links:
DecisionPoint Shared ChartList and DecisionPoint Chart Gallery
Price Momentum Oscillator (PMO)
Swenlin Trading Oscillators (STO-B and STO-V)
(c) Copyright 2022 DecisionPoint.com