
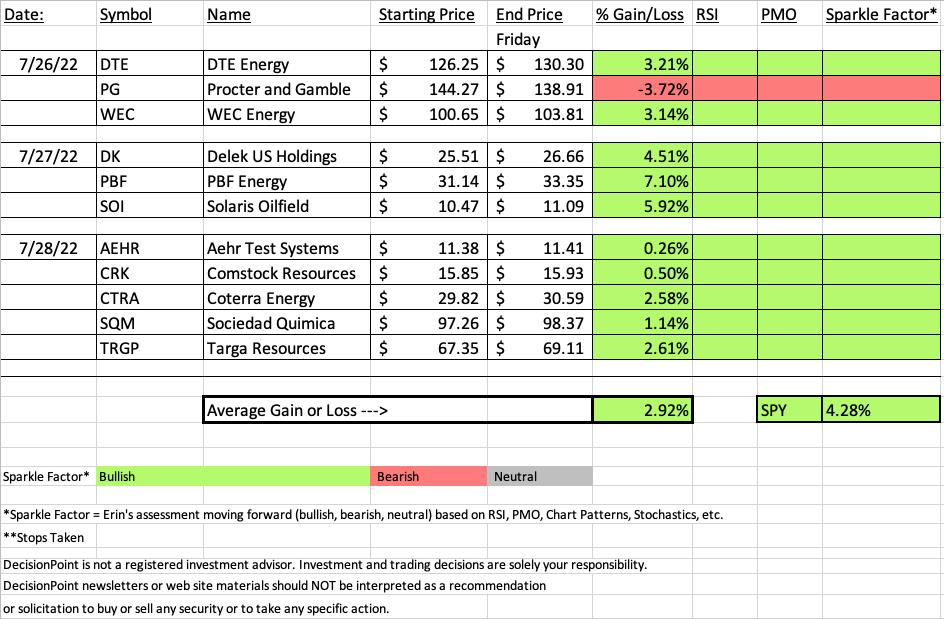
The spreadsheet this week is almost all green with the exception of the Consumer Staples stock we picked on Tuesday. We'll talk about that "Dog" further down, but I'm certain it was earnings that took it down. It was doing just fine until earnings were announced today. It fell heavily.
The "Darling" this week was PBF Energy (PBF) which finished up +7.10%. For once I actually managed to purchase the "Darling" for the week.
I didn't present any Renewable Energy stocks this week, but it is an area to keep in mind for next week. It isn't the official "Industry Group to Watch", but it is definitely worth watching.
The "Sector to Watch" this week was almost impossible to pick as so many of the sectors show breakouts and rally continuations. Two week's ago the sector to watch was Consumer Discretionary (XLY) and ultimately that is the sector I picked. I didn't want to be a "Johnny One Note" on Energy so I opted not to go with it. I think you all know it is one of the primary sectors to watch without me presenting it. Utilities (XLU) and Real Estate (XLRE) both looked fantastic. Technology (XLK), Industrials (XLI) and Financials (XLF) also show strong participation. So why XLY? Mainly because two of the industry groups within are showing incredible strength, Automobiles and Restaurants & Bars. I ultimately picked Autos and I would say to look at TSLA, F and GM as possible candidates next week.
As I mentioned in the Diamond Mine this morning, sector rotation has a way of changing on Mondays versus the prior week so nothing is a sure thing. Given so many strong sectors, it could swing strongly toward any one of those.
The recording link for today's Diamond Mine is below as well as the registration for next Friday's Diamond Mine.
Good Luck & Good Trading,
Erin

RECORDING LINK (7/29/2022):
Topic: DecisionPoint Diamond Mine (7/29/2022) LIVE Trading Room
Start Time: Jul 29, 2022 08:59 AM
Meeting Recording Link
Access Passcode: July#29th
REGISTRATION FOR Friday 8/5 Diamond Mine:
When: Aug 5, 2022 09:00 AM Pacific Time (US and Canada)
Topic: DecisionPoint Diamond Mine (8/5/2022) LIVE Trading Room
Register in advance for this webinar HERE
Save the registration confirmation email with login instructions in case Zoom doesn't notify you in time.

A few items about the spreadsheet: I've put on the spreadsheet whether the RSI is positive (green) or negative (red). The PMO column tells you if it is rising (green) or falling (red). Finally I've added my own "Sparkle Factor" that gives you my assessment going forward, bullish (green), bearish (red) or neutral (gray). The Sparkle Factor is basically my thoughts on whether I expect it to rise or fall. A neutral means it could really go either way so it could be added to a watch list. If you're in a stock I consider "neutral" going forward, the ball is in your court.
Darling:
PBF Energy Inc. (PBF)
EARNINGS: 7/28/2022 (BMO)
PBF Energy, Inc. engages in the operation of a petroleum refiner and supplies unbranded transportation fuels, heating oil, petrochemical feed stocks, lubricants, and other petroleum products in the United States. It operates through the following segments: Refining and Logistics. The Refining segment refines crude oil and other feed stocks into petroleum products. The Logistics segment owns, leases, operates, develops, and acquires crude oil and refined petroleum products terminals, pipelines, storage facilities, and logistics assets. The company was founded on March 1, 2008 and is headquartered in Parsippany, NJ.
Predefined Scans Triggered: New CCI Buy Signals and P&F Low Pole.
Below are the commentary and chart from Wednesday, 7/27:
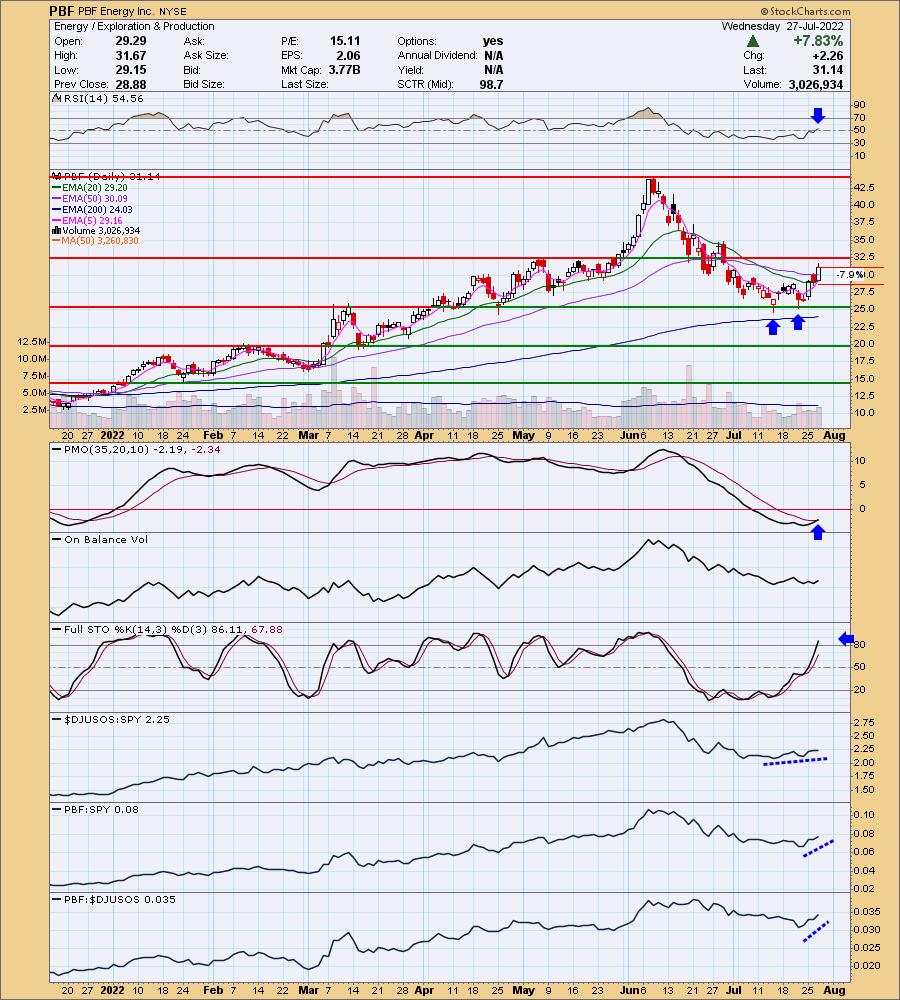
"PBF is up +0.45% in after hours trading. I have covered it numerous times this year and also in 2021. I'm putting the link to the latest report in. The links to the other reports will be in that last report. June 1st 2022 (position closed on correction), May 3rd 2022 (position closed on correction but at peak it was up over 40%), January 6th 2022 (position open and up +102.21%) and May 6th 2021 (position closed).
My one issue is it reports earnings tomorrow and it was up a hefty +7.83% today which could mean a pullback tomorrow. I don't usually get burned holding into earnings or even buying into them, but I don't do it very much. The RSI is positive and rising. The PMO had a crossover BUY signal today. Stochastics are rising strongly above 80. Relative strength is acceptable for the group, but PBF is doing better. The stop is set below the 5/20-day EMAs."
Here is today's chart:
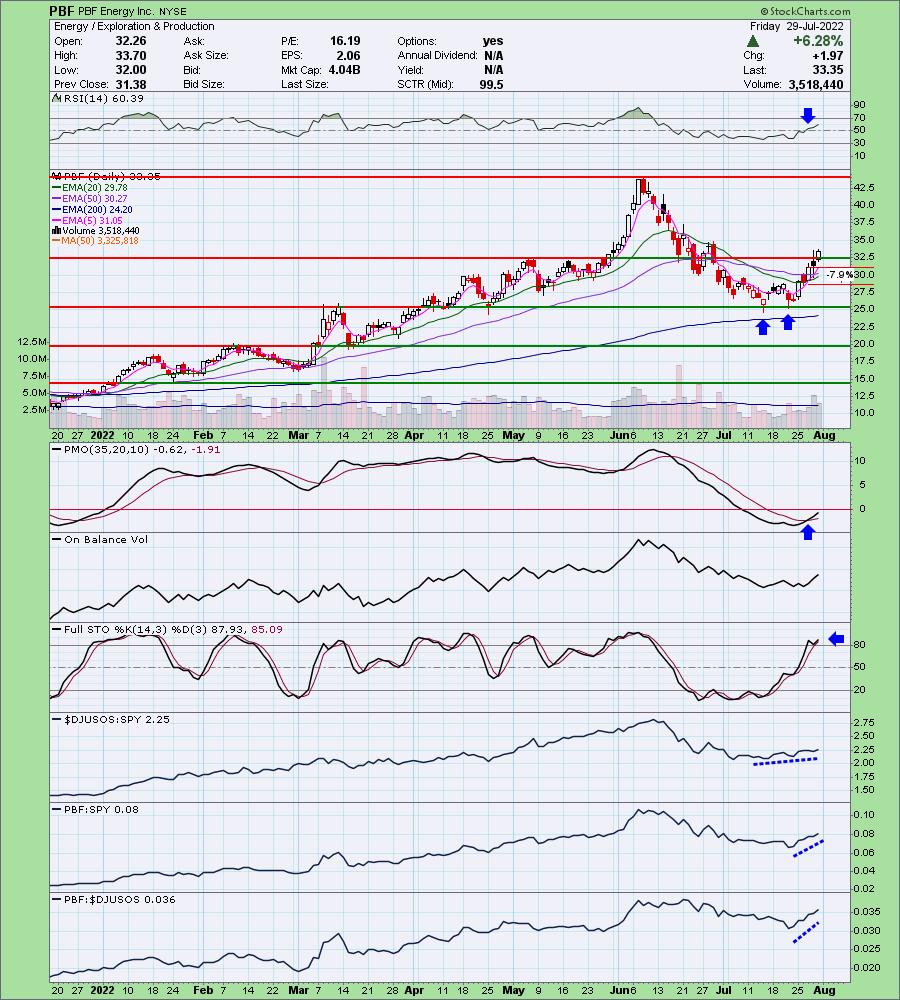
The breakout here is great. The 20-day EMA is getting close to a cross above the 50-day EMA (a "Silver Cross"). The RSI is positive and not overbought. The PMO look like it did back in December of 2021. I like the set up here and as noted earlier, I do own it.
Don't forget, on Thursdays I look at reader-requested symbols, so shoot me an email at erin@decisionpoint.com. I read every email I receive and try to answer them all!
Dud:
Procter & Gamble Co. (PG)
EARNINGS: 7/29/2022 (BMO)
Procter & Gamble Co. engages in the provision of branded consumer packaged goods. It operates through the following segments: Beauty, Grooming, Health Care, Fabric & Home Care, and Baby, Feminine & Family Care. The Beauty segment offers hair, skin, and personal care. The Grooming segment consists of shave care like female and male blades and razors, pre and post shave products, and appliances. The Health Care segment includes oral care products like toothbrushes, toothpaste, and personal health care such as gastrointestinal, rapid diagnostics, respiratory, and vitamins, minerals, and supplements. The Fabric and Home Care segment consists of fabric enhancers, laundry additives and detergents, and air, dish, and surface care. The Baby, Feminine and Family Care segment sells baby wipes, diapers, and pants, adult incontinence, feminine care, paper towels, tissues, and toilet paper. The company was founded by William Procter and James Gamble in 1837 and is headquartered in Cincinnati, OH.
Predefined Scans Triggered: None.
Below are the commentary and chart from Tuesday, 7/26:
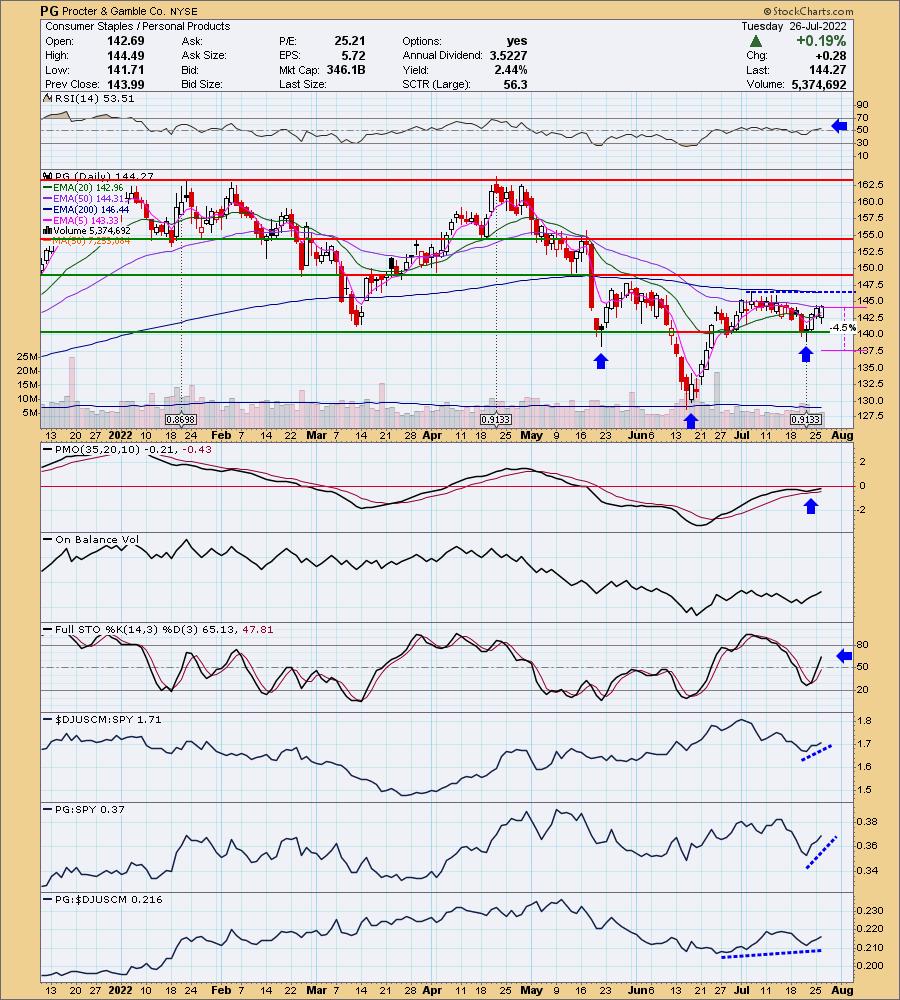
"PG is up +0.03% in after hours trading. I've covered it twice before. First on April 23rd 2020 (position is still open and up +20.83%) and December 28th 2020 (position is closed). Today it formed a bullish engulfing candlestick on a follow-through day. Price nearly closed above the 50-day EMA. We have a reverse head and shoulders pattern. The upside target of that pattern would put price around $164.50. The RSI is positive and rising. The PMO bottomed above the signal line which is especially bullish. Stochastics are rising in positive territory. Relative strength is picking up this last week. The stop can be set very thinly at 4.5%."
Here is today's chart:
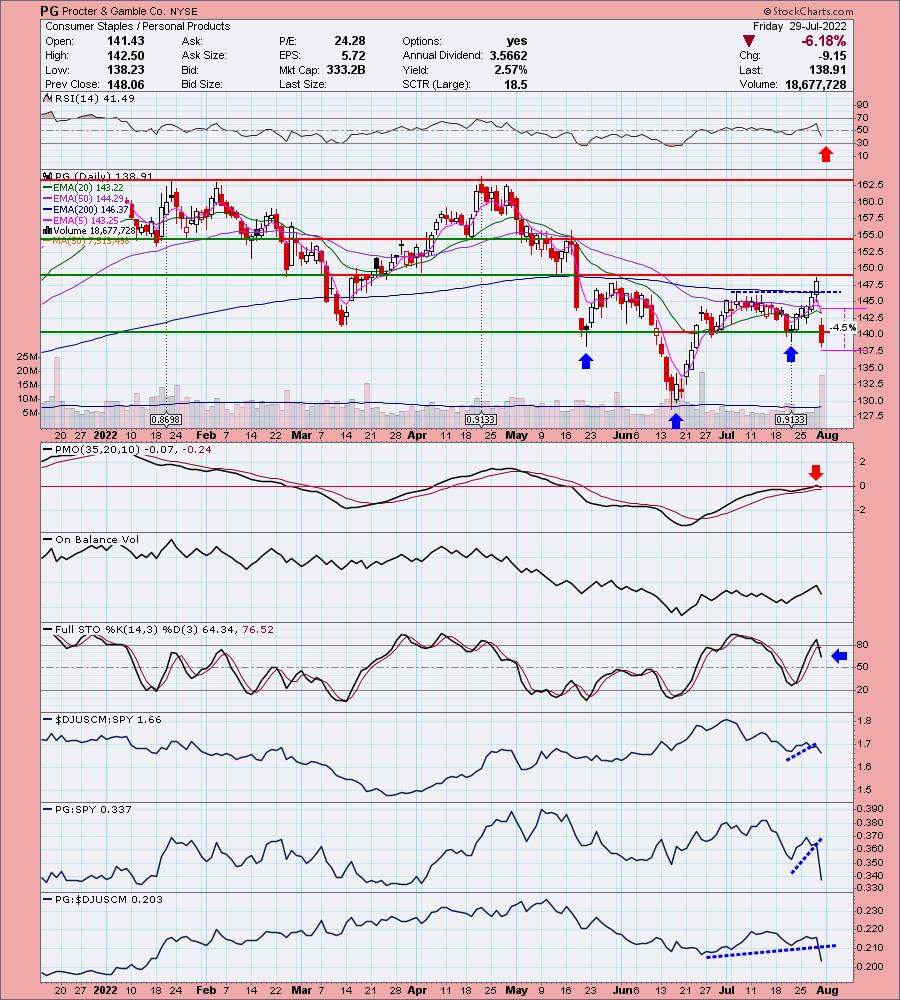
Ugly breakdown that basically took out the bullish reverse head and shoulders. The technicals were strong and price was humming along until they reported earnings this morning. I don't have the details, but clearly investors did not like what was said. The PMO tipped over and the RSI tumbled quickly into negative territory. Relative strength fell out of bed and Stochastics have topped. The stop hasn't triggered yet, but it doesn't need to. The chart is very bearish right now and an exit at this point wouldn't be a bad idea. It is now more of a short candidate than a long.
THIS WEEK's Sector Performance:

DecisionPoint Sector Scoreboard (Mechanical Trend Model Signals):

Click Here to view Carl's annotated Sector ChartList!
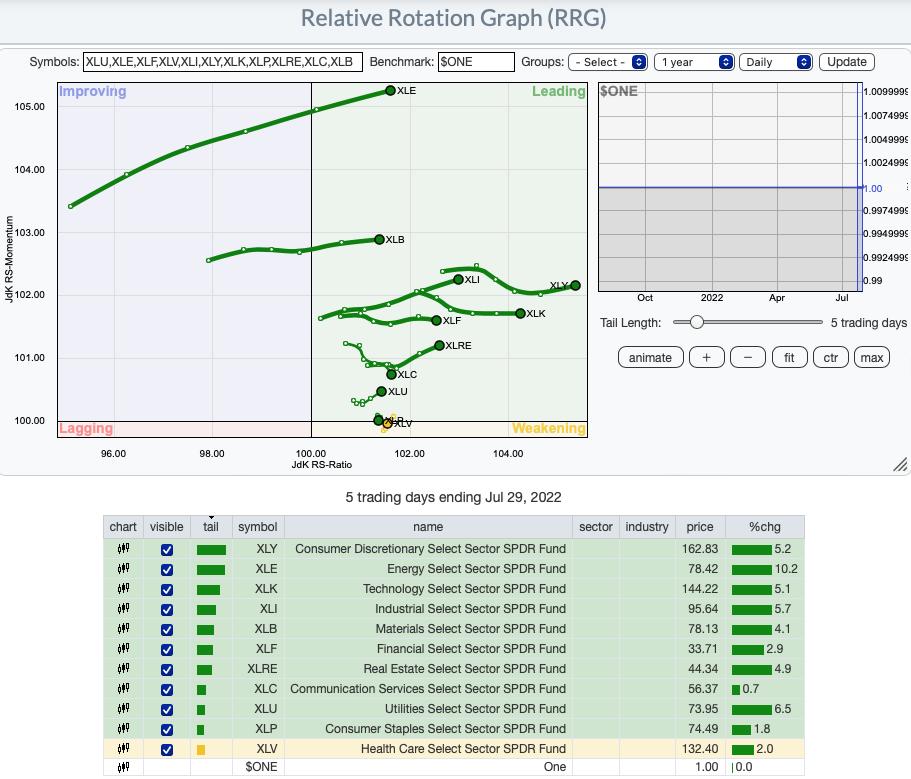
RRG® Daily Chart ($ONE Benchmark):
Major improvement to the daily RRG this week. All but XLV are in the Leading quadrant. The most bullish are those with northeast headings: XLE, XLB, XLY, XLI, XLK, XLRE and XLU. Middle ground would be XLF and XLC which are in the Leading quadrant but haven't got complete bullish headings given they are moving southeast. The two weakest sectors are clearly XLP and XLV which have gained no ground this week as they rotate in place. XLV is clearly the weakest given its southwest bearish heading and being the only sector sitting within the Weakening quadrant.
RRG® Weekly Chart ($ONE Benchmark):
The weekly RRG is bullish. All sectors with the exception of XLB and XLE have bullish northeast headings. If they continue in this direction we will all nearly all of them in the Improving or Leading quadrants next week. XLB isn't really bearish. It is traveling swiftly northward and also could hit the Improving quadrant soon. XLE is still traveling in the bearish southwest direction, but it is flattening out and could make the turn to the north soon.
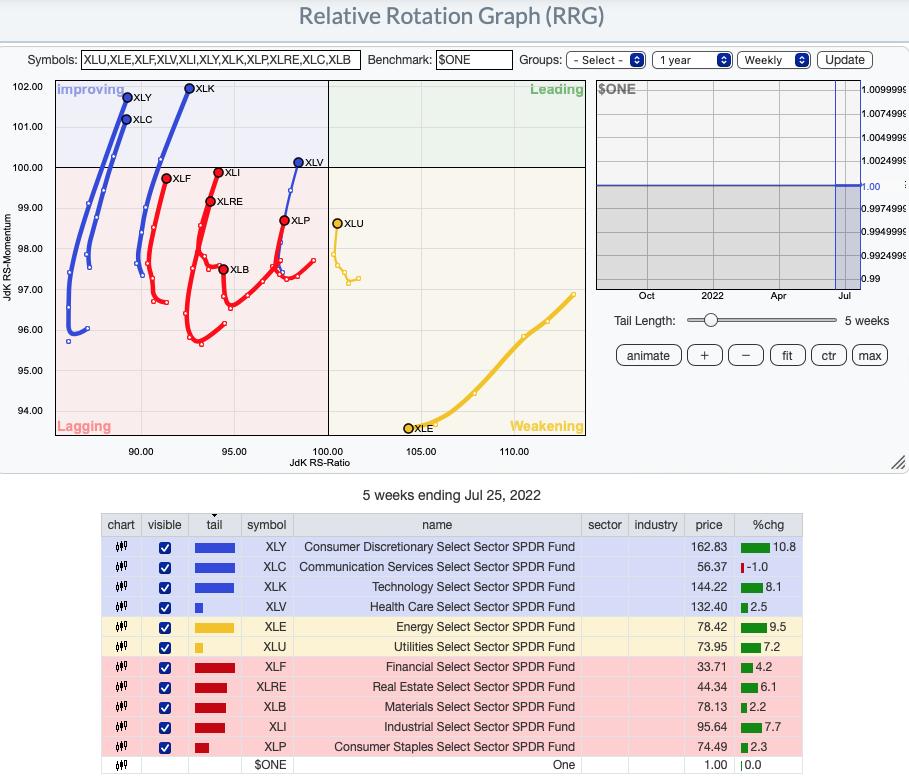
RRG® charts show you the relative strength and momentum for a group of stocks. Stocks with strong relative strength and momentum appear in the green Leading quadrant. As relative momentum fades, they typically move into the yellow Weakening quadrant. If relative strength then fades, they move into the red Lagging quadrant. Finally, when momentum starts to pick up again, they shift into the blue Improving quadrant.
CLICK HERE for an animated version of the RRG charts.
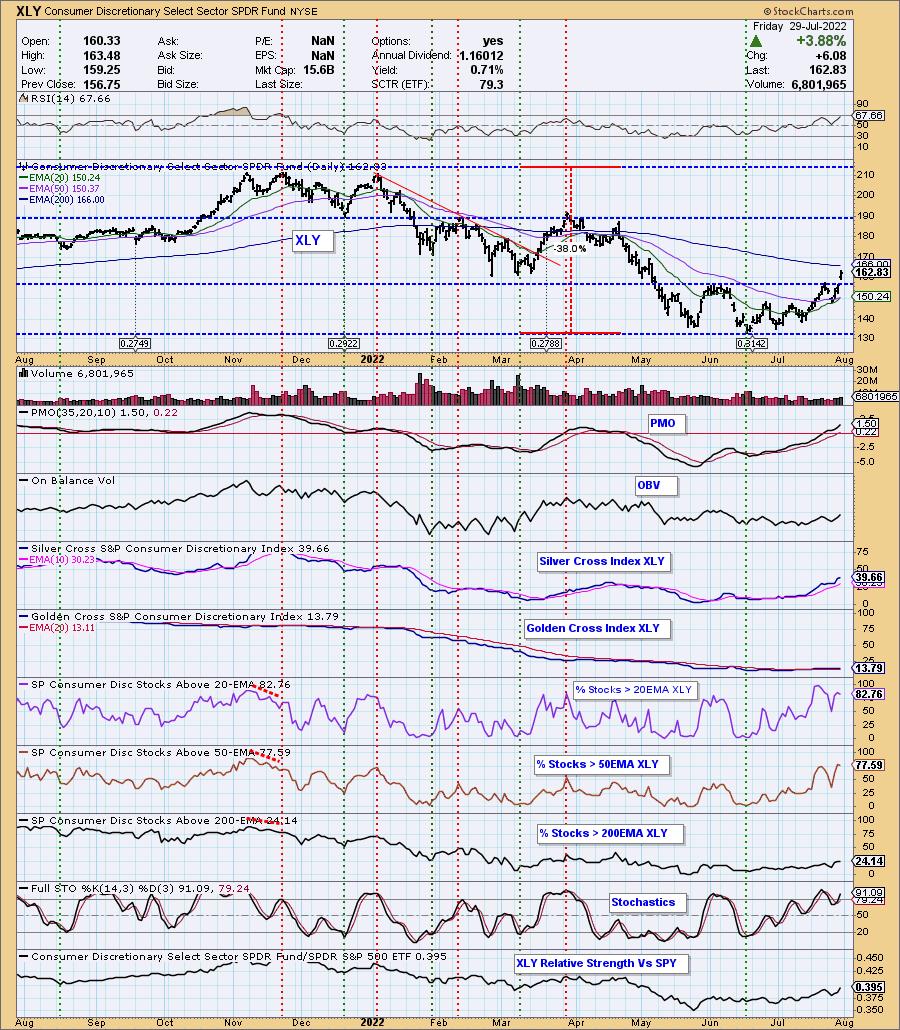
Sector to Watch: Consumer Discretionary (XLY)
As noted earlier, it was a very hard decision. So many of the sectors look strong "under the hood". It was interesting to see participation thin slightly on today's huge breakout. There are plenty of industry groups within this sector and there were two in particular that looked especially bullish while many of the others were more neutral to bearish. Right now XLY has one of the strongest Silver Cross Index readings and paired with great participation of stocks above their 20/50-day EMAs, it will start rising even more quickly.
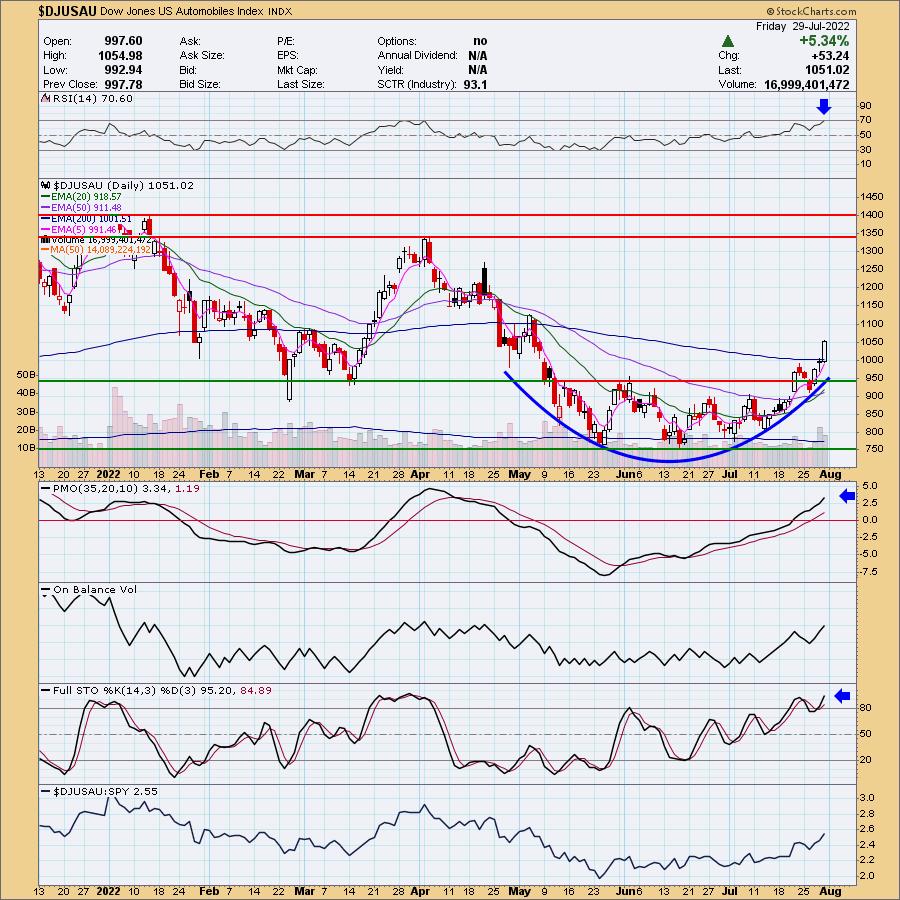
Industry Group to Watch: Automobiles ($DJUSAU)
I really like the cup-shaped basing pattern on this group. If I had to complain, it would be that the RSI is getting overbought, but unlike the top in April, price has been forming this base. The PMO is accelerating higher and the OBV is confirming this breakout. Stochastics are oscillating above 80 and relative strength is picking up. What I found is that there are only a handful that are outperforming the industry group. The rest all seemed to be underperforming the group. Hence the three stocks I liked in this area were Ford (F), Tesla (TSLA) and General Motors (GM). They have improving or similar strength to the group which is slowly outperforming the SPY.
Go to our Sector ChartList on DecisionPoint.com to get an in-depth view of all the sectors.
Have a great weekend! Good Luck & Good Trading!
- Erin
erin@decisionpoint.com
Full Disclosure: I'm 50% exposed.
Watch the latest episode of DecisionPoint with Carl & Erin Swenlin on Mondays 7:00p EST or on the DecisionPoint playlist on the StockCharts TV YouTube channel here!
Technical Analysis is a windsock, not a crystal ball. --Carl Swenlin
NOTE: The stocks reported herein are from mechanical trading model scans that are based upon moving average relationships, momentum and volume. DecisionPoint analysis is then applied to get five selections from the scans. The selections given should prompt readers to do a chart review using their own analysis process. This letter is not a call for a specific action to buy, sell or short any of the stocks provided. There are NO sure things or guaranteed returns on the daily selection of "diamonds in the rough."
Helpful DecisionPoint Links:
DecisionPoint Shared ChartList and DecisionPoint Chart Gallery
Price Momentum Oscillator (PMO)
Swenlin Trading Oscillators (STO-B and STO-V)
(c) Copyright 2022 DecisionPoint.com