
I had planned on only presenting shorts and inverse ETFs, but two stocks came through on my Diamond PMO Scan that look like they will continue to outperform within the Energy sector. I've noticed that many of the inverse ETFs are ultrashort or "juiced", meaning they are two to three times the short exposure. I'm trying to tease out inverse ETFs that match my analysis, but also don't overexpose anyone. Feel free to consider ultra-short ETFs, just be prepared for a LOT of volatility. I am only 15% exposed. If I decide to add exposure, it will be small positions, inverse, short or otherwise. If you invest in an inverse ETF that is "juiced" by 2x or 3x, consider making your positions half or one-third the size.
It was brought to my attention by a subscriber whose opinion I value highly that in a bear market, it is better to limit your exposure to loss. While I will always have "Diamonds in the Rough" out there for you to review each week, remember, the point of Diamonds is not to populate your portfolio, but to teach you what makes a good chart. This is in the disclaimer, but I want to emphasize it given the volatile nature of the market right now.
Most of us have not experienced lengthy bear markets. I'm old enough to have seen a few. Bear market rallies are so hard to endure as they tend to be volatile and will stimulate the "fear of missing out" in your brain or will erode your resolve in inverse or short positions. It is a lot of push and pull with fake out breakouts that eventually grind down retail traders. If you're not making the kind of money you were, or are experiencing fatigue or anxiety, limiting exposure and risk will help you sleep better at night. It is also a good time to learn more about technical analysis.
Good Luck & Good Trading,
Erin
Today's "Diamonds in the Rough": PBF, SOI and TBF.
Stocks to Review: GTLS, PFIX, SDOW and TTT.

Diamond Mine RECORDING LINK (4/29/2022):
Topic: DecisionPoint Diamond Mine (4/29/2022) LIVE Trading Room
Start Time: Apr 29, 2022 09:01 AM
Meeting Recording Link.
Access Passcode: April@29
REGISTRATION FOR 5/6 Diamond Mine:
When: May 6, 2022 09:00 AM Pacific Time (US and Canada)
Topic: DecisionPoint Diamond Mine (5/6/2022) LIVE Trading Room
Register in advance for this webinar HERE.
** Save the registration confirmation email with login instructions in case Zoom doesn't notify you in time.**

Free DP Trading Room (5/2) RECORDING LINK:
Topic: DecisionPoint Trading Room
Start Time: May 2, 2022 09:00 AM
Meeting Recording Link.
Access Passcode: May#the2nd
For best results, copy and paste the access code to avoid typos.
Welcome to DecisionPoint Daily Diamonds, wherein I highlight ten "Diamonds in the Rough" per week. These are selected from the results of my DecisionPoint Scans, which search for stocks that could benefit from the trend and condition of the market. Remember, these are not recommendations to buy or sell, but are the most interesting of the stocks that surfaced in my scans. My objective is to save you the work of the initial, tedious culling process, but you need to apply your own analysis to see if these stocks pique your interest as well. There are no guaranteed winners here!
"Predefined Scans Triggered" are taken from StockCharts.com using the "Symbol Summary" option instead of a "SharpChart" on the workbench.
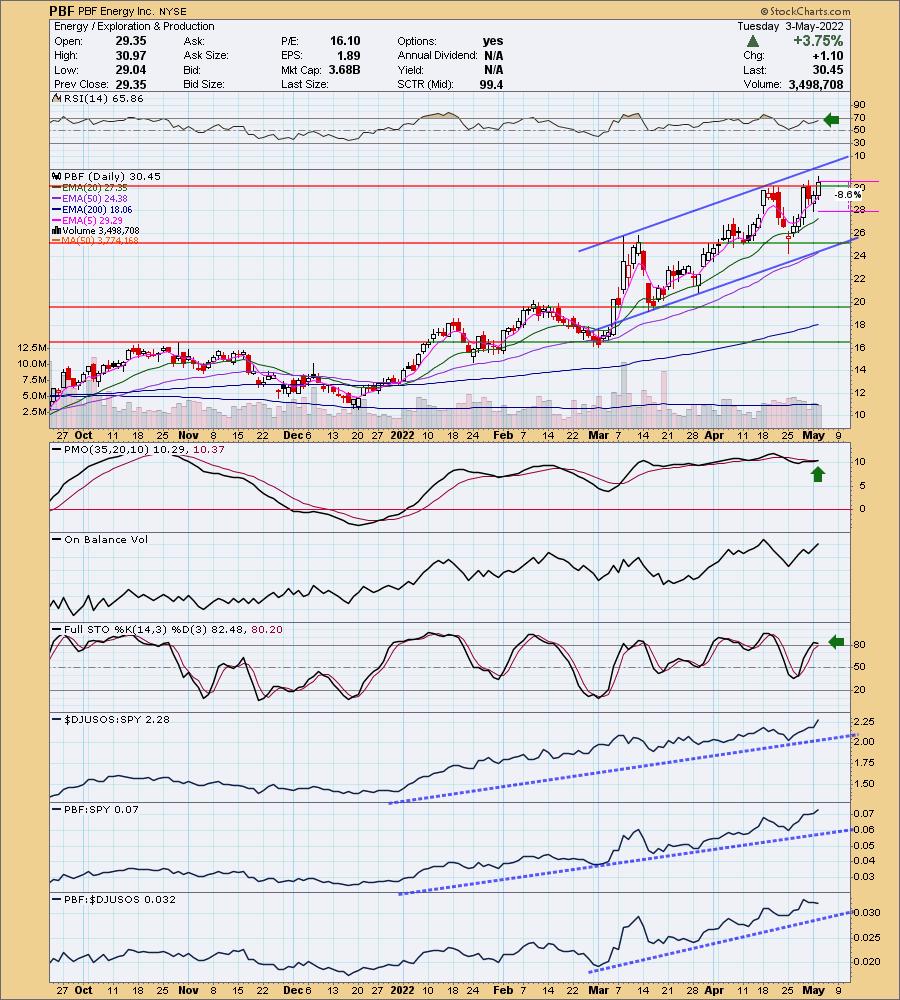
PBF Energy Inc. (PBF)
EARNINGS: 7/28/2022 (BMO)
PBF Energy, Inc. engages in the operation of a petroleum refiner and supplies unbranded transportation fuels, heating oil, petrochemical feed stocks, lubricants, and other petroleum products in the United States. It operates through the following segments: Refining and Logistics. The Refining segment refines crude oil and other feed stocks into petroleum products. The Logistics segment owns, leases, operates, develops, and acquires crude oil and refined petroleum products terminals, pipelines, storage facilities, and logistics assets. The company was founded on March 1, 2008 and is headquartered in Parsippany, NJ.
Predefined Scans Triggered: New 52-week Highs.
PBF is up +0.33% in after hours trading. I've covered PBF twice before on May 6th 2021 (position stopped out) and January 6th 2022 (position is still open and up +97.7%). As noted in the predefined scans, PBF hit new 52-week highs today. The stock is in a rising trend channel. The RSI is positive and not overbought. The PMO is about to trigger a crossover BUY signal. The PMO has been relatively flat, but that is a function of acceleration being steady. Stochastics are above 80 indicating internal strength. Relative strength of this group and Energy as a whole, make this one attractive. The stop is set below yesterday's intraday low, around the 20-day EMA.
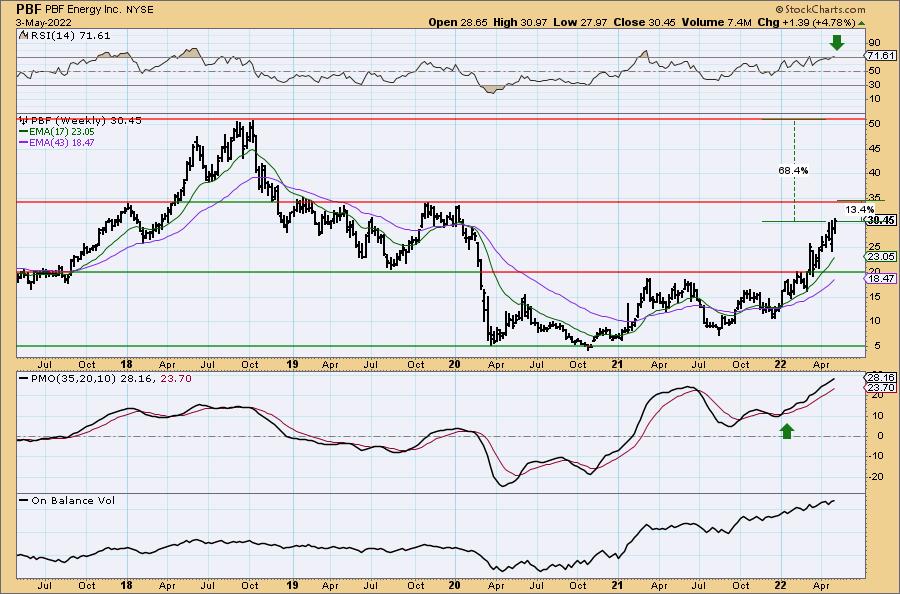
The weekly RSI is now overbought, but we can see that doesn't mean an immediate failure. With Oil prices rising and not looking like they will come down, I believe we will at least see a test of $35 for a 13% gain, but more than likely the breakout will occur and price could actually reach all-time highs.
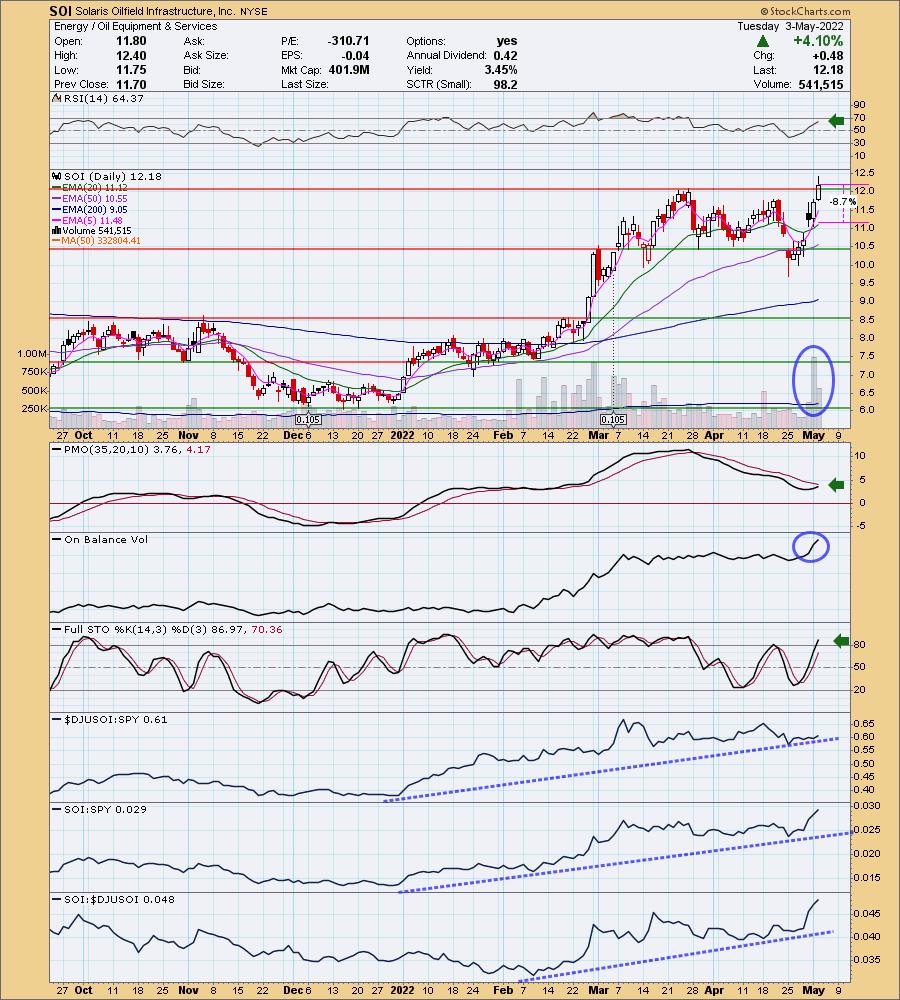
Solaris Oilfield Infrastructure, Inc. (SOI)
EARNINGS: 7/28/2022 (AMC)
Solaris Oilfield Infrastructure, Inc. operates as a holding company, which engages in the manufacture of patented mobile proppant management systems that unload, store, and deliver proppant at oil and natural gas well sites. Its products include Mobile Proppant and Mobile Chemical Management Systems, and Inventory Management Software. The firm's services include field, last mile management, and transloading services. The company was founded by William A. Zartler in 2014 and is headquartered in Houston, TX.
Predefined Scans Triggered: New CCI Buy Signals, New 52-week Highs, Moved Above Upper Bollinger Band and Moved Above Upper Price Channel.
SOI is unfortunately down -1.31% in after hours trading, so watch the 5-minute candlestick chart carefully if you decide to enter. It was a big 4%+ move so a bit of a pullback would make sense. Today price broke to new 52-week highs on big volume. The OBV is shooting skyward with all of the volume coming in. The RSI is positive, rising and not overbought. The PMO is rising toward a crossover BUY signal. Stochastics are now above 80 and relative strength is great, but also notice relative strength lines against the SPY and the industry group are quickly moving higher. The stop is set around gap support and the 20-day EMA, adjust to suit your entry level and risk appetite.
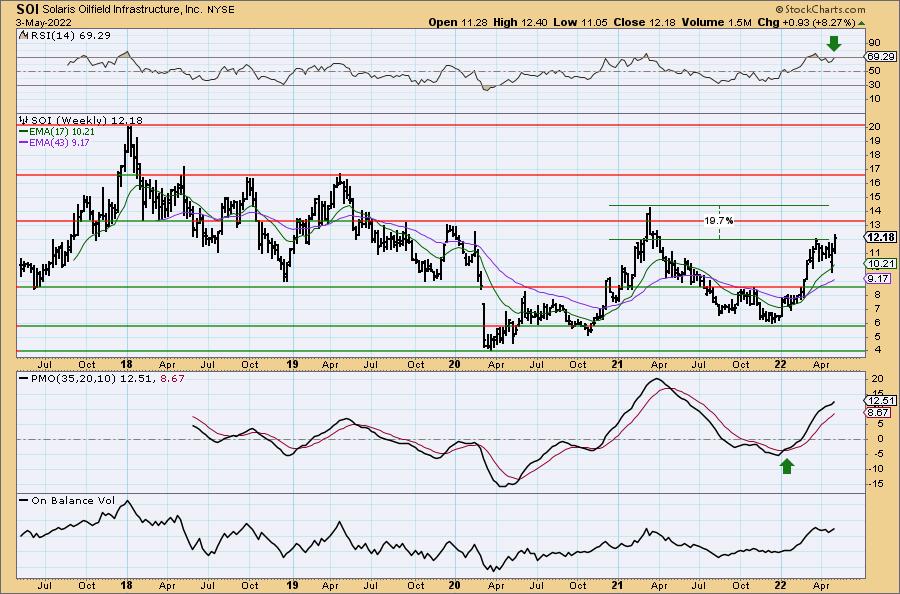
SOI has a strong weekly chart. The PMO in particular is very bullish as it is now accelerating higher and is not overbought. The RSI is rising and isn't overbought just yet. If price can return to the 2021 high that would be about a 19% gain. However I suspect it will move even higher.
ProShares Short 20+ Year Treasury (TBF)
EARNINGS: N/A
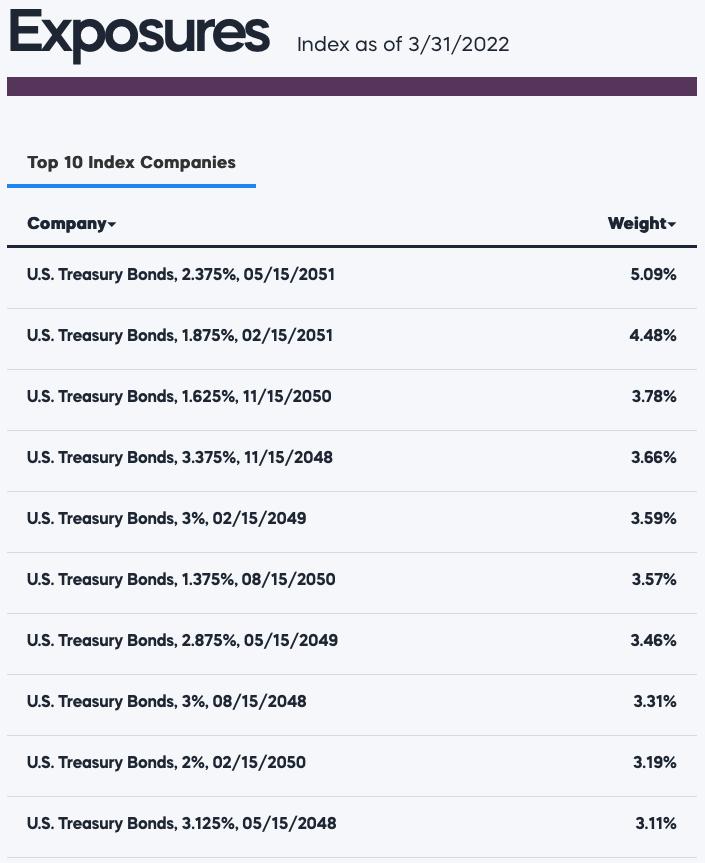
TBF provides daily inverse exposure to a market-value-weighted index that tracks the performance of US Treasury securities with remaining maturities greater than 20 years.
Predefined Scans Triggered: Hollow Red Candles, P&F Ascending Triple Top Breakout and P&F Double Top Breakout.
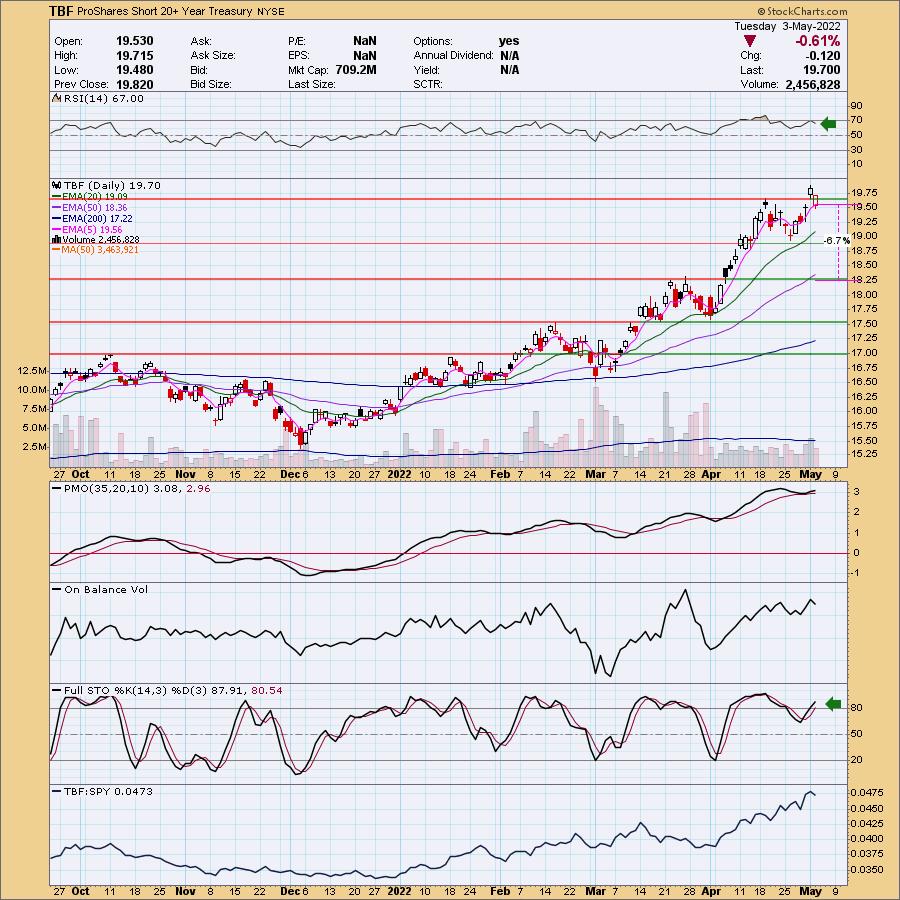
TBF is down -0.30% in after hours trading. This is a one-to-one short exposure to the 20-year Treasury Bonds. The ultrashort version is TTT which looks very much the same, so you can decide your exposure level. I didn't like today pullback after the nice breakout yesterday above resistance, but the rising trend is fully intact and I believe rates will be moving much higher which will depress Bond prices. Another way to play rising rates is the inverse ETF, PFIX.
The RSI was nearing overbought territory, but this small decline has alleviated that condition. The PMO has bottomed above its signal line which is especially bullish. Stochastics are above 80 again and obviously this has been a strong relative performer against the SPY. This one isn't volatile given it isn't "juiced" so the stop can be set below support at the March high. I doubt very much that it will see that level anytime soon.
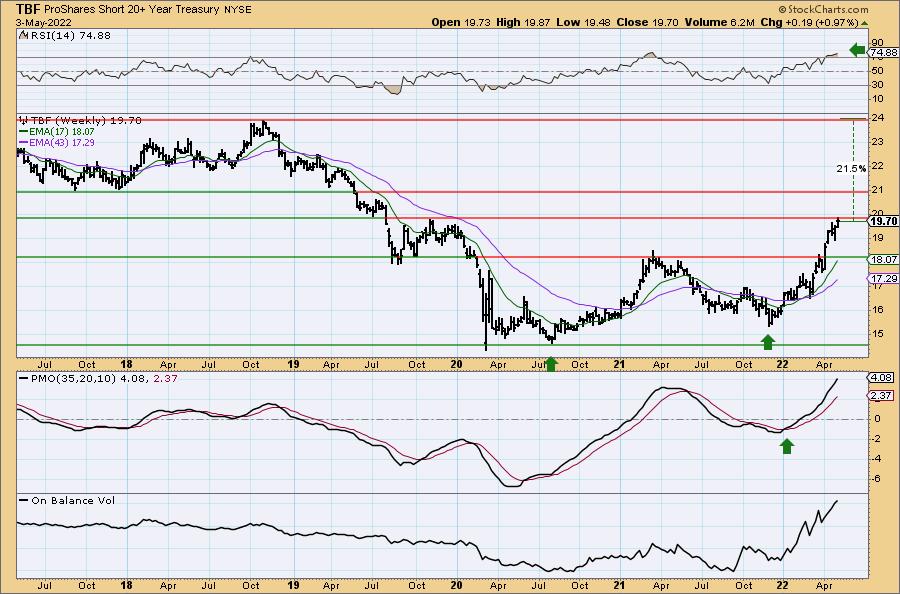
I do note price is up against long-term resistance. If it breaks out, there is yet another level of resistance at the 2017 lows. However, as I said, I'm bullish on this one and expect the breakout. Yields aren't coming down. The FOMC will announce their 50 basis point hike tomorrow.
Don't forget, on Thursdays I look at reader-requested symbols, click HERE to shoot me an email. I read every email I receive and try to answer them all!
Current Market Outlook:
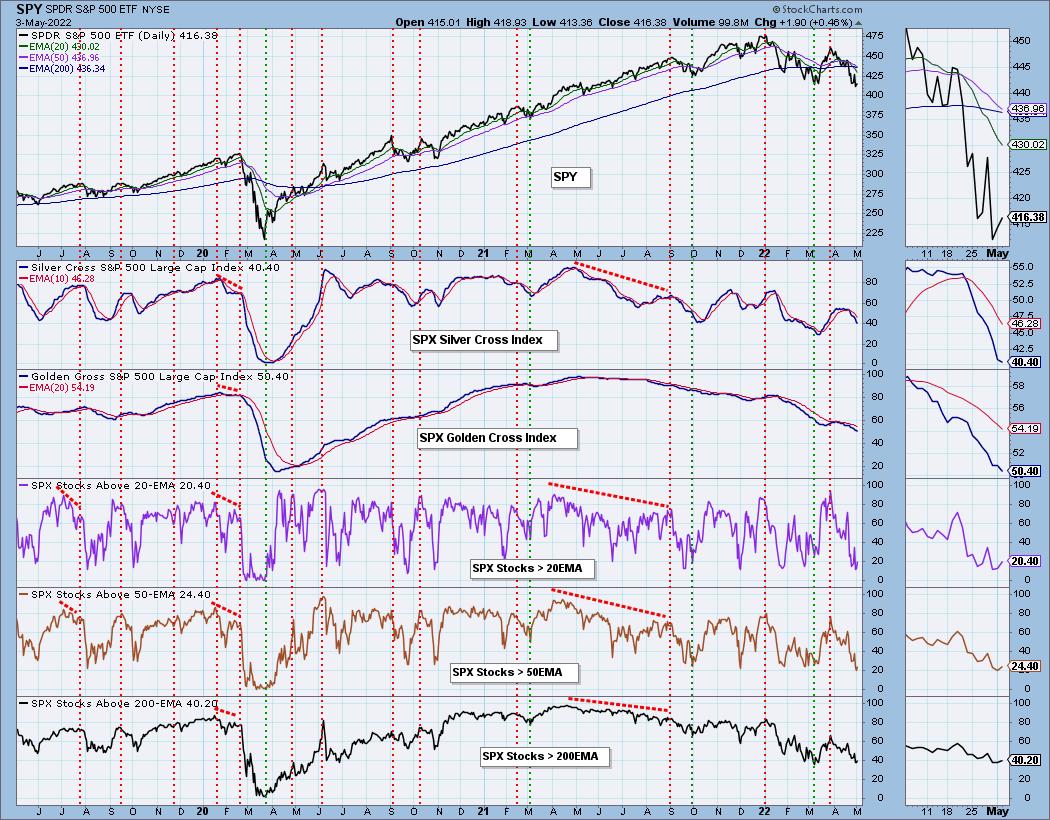
Market Environment: It is important to consider the odds for success by assessing the market tides. The following chart uses different methodologies for objectively showing the depth and trend of participation for intermediate- and long-term time frames.
- The Silver Cross Index (SCI) shows the percentage of SPX stocks on IT Trend Model BUY signals (20-EMA > 50-EMA)
- The Golden Cross Index (GCI) shows the percentage of SPX stocks on LT Trend Model BUY signals (50-EMA > 200-EMA)
Don't forget that as a "Diamonds" member, you have access to our GCI/SCI curated ChartList on DecisionPoint.com. You'll find it under "Members Only" links on the left side on the Blogs and Links Page.
Here is the current chart:
Full Disclosure: I'm 15% invested and 85% is in 'cash', meaning in money markets and readily available to trade with. Looking into PFIX and TTT which I mentioned in today's blog.
I'm required to disclose if I currently own a stock and/or may buy it within the next 72 hours.
"Technical Analysis is a windsock, not a crystal ball." - Carl Swenlin
(c) Copyright 2022 DecisionPoint.com
Watch the latest episode of DecisionPoint with Carl & Erin Swenlin on Mondays 7:00p EST or on the DecisionPoint playlist on the StockCharts TV YouTube channel here!
NOTE: The stocks reported herein are from mechanical trading model scans that are based upon moving average relationships, momentum and volume. DecisionPoint analysis is then applied to get five selections from the scans. The selections given should prompt readers to do a chart review using their own analysis process. This letter is not a call for a specific action to buy, sell or short any of the stocks provided. There are NO sure things or guaranteed returns on the daily selection of "Diamonds in the Rough."
Helpful DecisionPoint Links:
DecisionPoint Shared ChartList and DecisionPoint Chart Gallery
Price Momentum Oscillator (PMO)
Swenlin Trading Oscillators (STO-B and STO-V)
For more links, go to DecisionPoint.com