
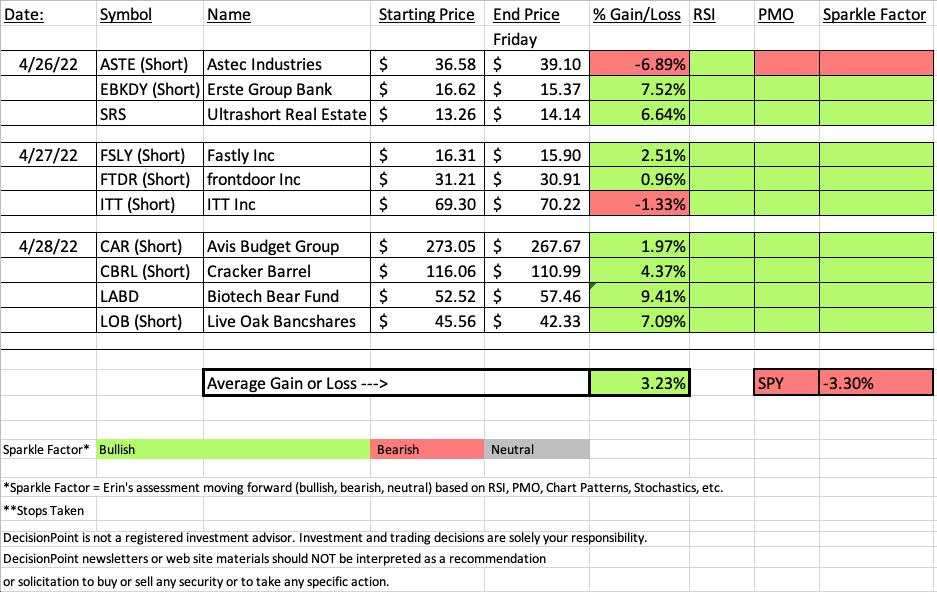
With the market bearish, we decided to go with short positions and inverse ETFs. Turned out to be brilliant as "Diamonds in the Rough" finished up +3.23% while the SPY finished the week at -3.30%. In all honesty, had the market not had two strong rally days this week, Diamonds would have finished even stronger.
To clarify the spreadsheet a bit more, remember that in the case of short positions, "green" means bearish. For example, if the PMO is moving lower on a short position, it would be considered "green". Astec Industries (ASTE) did not trigger the stop after the close, but it is still our "Dud" this week as it rallied over 6% this week. The "Darling" is the Biotech inverse ETF.
We will continue to point out short positions and inverse ETFs next week until it appears safer to get back in the water. I doubt that will be very soon.
This week is a little different. I've decided to look at the worst sector going into next week. There are plenty of inverse sector ETFs and given last week's success, I believe going that direction makes the most sense. I don't like any of the sectors for longs right now.
For "Industry Group to Watch", I tried to find any industry group with potential. There are only a handful that have rising PMOs. I decided to highlight one of the worst sectors. It goes hand in hand with the inverse ETF that hit it big this week.
Have a great weekend! See you in Monday's free trading room! Next Diamonds report will be on Tuesday, 5/3.
Erin

RECORDING LINK (4/29/2022):
Topic: DecisionPoint Diamond Mine (4/29/2022) LIVE Trading Room
Start Time: Apr 29, 2022 09:01 AM
Meeting Recording Link.
Access Passcode: April@29
REGISTRATION FOR Friday 5/6 Diamond Mine:
When: May 6, 2022 09:00 AM Pacific Time (US and Canada)
Topic: DecisionPoint Diamond Mine (5/6/2022) LIVE Trading Room
Register in advance for this webinar HERE.
Save the registration confirmation email with login instructions in case Zoom doesn't notify you in time.

Free DP Trading Room (4/25/2022) RECORDING LINK:
Topic: DecisionPoint Trading Room
Start Time: Apr 25, 2022 09:00 AM
Meeting Recording Link.
Access Passcode: April@25
For best results, copy and paste the access code to avoid typos.
A few items about the spreadsheet: I've put on the spreadsheet whether the RSI is positive (green) or negative (red). The PMO column tells you if it is rising (green) or falling (red). Finally I've added my own "Sparkle Factor" that gives you my assessment going forward, bullish (green), bearish (red) or neutral (gray). The Sparkle Factor is basically my thoughts on whether I expect it to rise or fall. A neutral means it could really go either way so it could be added to a watch list. If you're in a stock I consider "neutral" going forward, the ball is in your court.
Darling:
Direxion Daily S&P Biotech Bear 3x Shares (LABD)
EARNINGS: N/A
LABD provides daily 3 times inverse exposure to the S&P Biotechnology Select Industry Index. For more Fund information click HERE.
Predefined Scans Triggered: Elder Bar Turned Blue, New 52-week Highs, Hollow Red candles, P&F Ascending Triple Top Breakout, P&F Double Top Breakout and Shooting Star.
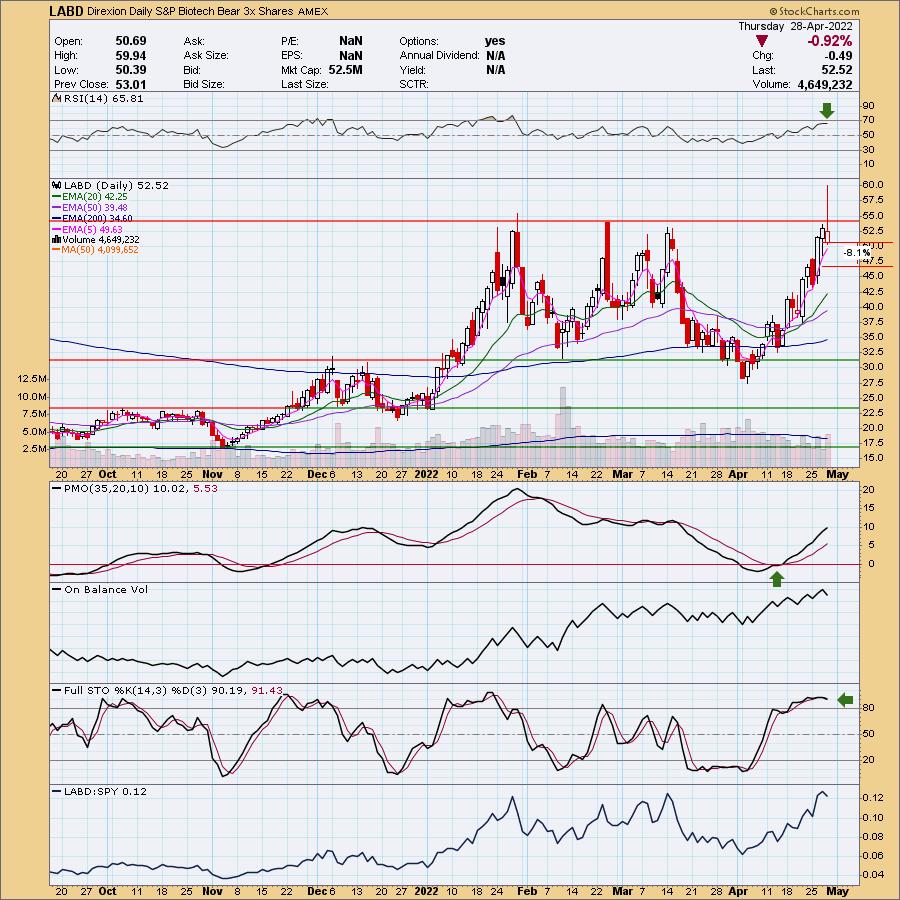
Below are the commentary and chart from 4/28:
"LABD is up +2.99% in after hours trading. I definitely like this chart. It did fail to breakout, but if indicators are correct, we will see that breakout. The RSI is positive and not overbought. The PMO is rising strongly after a crossover BUY signal on the zero line. Volume is coming in as the OBV is confirming the rising trend. Stochastics are above 80 and this fund has performed very well against the SPY."
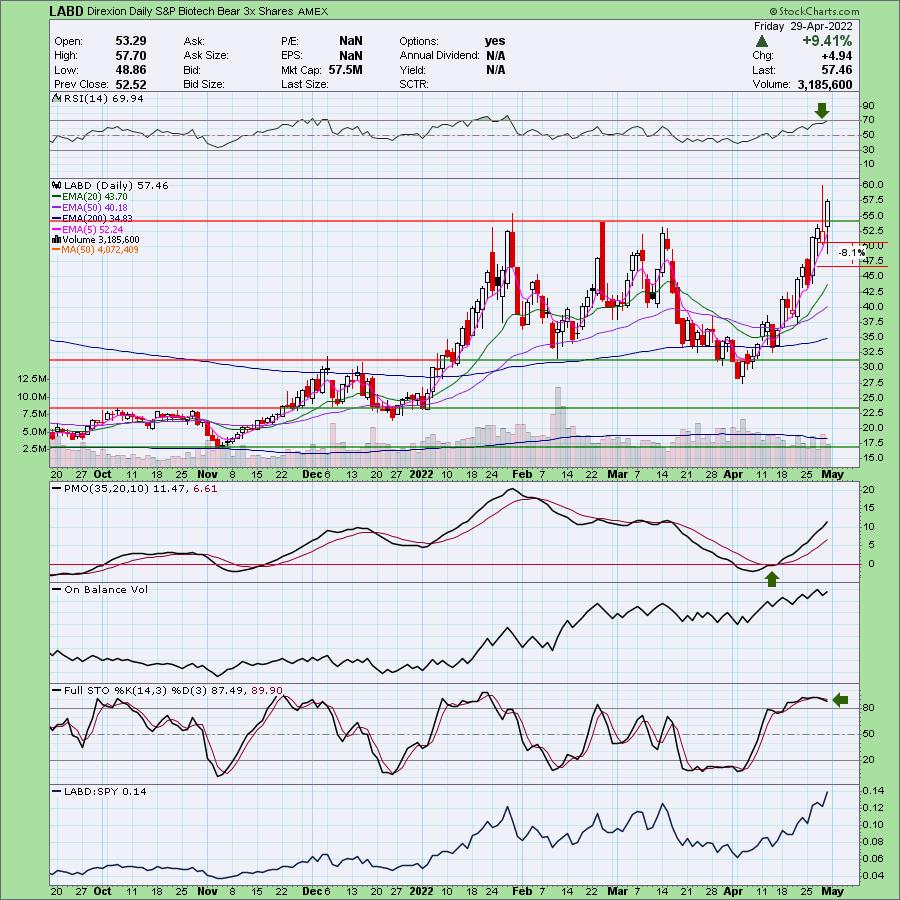
Here is today's chart:
This is an "ultrashort" 3x ETF so with the Biotechs losing over 3% today, this ETF gained over 9%. Today we got a confirming breakout. Indicators are still strongly bullish so I like this one going forward. It's on my radar next week as well as finding a good ultrashort Healthcare ETF (my scant research on Google didn't produce any, but there must be one out there somewhere).
Don't forget, on Thursdays I look at reader-requested symbols, so shoot me an email at erin@decisionpoint.com. I read every email I receive and try to answer them all!
Dud:
Astec Industries, Inc. (ASTE) - SHORT
EARNINGS: 5/4/2022 (BMO)
Astec Industries, Inc. engages in the manufacture of equipment and components for the infrastructure, and aggregate and mining industries. It operates through the following segments: Infrastructure Solutions, Material Solutions, and Corporate. The Infrastructure Solutions segment markets line of asphalt plants and related components, asphalt pavers, screeds, milling machines, material transfer vehicles, stabilizers, and related ancillary equipment. The Material Solutions segment focuses on designing and manufacturing heavy processing equipment, as well as servicing and supplying parts for the aggregate, metallic mining, recycling, ports, and bulk handling markets. The Corporate segment includes the firm's parent company and Astec Insurance Co. The company was founded by J. Don Brock in 1972 and is headquartered in Chattanooga, TN.
Predefined Scans Triggered: P&F Descending Triple Bottom Breakdown, Moved Below Lower Price Channel, New 52-week Lows, P&F Double Bottom Breakout and Moved Below Lower Keltner Channel.
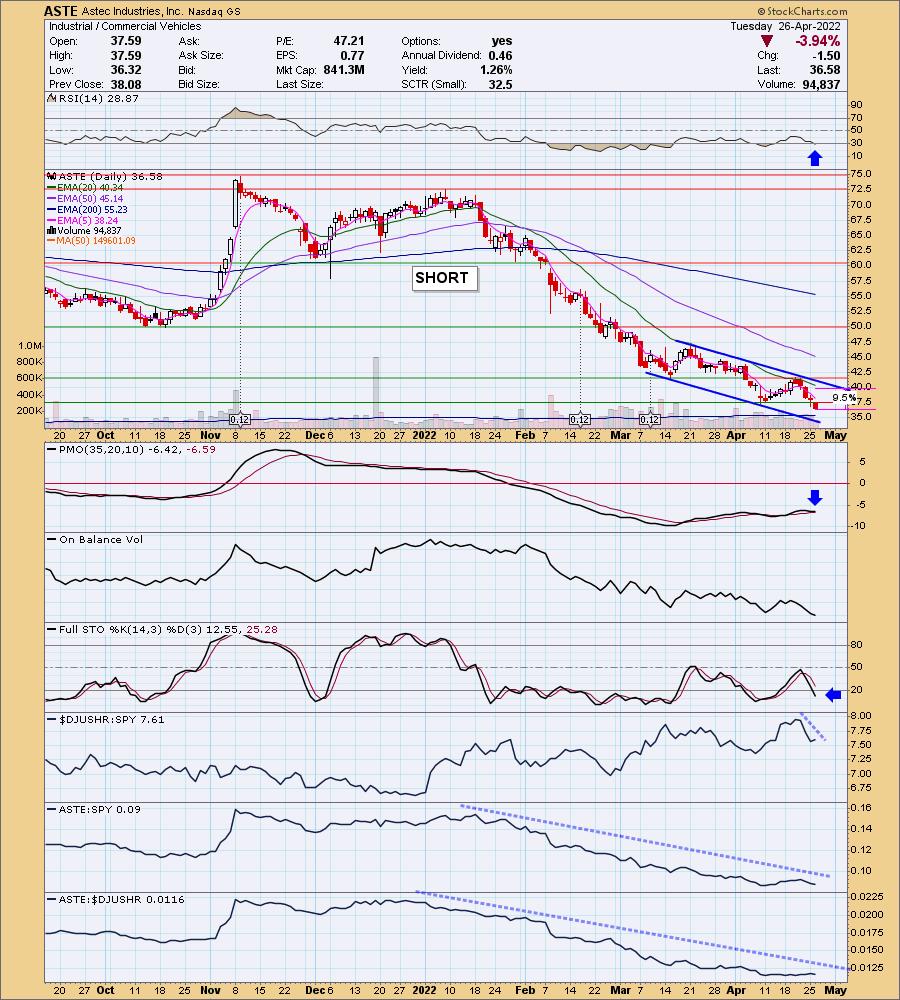
Below are the commentary and chart from Tuesday 4/26:
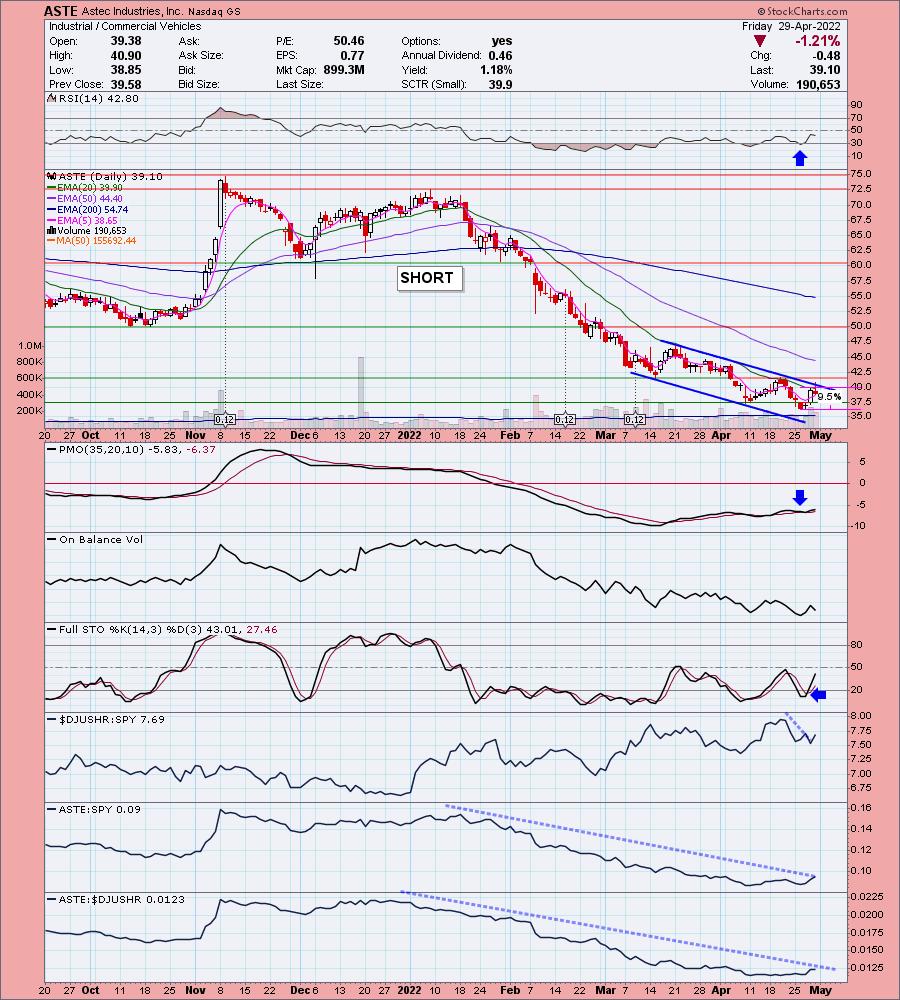
"ASTE is unchanged in after hours trading. As soon as I saw the price pattern, I knew I needed to check if it was a falling wedge (bullish) or declining trend channel (bearish). It is a bearish declining trend channel (turns out I visualized it correctly as being bearish. Since this is short, we have to determine how much upside we will give it. The "stop" or "limit" is 9.5% which is definitely on the high side. Ultimately what I'd look for is a breakout from the declining trend. If that were to happen I would leave a bearish position. The RSI is falling and entered oversold territory.The PMO is considering a crossover SELL signal. Stochastics have dropped below 20 and are still falling. The group is underperforming the SPY and ASTE is performing in line with a bearish industry group and SPY."
Here is today's chart:
For a short position, this one went the wrong way. However, it didn't manage to break from its declining trend and the RSI topped in negative territory. The PMO is rising and that is the biggest issue for me. We can even see a slight improvement in relative strength since Tuesday. This is the only position that I do not like going forward from this week's "Diamonds in the Rough".
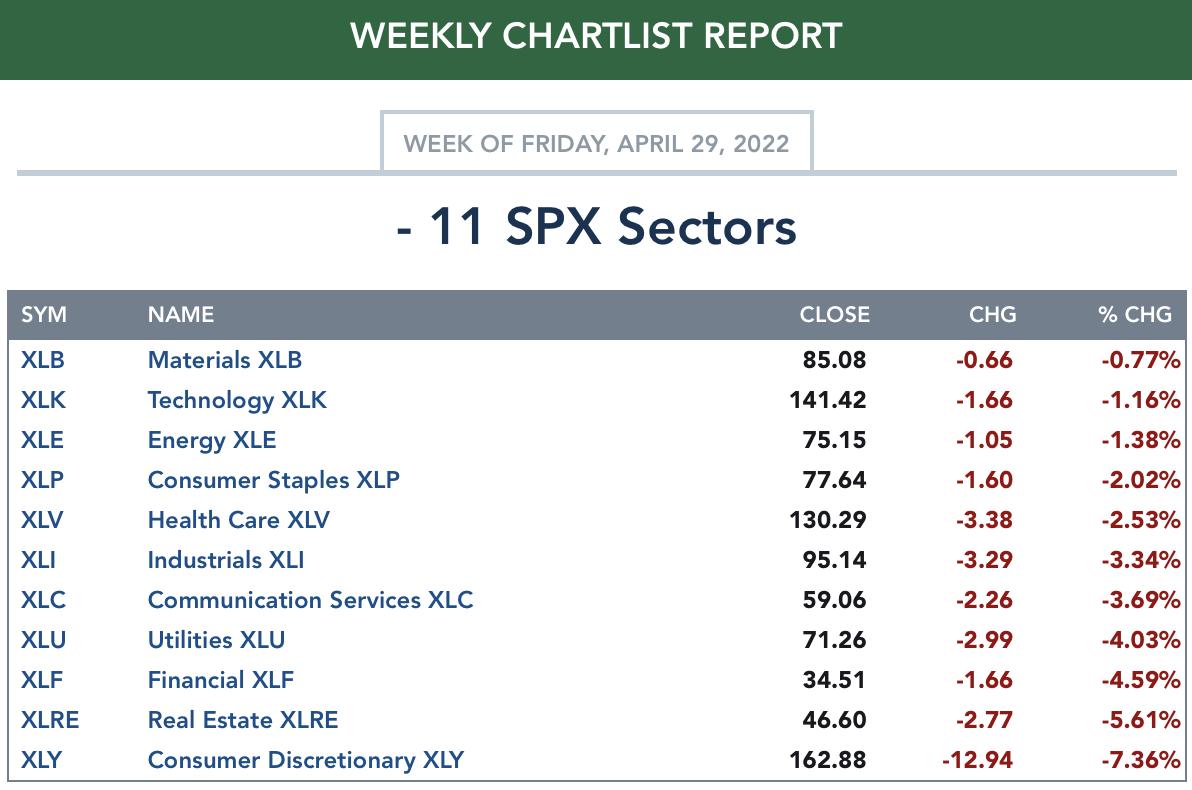
TODAY'S Sector Performance:
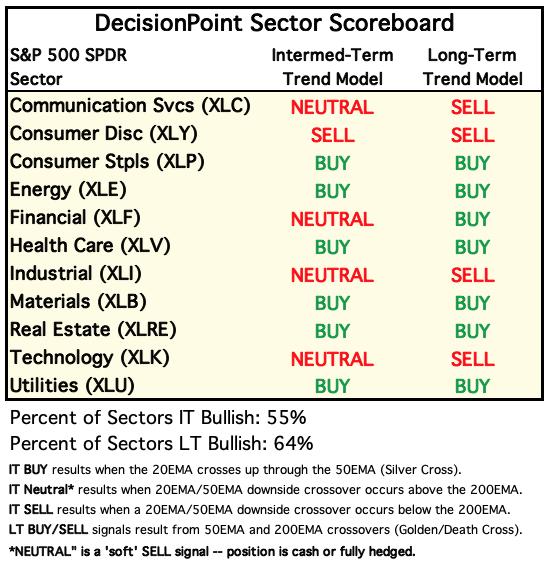
DecisionPoint Sector Scoreboard (Mechanical Trend Model Signals):
Click Here to view Carl's annotated Sector ChartList!
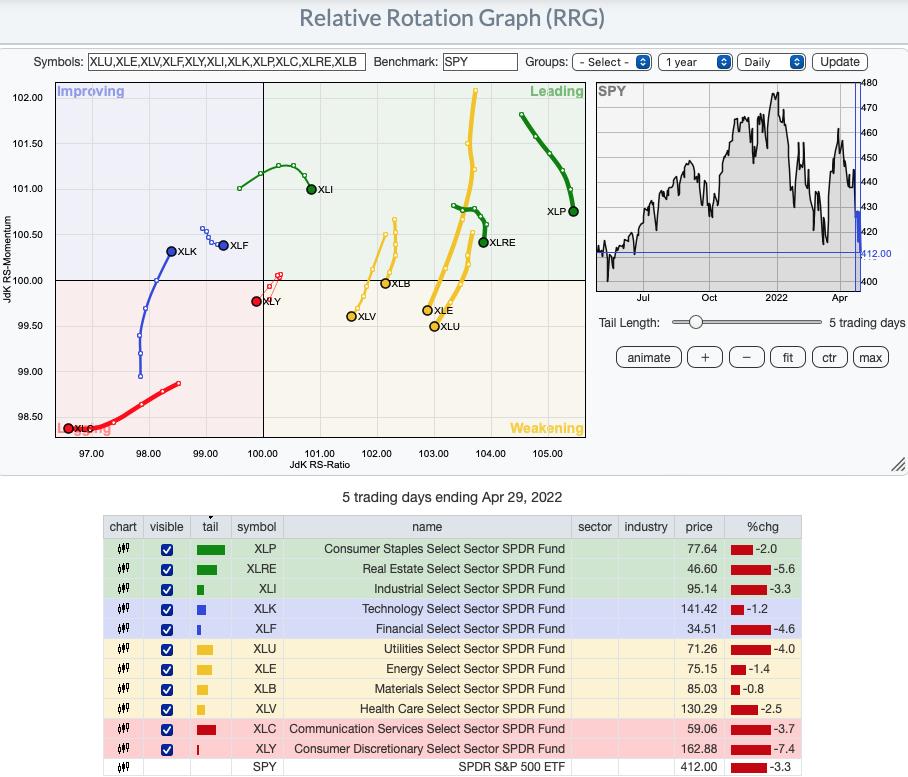
Short-term (Daily) RRG:
One might be shocked, but Technology (XLK) has the most bullish configuration. It is in the Improving quadrant and has a strong bullish northeast heading. This area of the market is still very weak in our estimation and should still be avoided despite its placement on the RRG.
Financials (XLF) is also in the Improving quadrant and is headed toward Leading. This is another sector that is still very weak overall.
The most bearish are Communication Services (XLC)--no surprise here. The other is Consumer Discretionary (XLY) which just entered the Lagging quadrant, bypassing Improving. It is situated the closest to the center point. The center point is the SPY and the sectors rotate based on their relative strength against the SPY. XLY not only has a bearish southwest heading, it is performing in line with the SPY which is in a bear market.
The Leading quadrant sectors, Industrials (XLI), Real Estate (XLRE) and Consumer Staples (XLP) all are moving toward the Weakening quadrant.
All others are in the Weakening quadrant. Healthcare (XLV), Materials (XLB), Energy (XLE) and Utilities (XLU) all have bearish southwest headings.
None of the sectors have healthy participation and none of them have rising momentum so it should be no surprise that all of the sectors look weak.
Intermediate-Term (Weekly) RRG:
XLC continues to oscillate in a tight space within the Improving quadrant. It is far away from the Leading quadrant and we know how weak that sector continues to be.
XLF is the most bearish in the longer-term. It fell from the Leading quadrant and quickly made its way into Lagging.
XLY and XLK are also residents of the Lagging quadrant. They have a somewhat northward heading so they could find themselves in the Improving quadrant, but given what we know about weakness in those sectors, we aren't optimistic.
All sectors in the Leading quadrant with the exception of XLE are traveling further into the Leading quadrant. XLE could hit the Weakening quadrant next week given its southward heading.
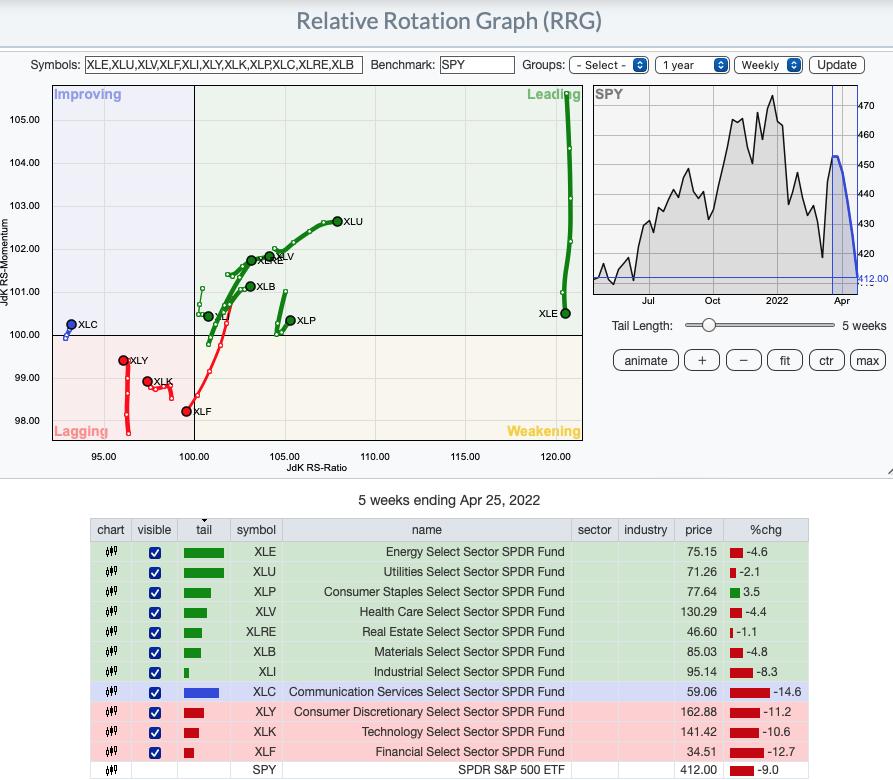
RRG® charts show you the relative strength and momentum for a group of stocks. Stocks with strong relative strength and momentum appear in the green Leading quadrant. As relative momentum fades, they typically move into the yellow Weakening quadrant. If relative strength then fades, they move into the red Lagging quadrant. Finally, when momentum starts to pick up again, they shift into the blue Improving quadrant.
CLICK HERE for an animated version of the RRG charts.
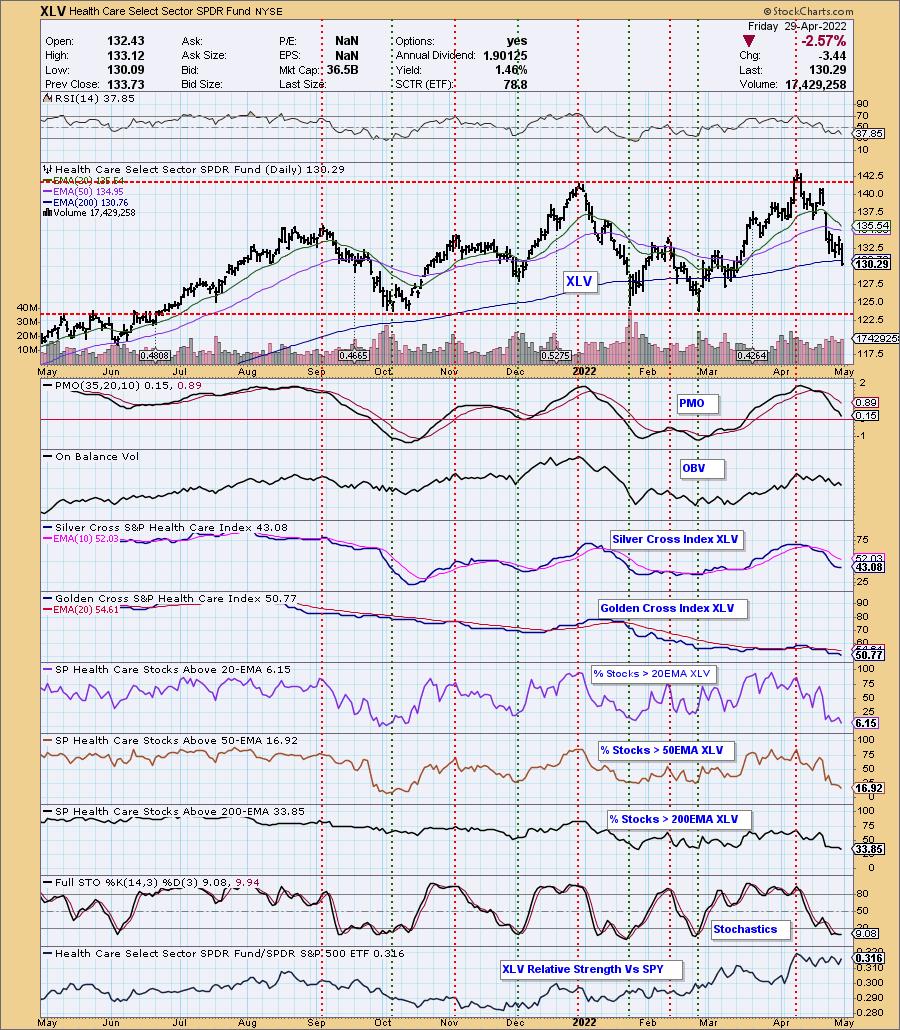
"Bearish" Sector to Watch: Healthcare (XLV)
Another reminder, ALL sectors have negative momentum so we are looking at one that has plenty of downside to cover. What drew me to this sector was today's close beneath the 200-day. The RSI is negative and not oversold. The PMO is accelerating downward and should reach negative territory soon. The OBV is confirming the decline. The Silver Cross Index (SCI) is flat which suggested possible improvement ahead, but given %Stocks > 20/50-EMAs are so much lower than the SCI, the bias in the short term is clearly bearish. Participation continues to thin, but could move even lower. Stochastics are still falling. Currently relative strength is in line with the SPY. That's fine while the SPY is in a bear market, but I would prefer to see declining relative strength on a short position.
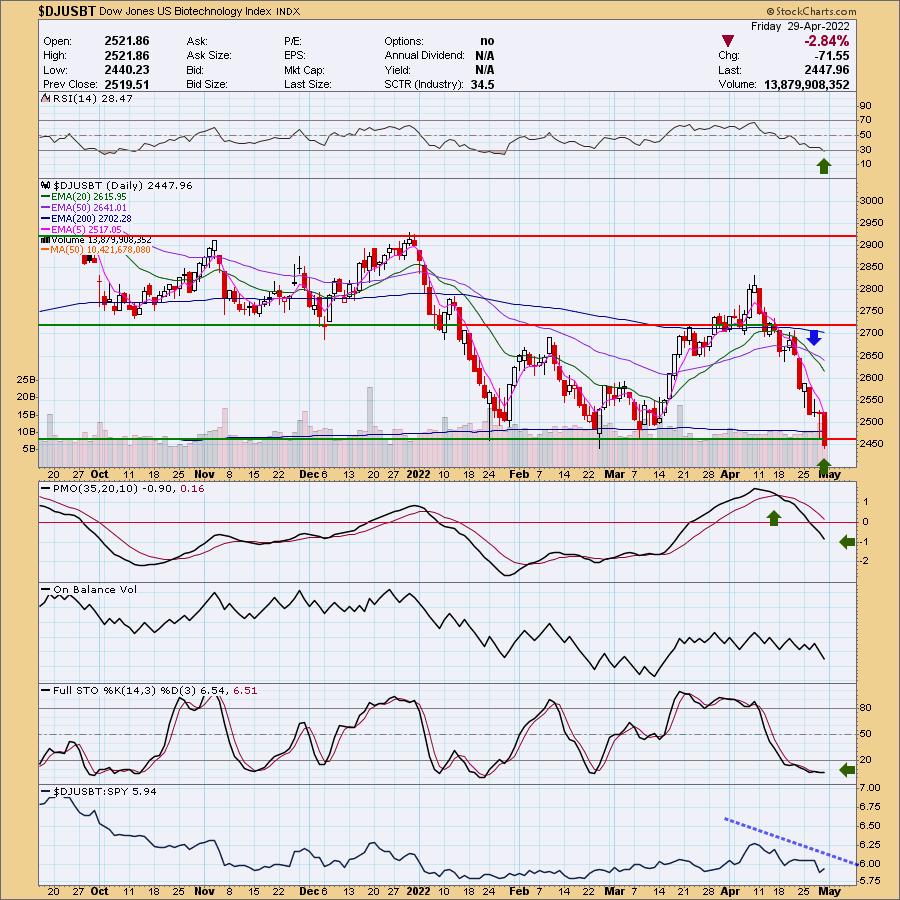
"Bearish" Industry Group to Watch: Biotechnology ($DJUSBT)
Within Healthcare, I saw this as the most bearish, but there are plenty more bearish groups within XLV. We highlighted LABD, the ultrashort 3x Biotech ETF. I like it moving forward, just remember to prepare for volatility. The chart bearish for several reasons. Primarily, we have a price breakdown below support. The PMO is on a SELL signal and falling. It is not oversold. The RSI is oversold, but it is falling. Stochastics hit the bottom of the range and flattened out. Relative performance is very negative.
Go to our Sector ChartList on DecisionPoint.com to get an in-depth view of all the sectors.
Good Luck & Good Trading!
- Erin
erin@decisionpoint.com
Full Disclosure: I'm 15% exposed to the market, but plan to add an inverse ETF or two, barring a bear market rally.
Watch the latest episode of DecisionPoint with Carl & Erin Swenlin on Mondays 7:00p EST or on the DecisionPoint playlist on the StockCharts TV YouTube channel here!
Technical Analysis is a windsock, not a crystal ball. --Carl Swenlin
NOTE: The stocks reported herein are from mechanical trading model scans that are based upon moving average relationships, momentum and volume. DecisionPoint analysis is then applied to get five selections from the scans. The selections given should prompt readers to do a chart review using their own analysis process. This letter is not a call for a specific action to buy, sell or short any of the stocks provided. There are NO sure things or guaranteed returns on the daily selection of "diamonds in the rough."
Helpful DecisionPoint Links:
DecisionPoint Shared ChartList and DecisionPoint Chart Gallery
Price Momentum Oscillator (PMO)
Swenlin Trading Oscillators (STO-B and STO-V)
(c) Copyright 2022 DecisionPoint.com