
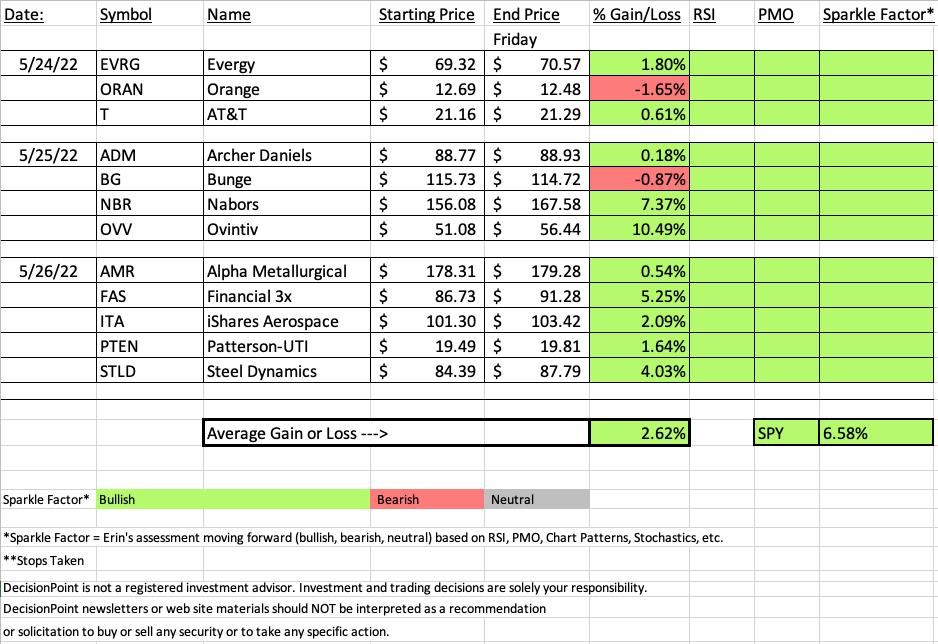
With the market rallying this week, "Diamonds in the Rough" did well. Of the 12 picks this week only 2 finished the week lower with this week's "Dud" only finishing down -1.65%. This week's "Darling" was up +10.49%. While the average on the week was lower than the SPY, as one subscriber said in the Diamond Mine trading room today, "Diamonds in the Rough" did have the entire week to rally. Eh, it proves to be an advantage when the market is doing poorly. It evens out. As long as we finish in the "green", I'm happy.
You'll notice that every one of this week's "Diamonds in the Rough" have rising PMOs and positive RSIs. I also determined that all of them still have potential moving forward. For the two that declined this week, you can now tighten the stop.
The link to today's Diamond Mine trading room is below as well as the registration link for next week's trading room.
Have a great THREE day weekend! See you in Tuesday's free trading room! Next Diamonds report will be on Tuesday, 5/31.
Erin

RECORDING LINK (5/20/2022):
Topic: DecisionPoint Diamond Mine 5/27/2022) LIVE Trading Room
Start Time: May 27, 2022 09:00 AM
Meeting Recording Link.
Access Passcode: MayDP#27
REGISTRATION FOR Friday 6/3 Diamond Mine:
When: Jun 3, 2022 09:00 AM Pacific Time (US and Canada)
Topic: DecisionPoint Diamond Mine (6/3/2022) LIVE Trading Room
Register in advance for this webinar HERE.
Save the registration confirmation email with login instructions in case Zoom doesn't notify you in time.

Free DP Trading Room (5/23/2022) RECORDING LINK:
Topic: DecisionPoint Trading Room
Start Time: May 23, 2022 09:00 AM
Meeting Recording Link.
Access Passcode: MayDP@23
For best results, copy and paste the access code to avoid typos.
A few items about the spreadsheet: I've put on the spreadsheet whether the RSI is positive (green) or negative (red). The PMO column tells you if it is rising (green) or falling (red). Finally I've added my own "Sparkle Factor" that gives you my assessment going forward, bullish (green), bearish (red) or neutral (gray). The Sparkle Factor is basically my thoughts on whether I expect it to rise or fall. A neutral means it could really go either way so it could be added to a watch list. If you're in a stock I consider "neutral" going forward, the ball is in your court.
Darling:
Ovintiv Inc (OVV)
EARNINGS: 7/27/2022 (AMC)
Ovintiv, Inc. engages in the production and development of oil, natural gas liquids and natural gas producing plays. The firm operates through the following segments: Canadian Operations, USA Operations and Market Optimization. The Canadian Operations segment includes the exploration for, development of, and production of oil, NGLs, natural gas and other related activities within Canada. The USA Operations segment includes the exploration for, development of, and production of oil, NGLs, natural gas and other related activities within the United States. The Market Optimization segment's activities are managed by the Midstream, Marketing & Fundamentals team, which is responsible for the sale of the company's proprietary production to third party customers. The company was founded in 1881 and is headquartered in Denver, CO.
Predefined Scans Triggered: Moved Above Ichimoku Cloud, Parabolic SAR Buy Signals and P&F Double Top Breakout.
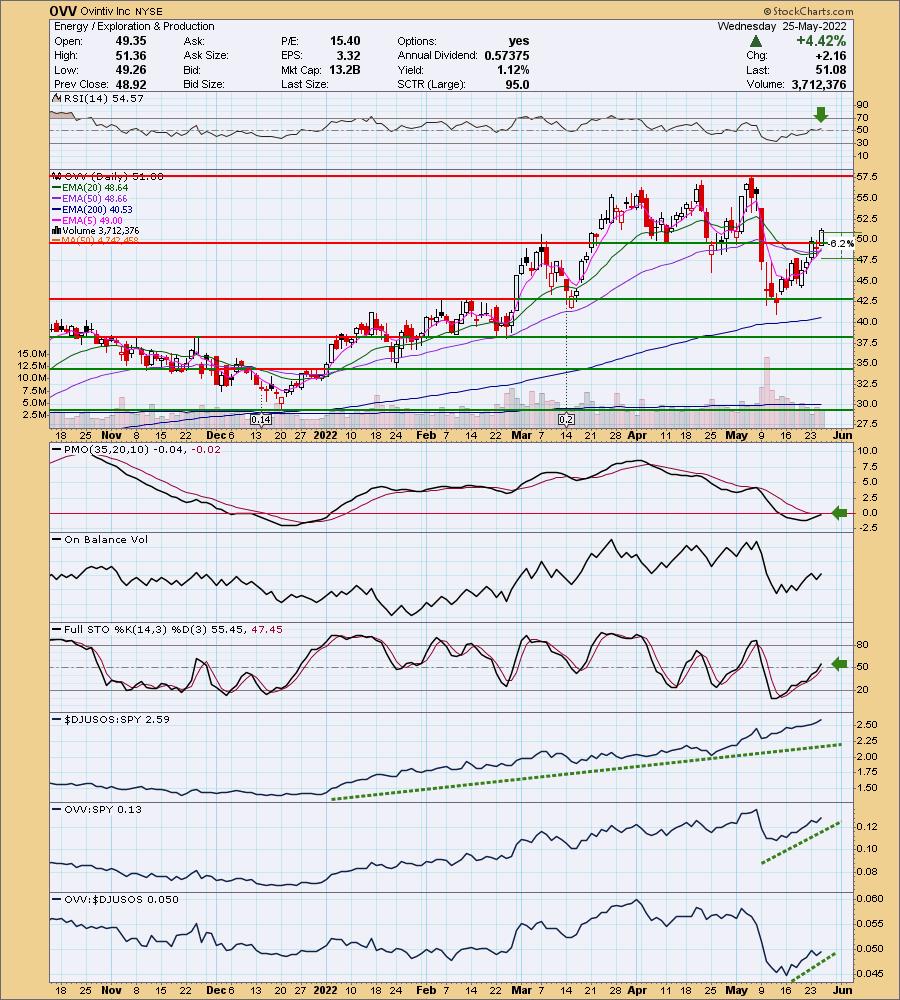
Below are the commentary and chart from Wednesday (5/25/2022):
"OVV is up +0.76% in after hours trading. Here is another beat down Energy stock that is reversing. Price broke above strong resistance today. The RSI is positive and rising. The PMO is nearing a crossover BUY signal. Stochastics are rising and relative strength is positive across the board.The stop can be set thinly below the key moving averages. I opted to put it below the April closing low."
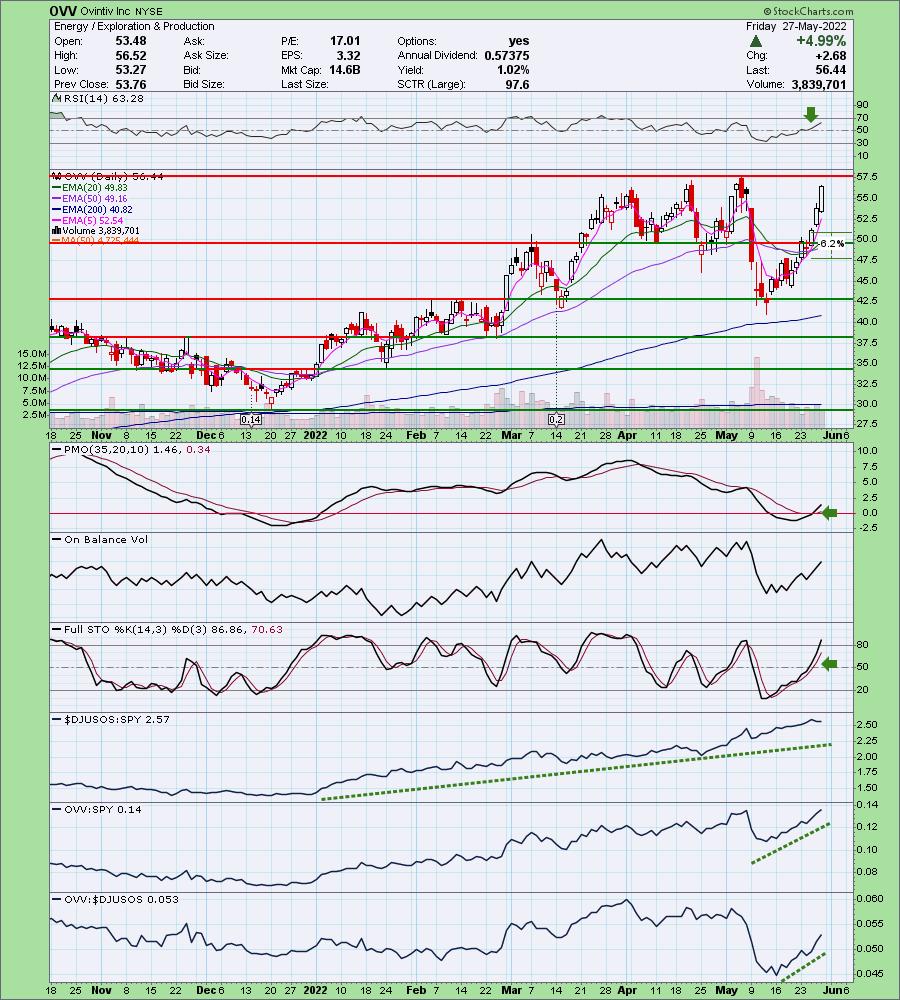
Here is today's chart:
I figured this one would do well given Crude Oil was on the verge of a breakout. Admittedly I didn't expect this reaction. It is getting close to the overhead resistance, but the indicators are still strong and I do believe Crude will be moving higher. I like all of the industry groups associated with Crude Oil right now, in particular, Integrated Oil & Gas, Exploration & Production as well as Pipelines and Oil Equipment Services. There are some excellent selections within those groups.
Don't forget, on Thursdays I look at reader-requested symbols, so shoot me an email at erin@decisionpoint.com. I read every email I receive and try to answer them all!
Dud:
Orange (ORAN)
EARNINGS: 7/28/2022 (BMO)
Orange SA engages as a telecommunication services company, which operates mobile and internet services. It provides telecommunication services to multinational companies, under the brand Orange Business Services. The company was founded in 1794 and is headquartered in Paris, France.
Predefined Scans Triggered: Moved Above Upper Keltner Channel, New 52-week Highs, Moved Above Upper Bollinger Band, P&F Ascending Triple Top Breakout and P&F Double Top Breakout.
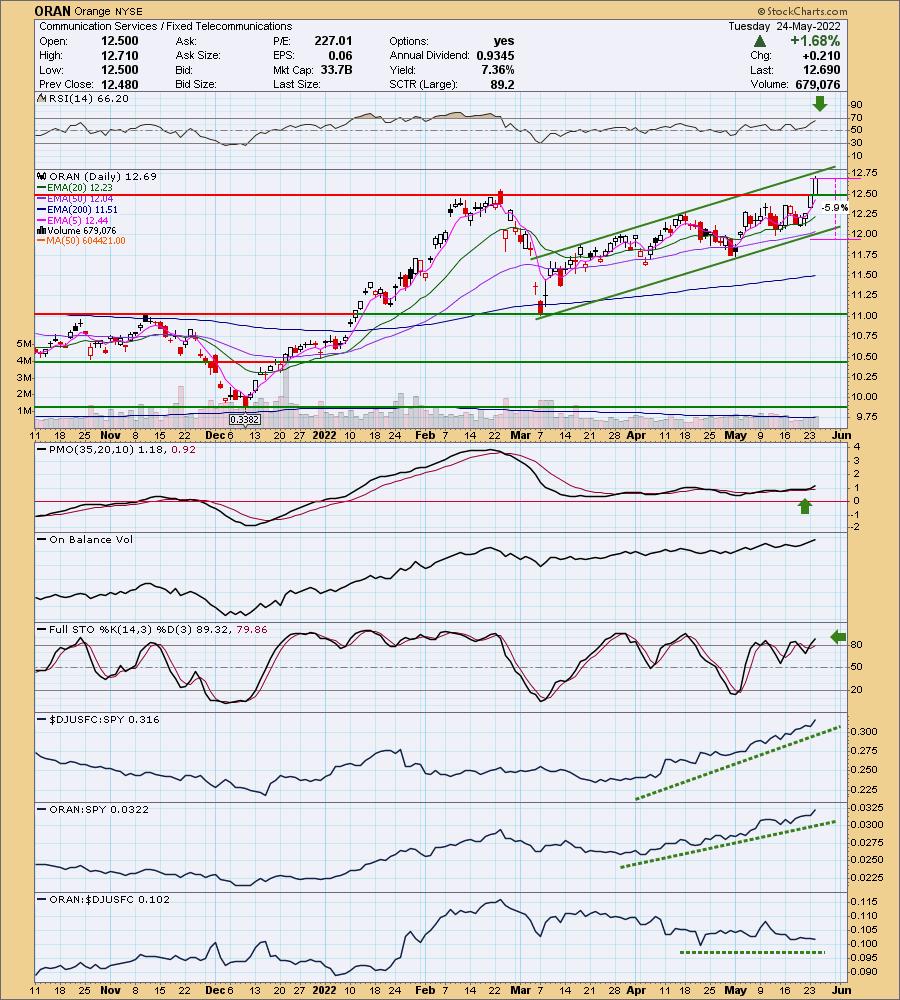
Below are the commentary and chart from Tuesday (5/24):
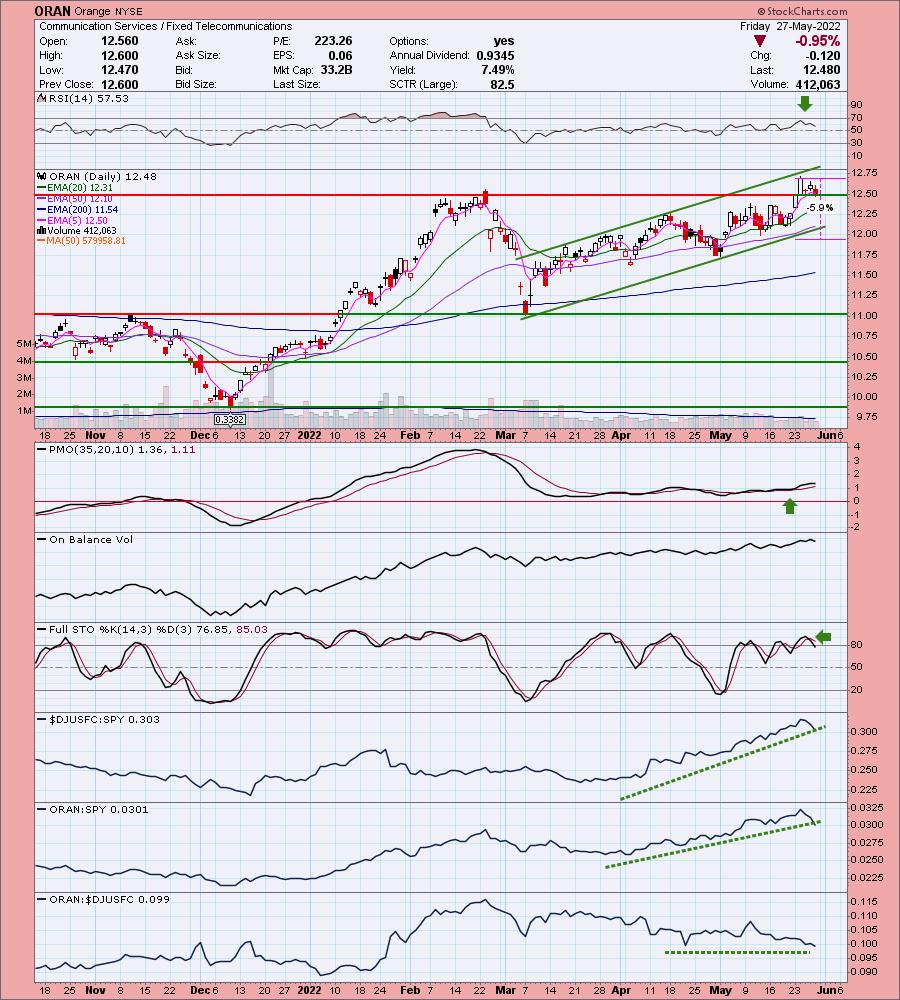
"ORAN is unchanged in after hours trading. ORAN broke out above overhead resistance at the February high. It is in a nice rising trend channel that suggest price will move even higher. The RSI is positive and the PMO is accelerating higher. Stochastics are above 80 and have been oscillating in positive territory all month. We see how well the industry group is performing and ORAN, while not a great performer within its group is doing very well against the SPY. The stop can be set thinly below the 50-day EMA which would imply a breakdown of the rising trend."
Here is today's chart:
Considering this is the "Dud", it still looks pretty good. It is holding support. The indicators are still positive with the exception of Stochastics which have fallen below 80. I still think this one has promise if it can hold support. The stop is thin and can be even thinner now so I think it still has merit.
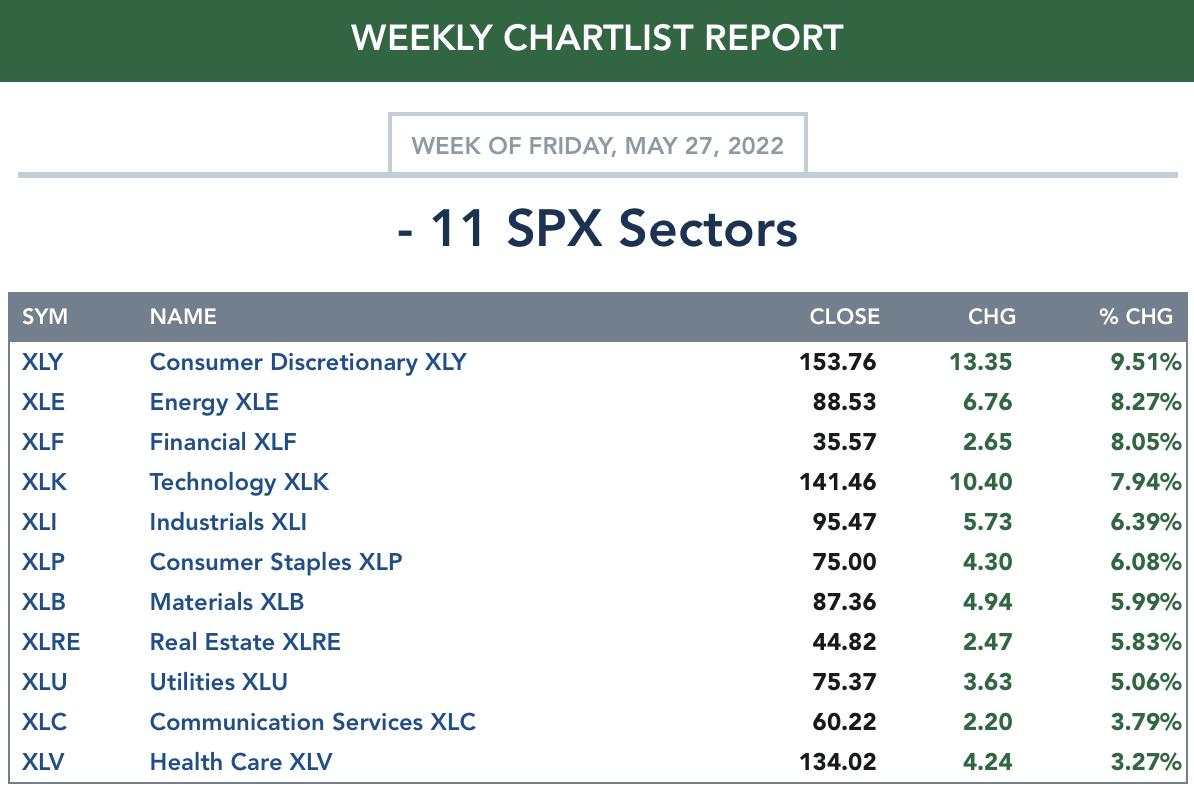
TODAY'S Sector Performance:
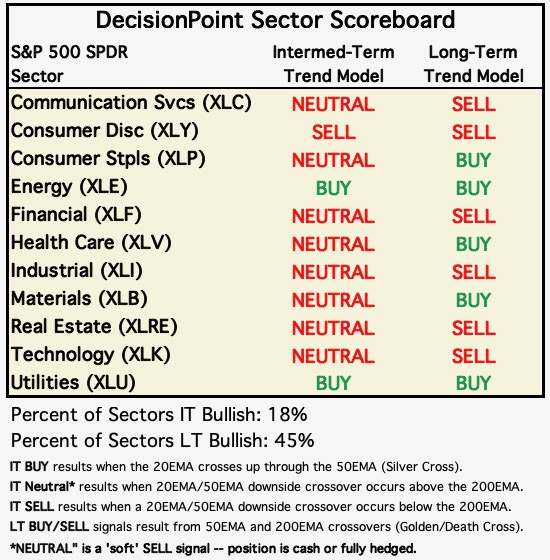
DecisionPoint Sector Scoreboard (Mechanical Trend Model Signals):
Click Here to view Carl's annotated Sector ChartList!
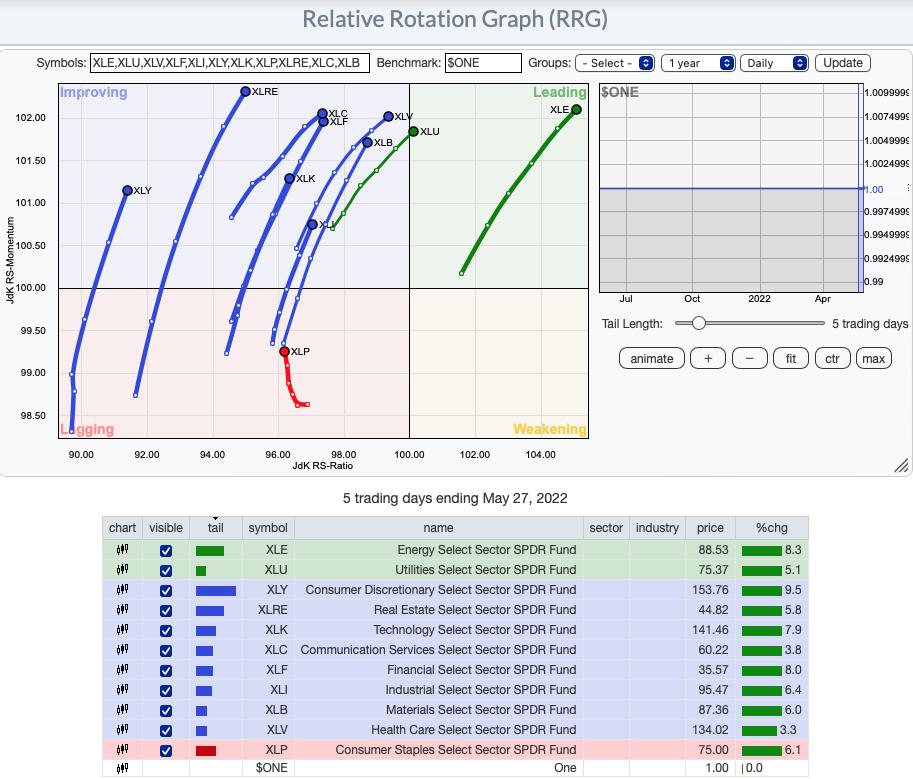
RRG® Daily Chart ($ONE Benchmark):
The Daily RRG this week shows new strength across the board for all sectors. XLP is the weakest as it catches up from the Target decline. It is still traveling northward toward the Improving quadrant. XLU has just entered the Leading quadrant to join the clear relative strength winner, XLE.
RRG® Weekly Chart ($ONE Benchmark):
On the other hand, the weekly RRG suggests that prior weakness hasn't been cleared. In the intermediate term, most sectors have bearish southwest headings with only XLE holding a bullish northeast heading.
XLB and XLU are still the Leading quadrant, but their southward heading could put them into the Weakening quadrant soon. However, knowing the sector charts as I do, both look very bullish right now.
XLP has a northward component to its heading that could bring it into the Leading quadrant. XLV looks very weak and will likely move into the Lagging quadrant.
All others are sitting in the Lagging quadrant with bearish southwest headings. The damage is still there. This week's short-term rally did improve the outlook for many sectors, but we aren't confident that the rally will continue much longer.
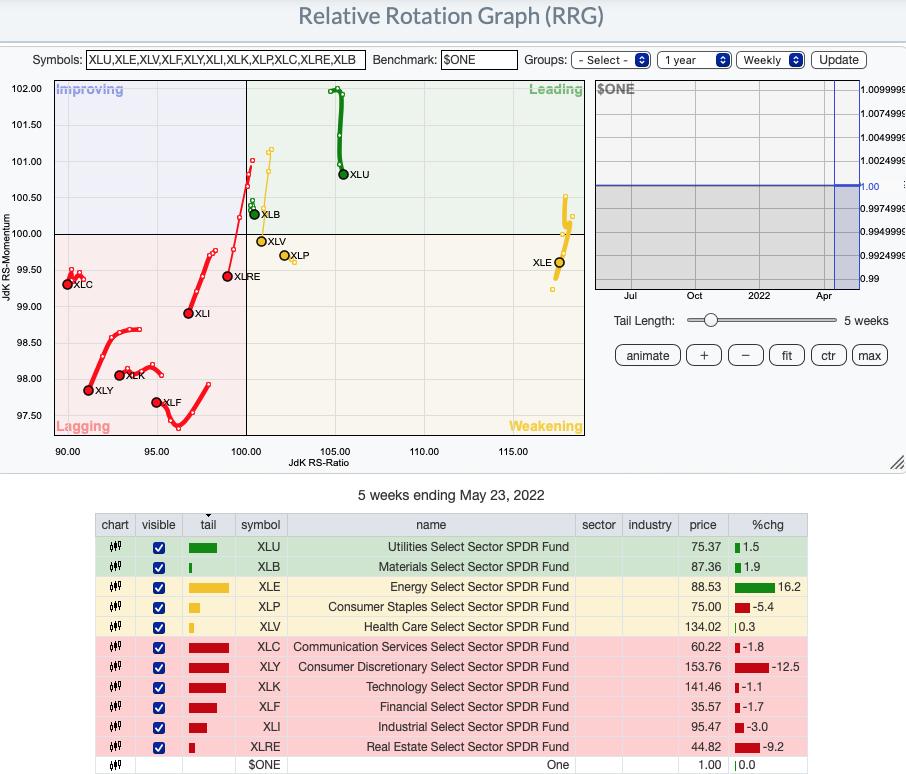
RRG® charts show you the relative strength and momentum for a group of stocks. Stocks with strong relative strength and momentum appear in the green Leading quadrant. As relative momentum fades, they typically move into the yellow Weakening quadrant. If relative strength then fades, they move into the red Lagging quadrant. Finally, when momentum starts to pick up again, they shift into the blue Improving quadrant.
CLICK HERE for an animated version of the RRG charts.
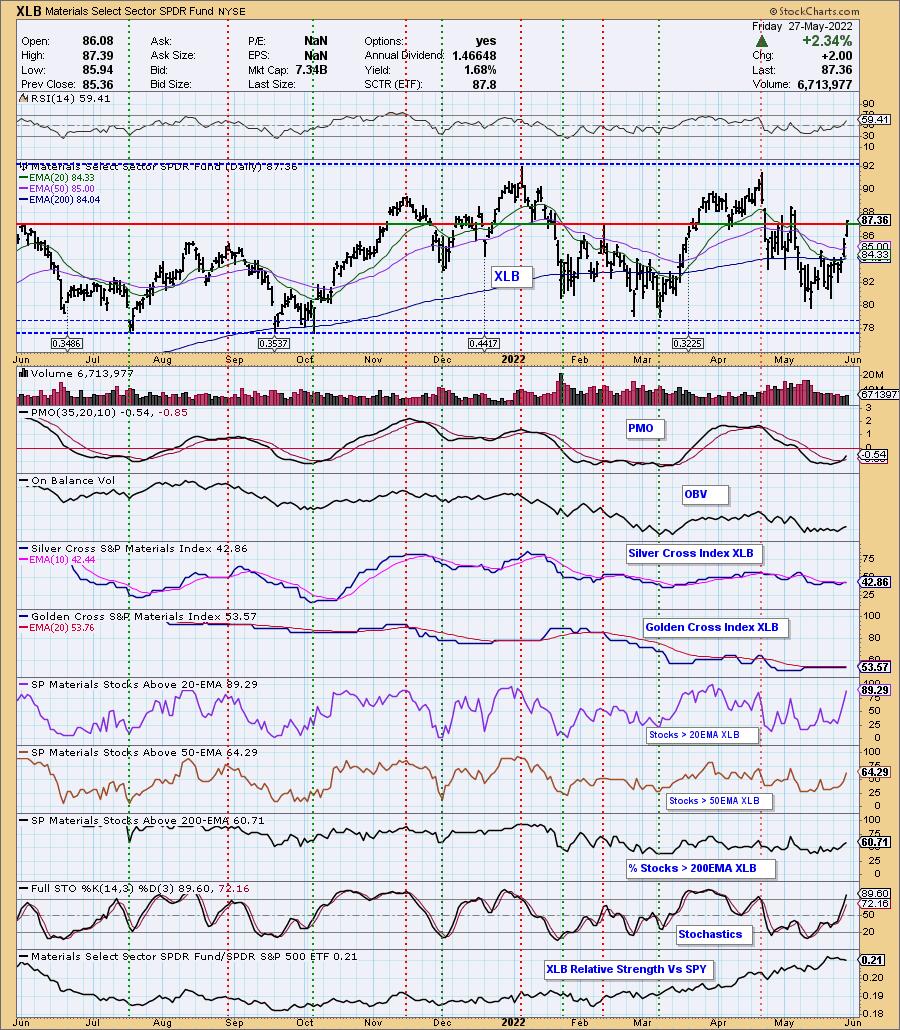
Sector to Watch: Materials (XLB)
Honestly, this week I could have picked many sectors given their breakouts. It came down to XLF, XLV, XLU and XLB. Since the Industry Group to Watch is in Materials, I'll go with Materials. Today's rally pushed price above the February high and April low as well as gap resistance at the end of November. The PMO had a positive crossover this week and the RSI is rising and positive. One of the tiebreakers was participation. This sector already has strong participation and it is now beginning to get stronger. We have a "bull stack" on %Stocks > 20/50/200-EMAs. A "bull stack" is where the percentages get a little bit lower as you move down from %Stocks > 20-day EMA to > 50-day EMA to > 200-day EMA. The first thing sign of strength will be a "bull stack". Additionally, the SCI just had a positive crossover and the GCI is mostly flat, not declining.
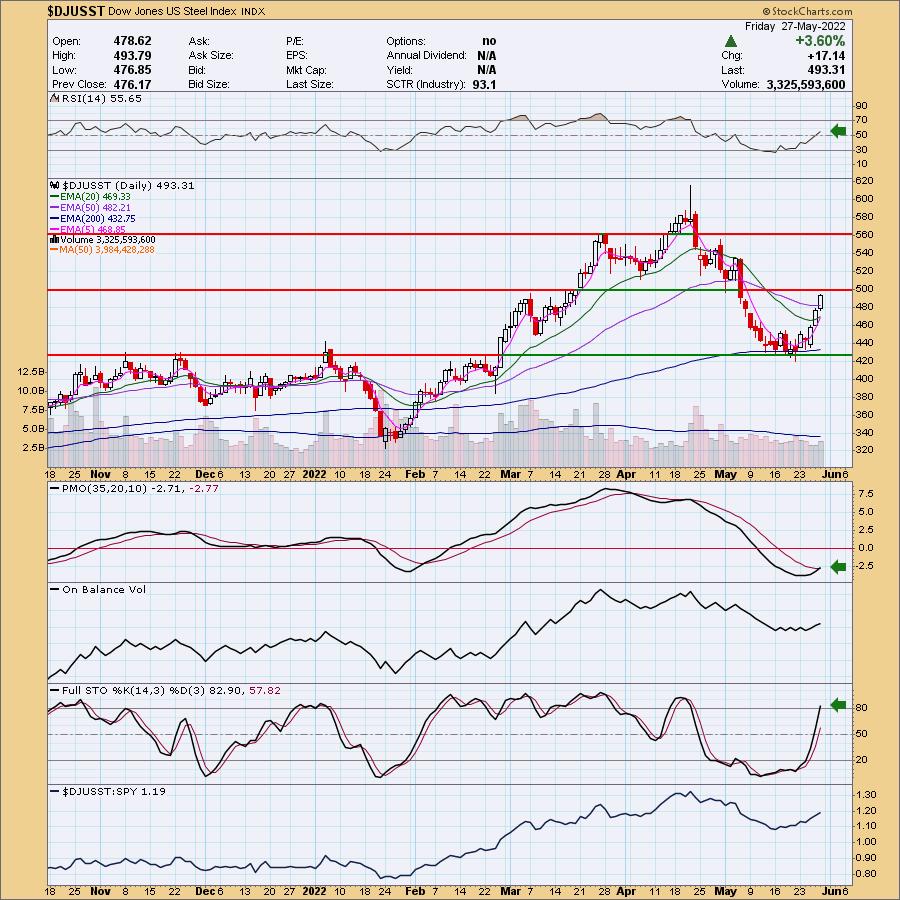
Industry Group to Watch: Steel ($DJUSST)
I love how this industry group is improving. First, the 50-day EMA is well above the 200-day EMA so this group is in a bull market configuration. The RSI just turned positive and the PMO triggered a crossover BUY signal today. Stochastics are rising almost vertically. My one concern is that price is coming up against overhead resistance right now. Some of the symbols we looked at in the Diamond Mine were STLD (one of this week's "Diamonds in the Rough"), RS and CLF. Last week's industry group to watch, Fixed Telecom shined. Let's see if this group does the same next week.
Go to our Sector ChartList on DecisionPoint.com to get an in-depth view of all the sectors.
Good Luck & Good Trading!
- Erin
erin@decisionpoint.com
Full Disclosure: I'm 25% exposed to the market with 15% on the short side.
Watch the latest episode of DecisionPoint with Carl & Erin Swenlin on Mondays 7:00p EST or on the DecisionPoint playlist on the StockCharts TV YouTube channel here!
Technical Analysis is a windsock, not a crystal ball. --Carl Swenlin
NOTE: The stocks reported herein are from mechanical trading model scans that are based upon moving average relationships, momentum and volume. DecisionPoint analysis is then applied to get five selections from the scans. The selections given should prompt readers to do a chart review using their own analysis process. This letter is not a call for a specific action to buy, sell or short any of the stocks provided. There are NO sure things or guaranteed returns on the daily selection of "diamonds in the rough."
Helpful DecisionPoint Links:
DecisionPoint Shared ChartList and DecisionPoint Chart Gallery
Price Momentum Oscillator (PMO)
Swenlin Trading Oscillators (STO-B and STO-V)
(c) Copyright 2022 DecisionPoint.com