
Reader requests were all over the place as far as industry groups and even sectors. I narrowed down the selections to what I believe are "Diamonds in the Rough". The market is rebounding off positive divergences with the SPY garnering a PMO BUY signal today. It appears a bear market rally is beginning. However, we need to be careful as we do not believe this is over by a long shot.
Don't forget to register for tomorrow's Diamond Mine trading room! The link is below.
I'll keep this brief as I need to get the DP Alert out before its time to go to the airport for my flight home. There really is no place like home. I can't wait to see John who left Seattle Tuesday and my sweet dogs!
Good Luck & Good Trading,
Erin
Today's "Diamonds in the Rough": AMR, FAS, ITA, PTEN and STLD.

RECORDING LINK (5/20/2022):
Topic: DecisionPoint Diamond Mine (5/20/2022) LIVE Trading Room
Start Time: May 20, 2022 09:00 AM
MeetingRecording Link.
Access Passcode: May#the20th
REGISTRATION FOR Friday 5/27 Diamond Mine:
When: May 27, 2022 09:00 AM Pacific Time (US and Canada)
Topic: DecisionPoint Diamond Mine 5/27/2022) LIVE Trading Room
Register in advance for this webinar HERE.
** Save the registration confirmation email with login instructions in case Zoom doesn't notify you in time.**

Free DP Trading Room (5/23) RECORDING LINK:
Topic: DecisionPoint Trading Room
Start Time: May 23, 2022 09:00 AM
Meeting Recording Link.
Access Passcode: MayDP@23
For best results, copy and paste the access code to avoid typos.
Welcome to DecisionPoint Daily Diamonds, wherein I highlight ten "Diamonds in the Rough" per week. These are selected from the results of my DecisionPoint Scans, which search for stocks that could benefit from the trend and condition of the market. Remember, these are not recommendations to buy or sell, but are the most interesting of the stocks that surfaced in my scans. My objective is to save you the work of the initial, tedious culling process, but you need to apply your own analysis to see if these stocks pique your interest as well. There are no guaranteed winners here!
"Predefined Scans Triggered" are taken from StockCharts.com using the "Symbol Summary" option instead of a "SharpChart" on the workbench.
Alpha Metallurgical Resources, Inc. (AMR)
EARNINGS: 8/5/2022 (BMO)
Alpha Metallurgical Resources, Inc. is a mining company. It engages in the provision of met and thermal coal. The firm operates through the following business segments: Met, CAPP-Thermal, and All Other. The Met segment consists of met coal mines, including Deep Mine 41, Road Fork 52, Black Eagle, and Lynn Branch. The CAPP-Thermal segment consists of underground thermal coal mine. The All Other segment includes general corporate overhead and corporate assets and liabilities, elimination of intersegment activity, and discontinued operations. The company was founded on June 26, 2016 and is headquartered in Bristol, TN.
Predefined Scans Triggered: New 52-week Highs, Moved Above Upper Bollinger Band, Stocks in a New Uptrend (Aroon), P&F Ascending Triple Top Breakout and P&F Double Top Breakout.
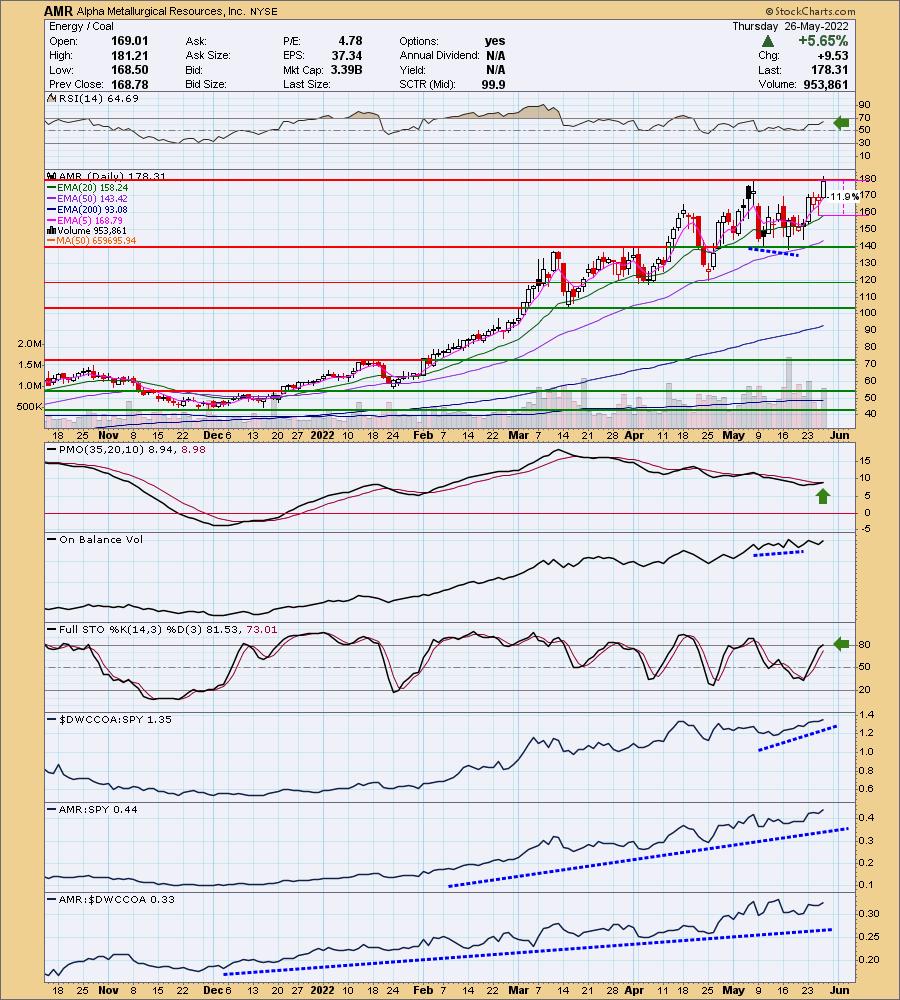
AMR is up +1.51% in after hours trading. Price closed at a new all-time high today and is about to breakout above resistance at this month's high. The RSI is positive and not overbought. The PMO is just about ready to trigger a crossover BUY signal. There was a positive OBV divergence leading into this rally. Typically that means the rally will stick around. Stochastics are rising and relative strength studies are bullish. The stop is very deep, but you could tighten that up. The problem is today's gain was +5.65%.
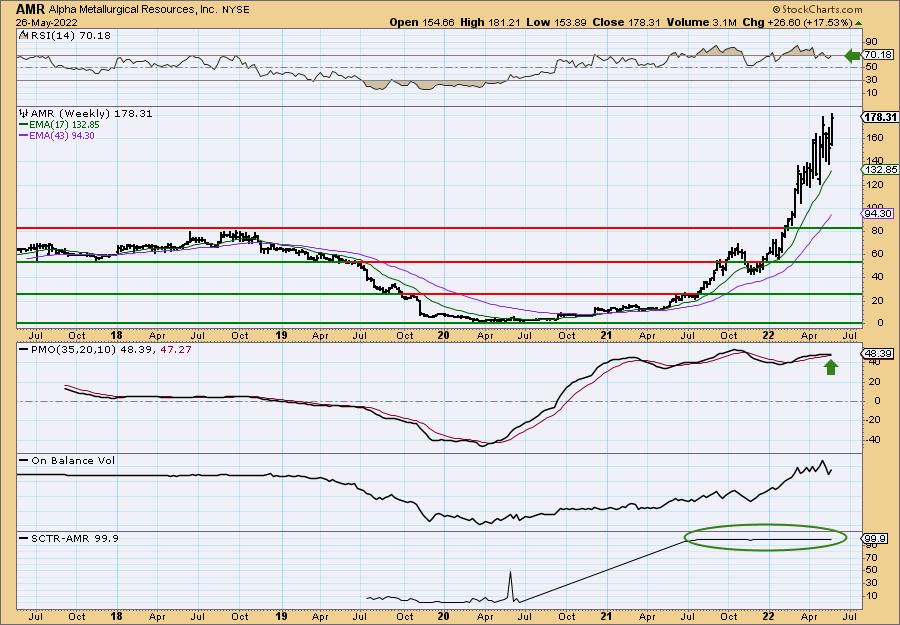
AMR is on a steep rising trend, but it is being confirmed by the OBV. The weekly PMO is nearing a SELL signal, but has so far avoided it. If price continues higher, it will too. The SCTR is excellent. This one has been the cream of the crop among mid-cap stocks. Since it is at all-time highs, consider an 18% upside target at $210.41.
Direxion Daily Financial Bull 3x Shares (FAS)
EARNINGS: N/A
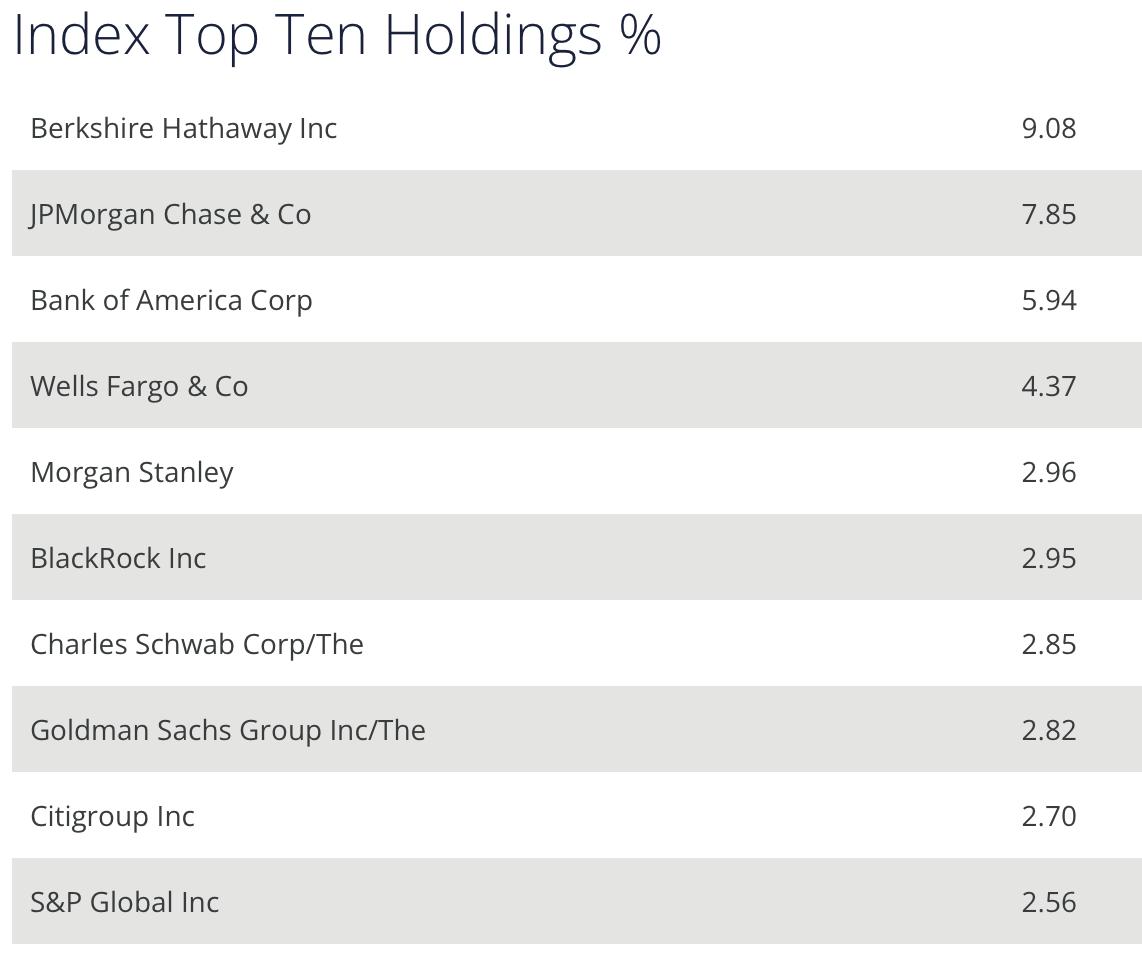
FAS provides 3x leveraged exposure to a market-cap-weighted index of US large-cap financial companies.
Predefined Scans Triggered: P&F Double Top Breakout and P&F Triple Top Breakout.
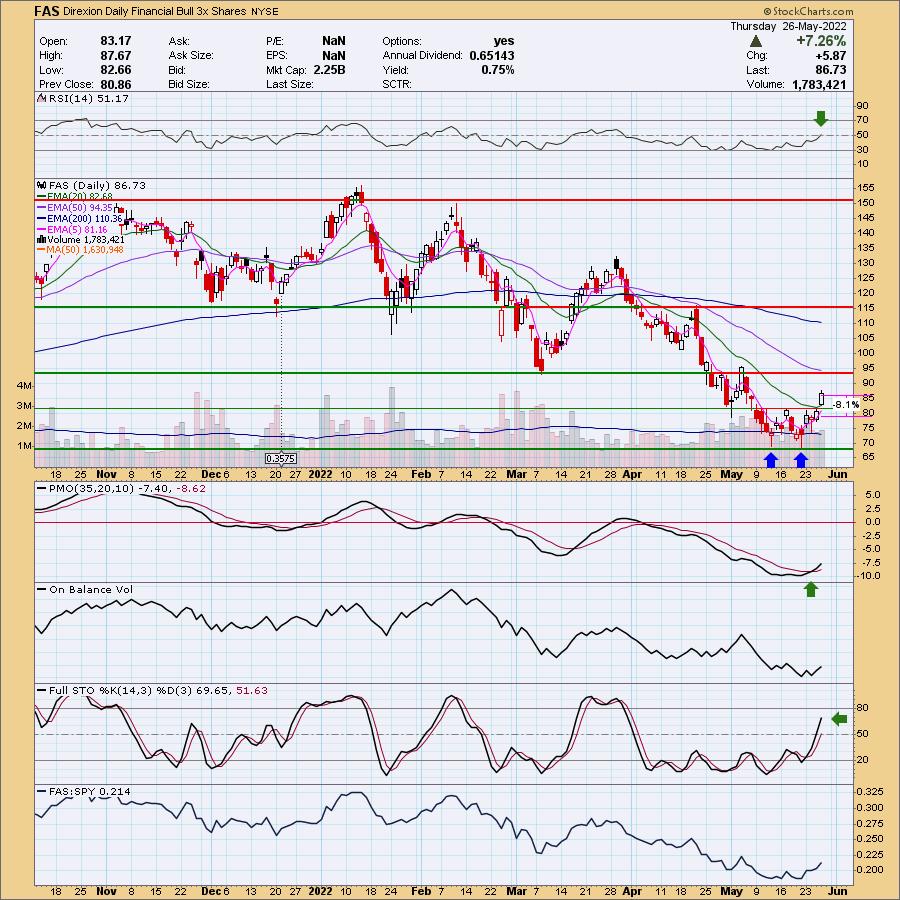
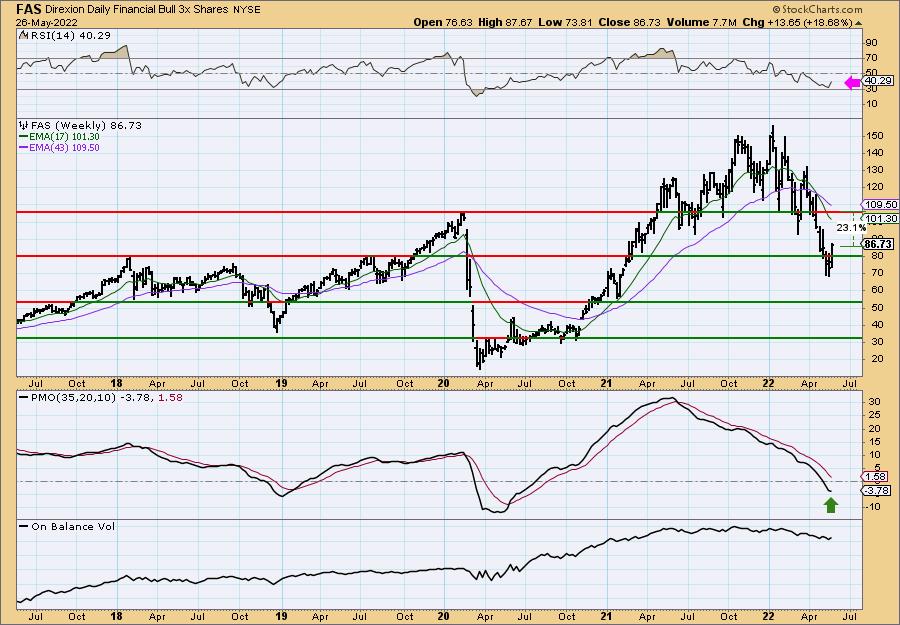
FAS is down -0.32% in after hours trading. This is an "ultra" ETF that trades 3x the Financial sector. If you're not interested in an ultra ETF, in this case, XLF would work fine for you. We have a bullish double-bottom that was confirmed with today's strong breakout. The minimum upside target of the pattern would bring it right up to resistance at about $95. This is a reversal trade and an ultra ETF as well. Be careful here as bear market rules still apply. The RSI has just entered positive territory and the PMO has already triggered a crossover BUY signal (XLF had a PMO BUY signal two days ago). Stochastics are rising strongly in positive territory. The stop is actually pretty thin for an ultra ETF, but my feeling is, if price drops below the confirmation line of the double-bottom (which implies a drop below the 20-day EMA), it is likely time to get out of this ETF.
This week's breakout above resistance at 2018 highs is pretty impressive, but there is still lots of work to do on the weekly chart. The RSI is rising but is in negative territory. The PMO has flattened, but hasn't risen yet. Currently the weekly OBV is confirming the declining trend. If we do see a rally, a move to the 2020 top is where I'd set my upside target.
iShares U.S. Aerospace & Defense ETF (ITA)
EARNINGS: N/A
ITA tracks a market-cap-weighted index of US manufacturers, assemblers and distributors of airplane and defense equipment.
Predefined Scans Triggered: Parabolic SAR Buy Signals and P&F Double Top Breakout.
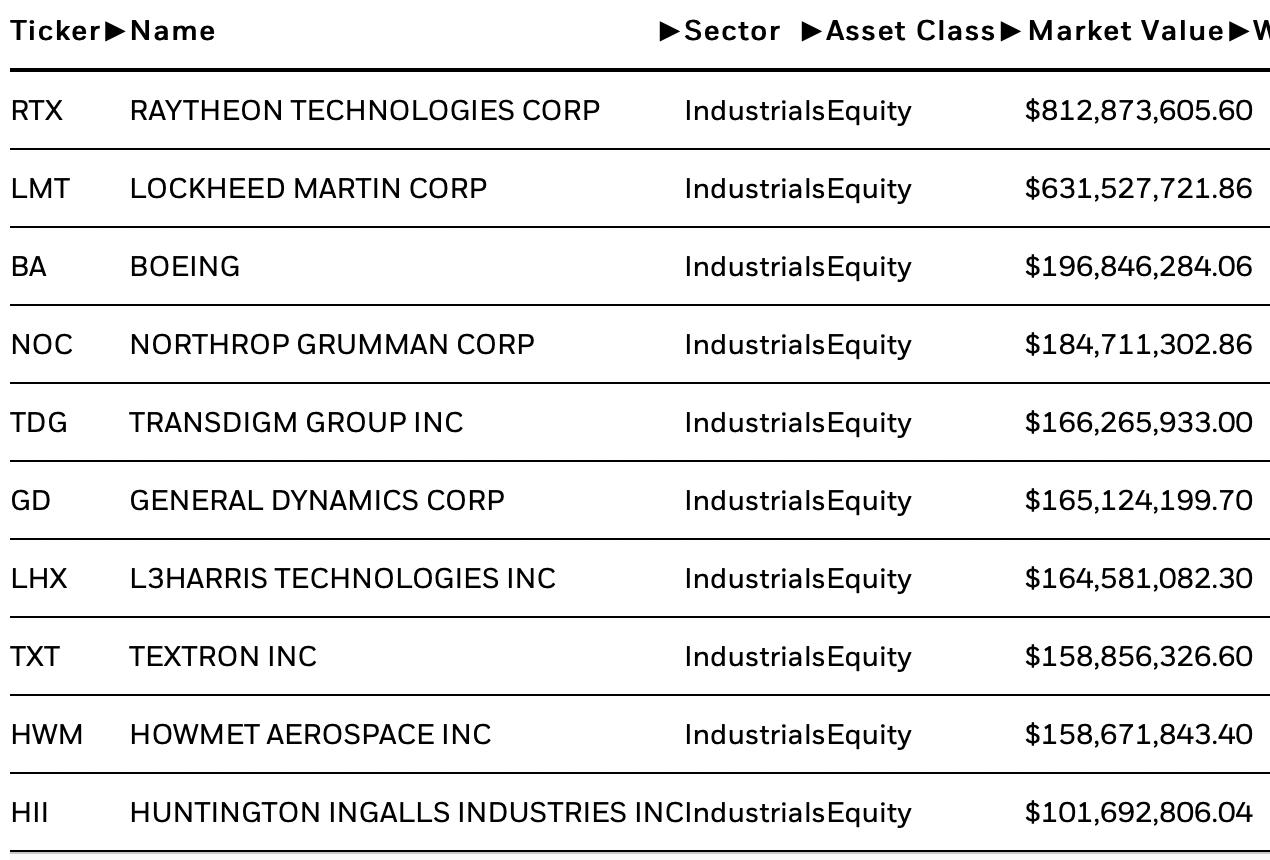
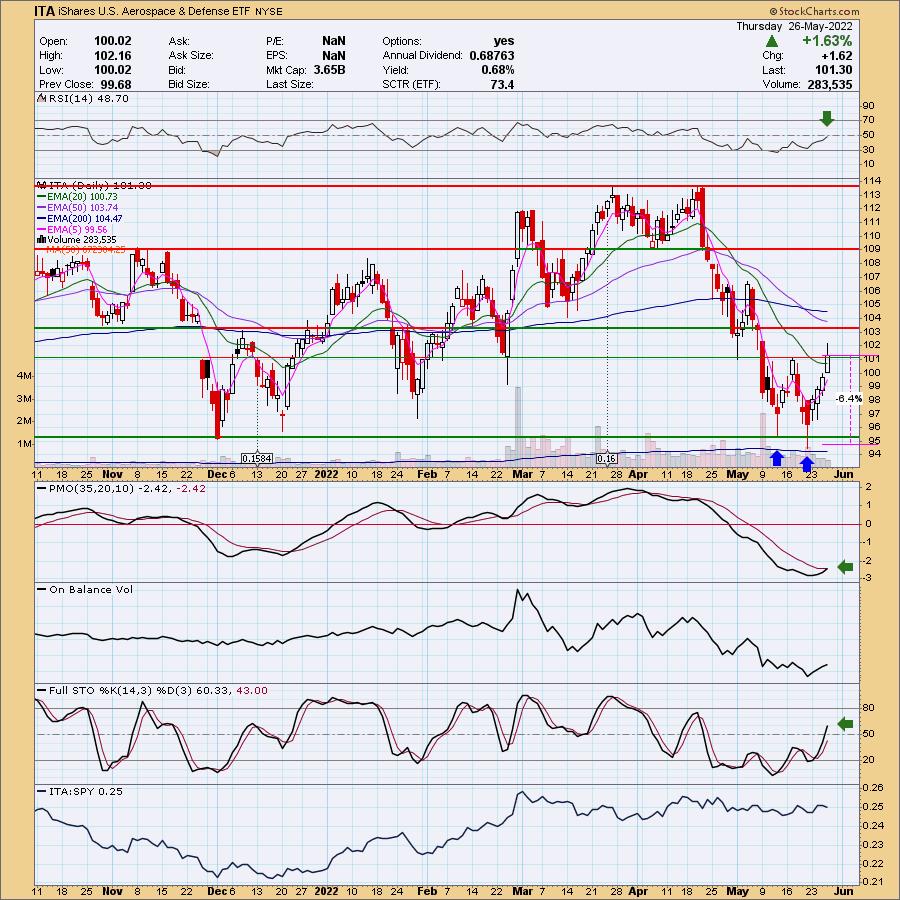
ITA is unchanged in after hours trading. This request came from Twitter (@_decisionpoint). I actually was eyeing a few stocks in this industry group. Right now I particularly like Raytheon (RTX). There is a bullish double-bottom on price. It was almost confirmed today, but price eventually closed below the confirmation line. The upside target of the pattern, if confirmed, would be near the January/February tops. The RSI is about to move into positive territory. The PMO is in the process of crossing the signal line for a BUY signal. Stochastics are rising in positive territory. Relative strength isn't much to look at, but obviously a continuation of this rally will likely fix it. The stop is set below the double-bottom pattern.
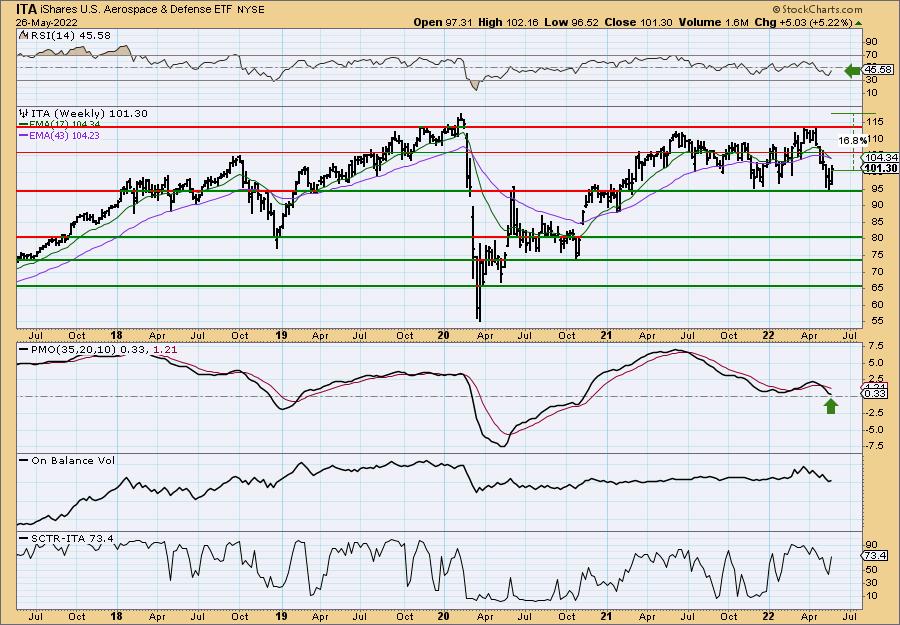
This bounce is coming at an opportune time, off support at the after bear market tops in 2020 as well as the late 2021 low. The weekly RSI is negative, but it is rising. The weekly PMO is falling, but beginning to decelerate as it nears the zero line and overbought territory. The SCTR took a dive on the decline, but it is beginning to recuperate, putting ITA in the top 28% of ETFs as far as internal strength. If it can reach prior all-time highs, it would be a nearly 17% gain.
Patterson-UTI Energy, Inc. (PTEN)
EARNINGS: 7/28/2022 (AMC)
Patterson-UTI Energy, Inc. engages in the provision of drilling and pressure pumping services, directional drilling, rental equipment and technology. It operates through the following segments: Contract Drilling Services, Pressure Pumping Services, and Directional Drilling Services. The Contract Drilling Services segment markets its services to major and independent oil and natural gas operators. The Pressure Pumping Services segment offers pressure pumping services to oil and natural gas operators primarily in Texas and the Appalachian Basin. The Directional Drilling Services segment consists of downhole performance motors and equipment to provide services including directional drilling, downhole performance motors, motor rentals, directional surveying, measurement-while-drilling, and wireline steering tools, in most major onshore oil and natural gas basins. The company was founded by Cloyce A. Talbott and A. Glenn Patterson in 1978 and is headquartered in Houston, TX.
Predefined Scans Triggered: Moved Above Upper Keltner Channel, New 52-week Highs, Moved Above Upper Bollinger Band, P&F Double Top Breakout and P&F Triple Top Breakout.
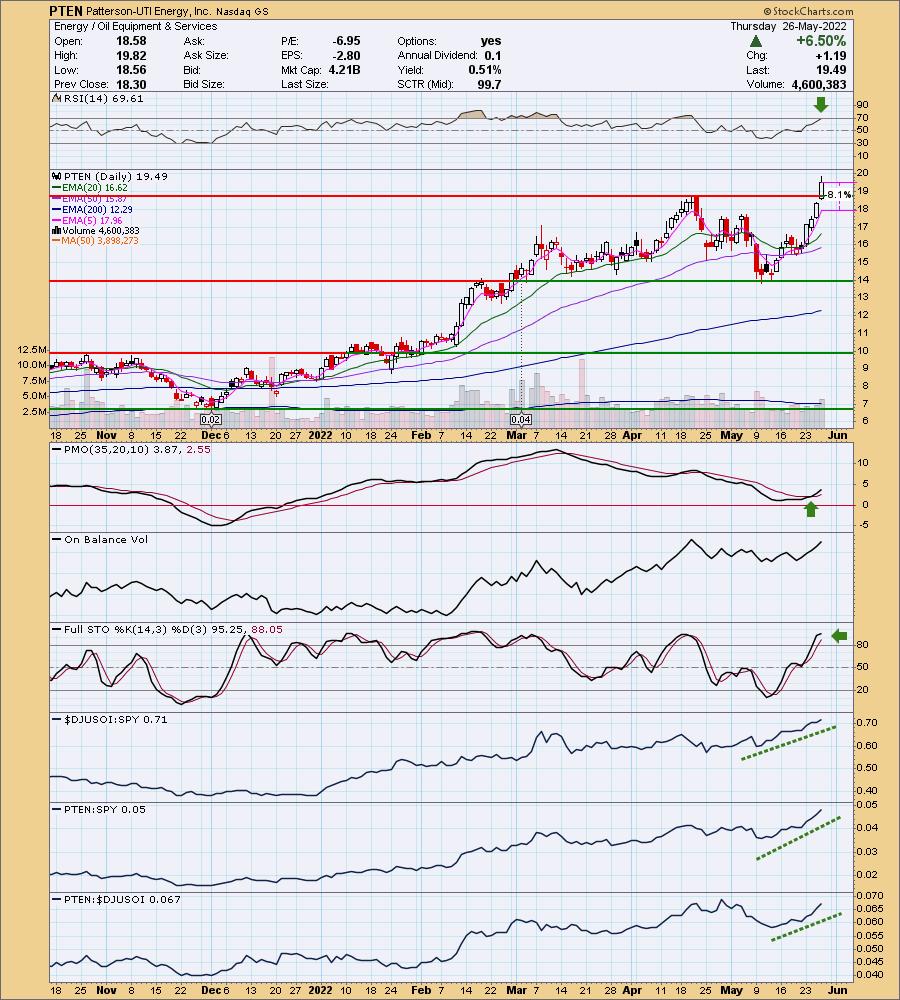
PTEN is down -0.05% in after hours trading. I covered PTEN on April 14th 2022. The stop was triggered on the late April decline. Today we saw a gap up that brought price above overhead resistance and at a new 52-week high. This looks like a continuation gap that implies higher prices. The RSI is positive, although getting overbought. Overbought conditions in the Energy sector haven't been overly dangerous. The PMO is on a recent crossover BUY signal. Relative strength is excellent for both the group and the stock. The stop is set below gap support.
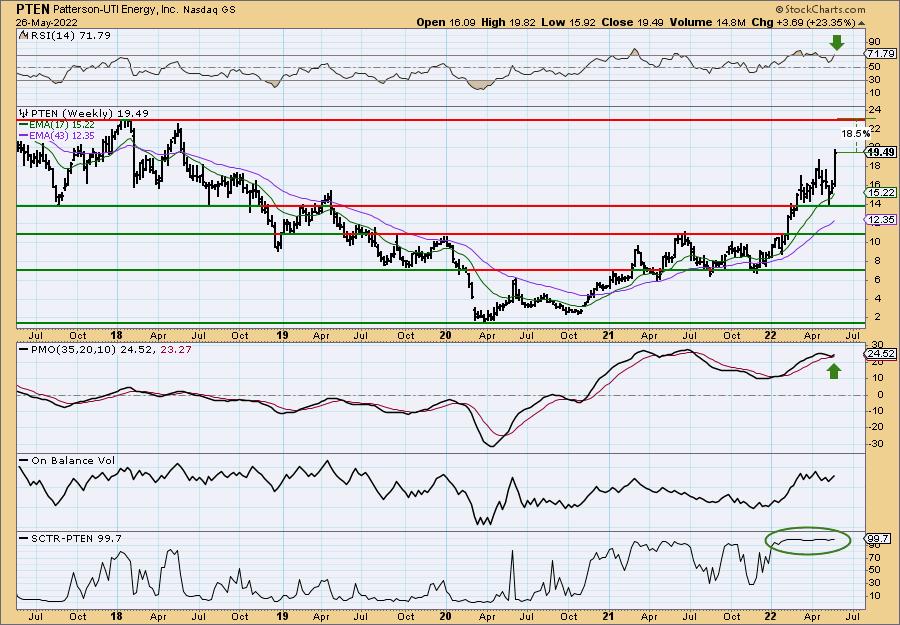
The weekly PMO has bottomed above its signal line which is especially bullish. The weekly RSI is back in overbought territory unfortunately, but it has spend much of the year in overbought territory. The SCTR is 99.7 which implies PTEN is in the upper 1% of all mid-cap stocks based on internal strength. Upside potential is 18.5%, but likely higher prices will materialize.
Steel Dynamics, Inc. (STLD)
EARNINGS: 7/18/2022 (AMC)
Steel Dynamics, Inc. engages in the manufacture of steel products and metal recycling. It operates through the following segments: Steel Operations, Metals Recycling Operations, and Steel Fabrication Operations. The Steel Operations segment consists of sheet products including hot roll, cold roll, and coated steel, long products including structural steel beams, pilings, and standard and premium grade rail, and steel finishing services such as turning, polishing, straightening, chamfering, threading, and precision saw-cutting. The Metals Recycling Operations segment provides ferrous and non-ferrous scrap recycling, scrap management, transportation, and brokerage products and services. The Steel Fabrication Operations segment offers steel joists, girders, and steel deck, including specialty deck. The company was founded by Keith E. Busse, Mark D. Millett, Richard P. Teets, and John C. Bates in 1993 and is headquartered in Fort Wayne, IN.
Predefined Scans Triggered: Moved Above Ichimoku Cloud, P&F Ascending Triple Top Breakout and P&F Double Top Breakout.
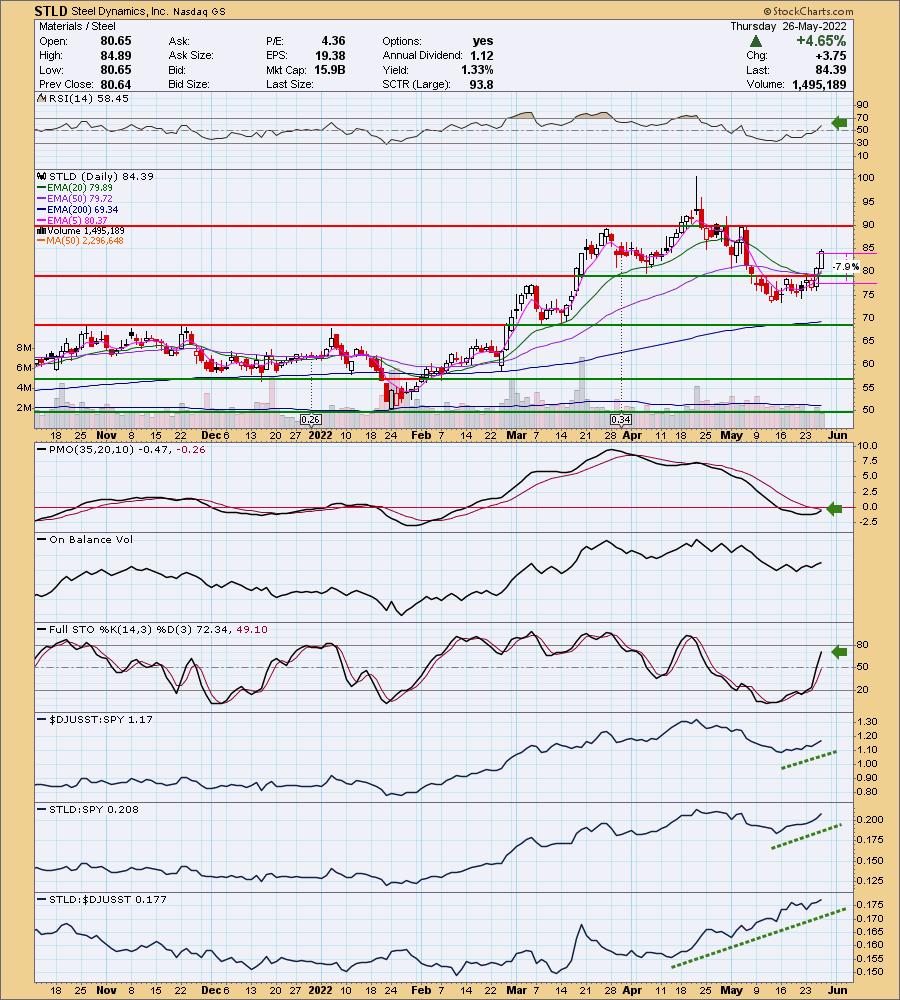
STLD is down -0.17% in after hours trading. I covered STLD on February 25th 2021. The position is still open and is up +100.6%! Right now we see a rounded bottom in price with a breakout yesterday above the 20/50-day EMAs. We saw an excellent continuation of the breakout today. Overhead resistance is arriving at $90, but we have positive indicators. The RSI is in positive territory and rising. The PMO is nearing a crossover BUY signal. Stochastics are rising vertically in positive territory. Relative strength is bullish across the board. The stop is set below key moving averages and the April low.
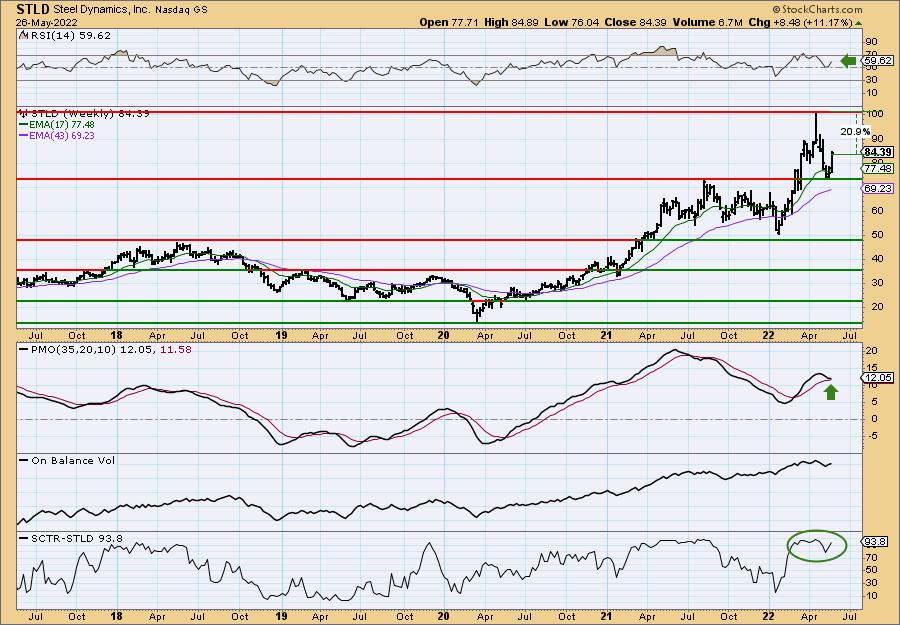
Price bounced off long-term support at the 2021 high. The weekly RSI is positive and rising. The weekly PMO is attempting to bottom above the signal which is bullish. The SCTR has been strong with the exception of the dastardly decline in April. Currently it shows STLD in the upper 7% of all large-caps based on internal strength.
Don't forget, on Thursdays I look at reader-requested symbols, click HERE to shoot me an email. I read every email I receive and try to answer them all!
Current Market Outlook:
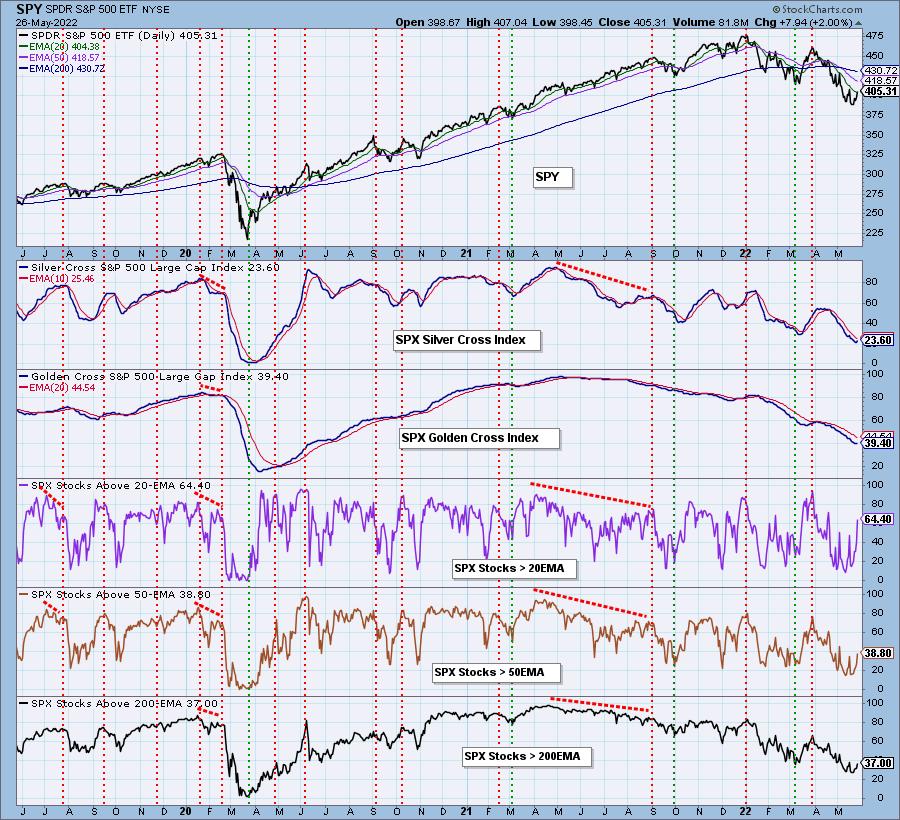
Market Environment: It is important to consider the odds for success by assessing the market tides. The following chart uses different methodologies for objectively showing the depth and trend of participation for intermediate- and long-term time frames.
- The Silver Cross Index (SCI) shows the percentage of SPX stocks on IT Trend Model BUY signals (20-EMA > 50-EMA)
- The Golden Cross Index (GCI) shows the percentage of SPX stocks on LT Trend Model BUY signals (50-EMA > 200-EMA)
Don't forget that as a "Diamonds" member, you have access to our GCI/SCI curated ChartList on DecisionPoint.com. You'll find it under "Members Only" links on the left side on the Blogs and Links Page.
Here is the current chart:
Full Disclosure: I'm 20% exposed with 10% hedge. I'll be loosening my hedge if rally continues, which it appears it will.
I'm required to disclose if I currently own a stock and/or may buy/short it within the next 72 hours.
"Technical Analysis is a windsock, not a crystal ball." - Carl Swenlin
(c) Copyright 2022 DecisionPoint.com
Watch the latest episode of DecisionPoint with Carl & Erin Swenlin on Mondays 7:00p EST or on the DecisionPoint playlist on the StockCharts TV YouTube channel here!
NOTE: The stocks reported herein are from mechanical trading model scans that are based upon moving average relationships, momentum and volume. DecisionPoint analysis is then applied to get five selections from the scans. The selections given should prompt readers to do a chart review using their own analysis process. This letter is not a call for a specific action to buy, sell or short any of the stocks provided. There are NO sure things or guaranteed returns on the daily selection of "Diamonds in the Rough."
Helpful DecisionPoint Links:
DecisionPoint Shared ChartList and DecisionPoint Chart Gallery
Price Momentum Oscillator (PMO)
Swenlin Trading Oscillators (STO-B and STO-V)
For more links, go to DecisionPoint.com