
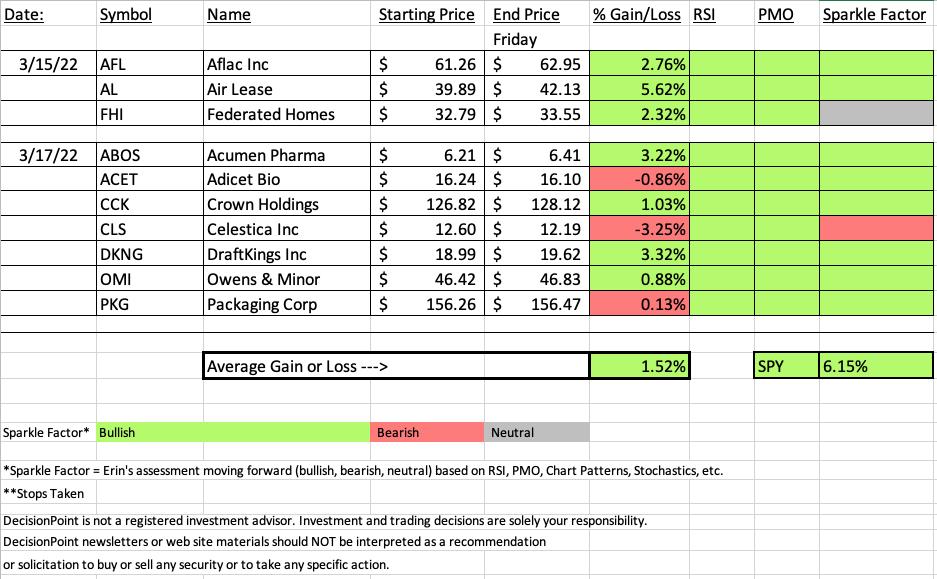
It was a good week for "Diamonds in the Rough", a really good week. However, the SPY was up over 6% and competing with a benchmark that had a full week of trading against seven "Diamonds in the Rough" that had only one day to mature, I'm actually quite pleased.
I still have mother-in-law issues to deal with today so I'm just going to get right into it so I can get back to her this evening.
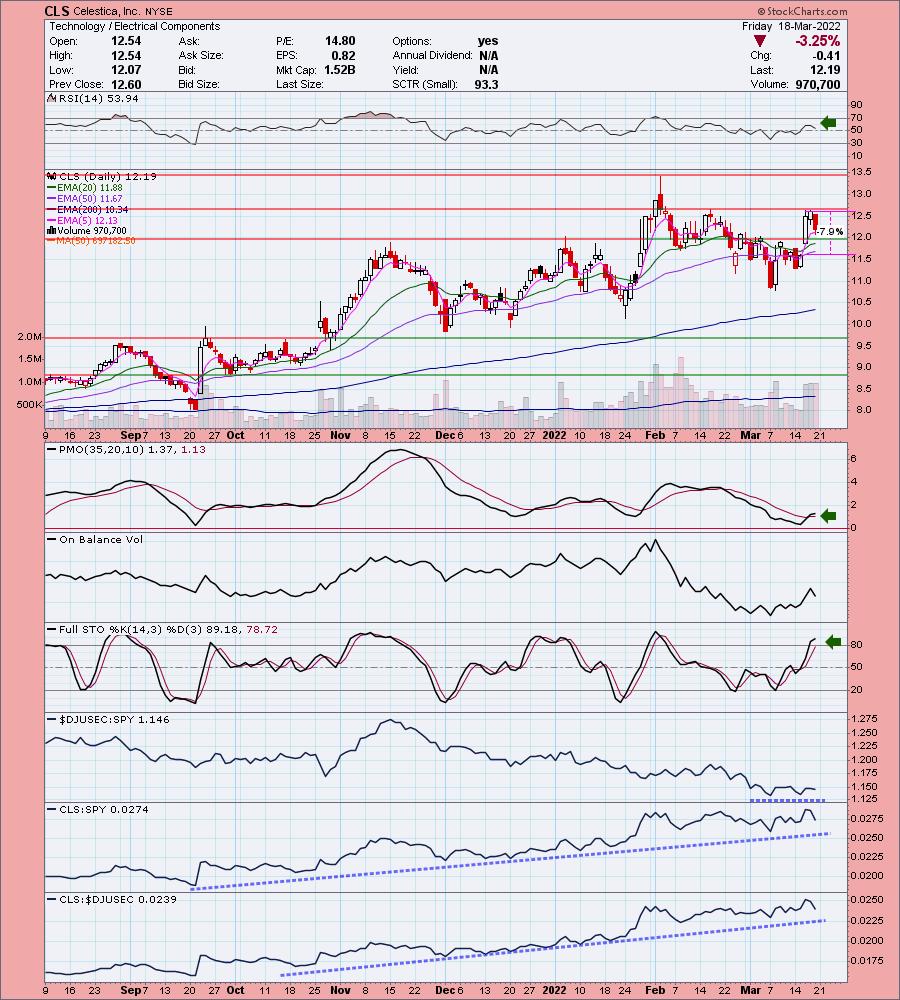
This week's Darling was Air Lease (AL) which was up 5.62%. The Dud was Celestica (CLS) which was down -3.25%. CLS only had one day to mature while AL had three days.
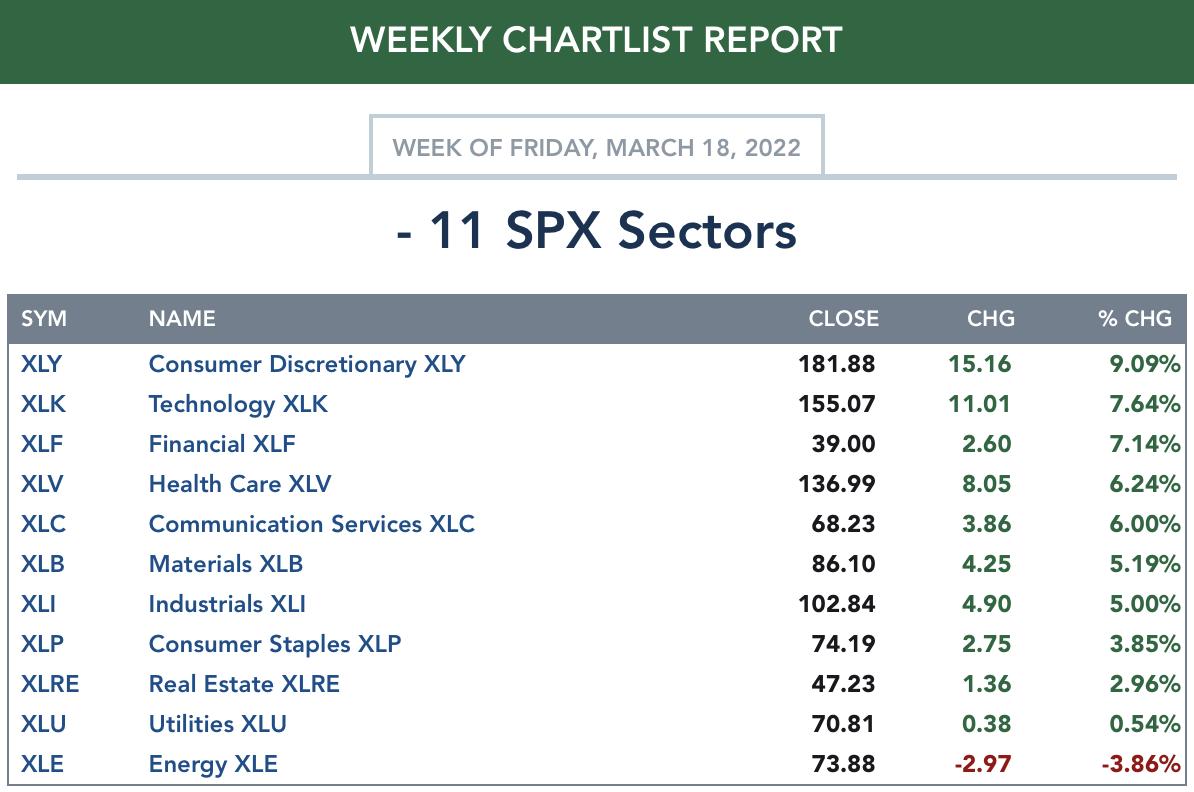
Diamond Mine attendees will recognize this week's sector and industry group to watch. The growth stocks shined this week, but rather than go with Technology or Discretionary which have had a great week, I'm opting to go with Healthcare (XLV).
This will be the last Recap until I return from vacation on April 1st. Next week will be abbreviated with ten picks Monday and Tuesday with no Recap or Diamond Mine. The following week there will be no reports or trading rooms.
Have a great weekend!
Erin
*** Working VACATION March 23rd to April 1st ***
I will be taking a trip to the Netherlands and Belgium to see the tulips! As always, I will post pictures and give you a brief diary of my adventures for those interested. Here is how publishing will be affected.
Schedule:
DP Alert - The DPA will be published each market day as usual, but comments will be abbreviated. You will get the latest charts, but if there are no significant changes, comments will be carried over.
DP Diamonds - Week of March 21st: Five picks on 3/21 and five picks on 3/22 - No Diamond Mine or Recap // Week of March 28th: No Diamonds Reports (You will be compensated with an additional week added to the end of your subscription)

RECORDING LINK (3/18/2022):
Topic: DecisionPoint Diamond Mine (3/18/2022) LIVE Trading Room
Start Time: Mar 18, 2022 09:00 AM
Meeting Recording Link.
Access Passcode: March$18
REGISTRATION FOR Friday 4/8 Diamond Mine:
When: Apr 8, 2022 09:00 AM Pacific Time (US and Canada)
Topic: DecisionPoint Diamond Mine (4/8/2022) LIVE Trading Room
Register in advance for this webinar HERE.
Save the registration confirmation email with login instructions in case Zoom doesn't notify you in time.

Free DP Trading Room (3/7) RECORDING LINK:
Topic: DecisionPoint Trading Room
Start Time: Mar 14, 2022 09:01 AM
Meeting Recording Link.
Access Passcode: March@14
For best results, copy and paste the access code to avoid typos.
A few items about the spreadsheet: I've put on the spreadsheet whether the RSI is positive (green) or negative (red). The PMO column tells you if it is rising (green) or falling (red). Finally I've added my own "Sparkle Factor" that gives you my assessment going forward, bullish (green), bearish (red) or neutral (gray). The Sparkle Factor is basically my thoughts on whether I expect it to rise or fall. A neutral means it could really go either way so it could be added to a watch list. If you're in a stock I consider "neutral" going forward, the ball is in your court.
Darling:
Air Lease Corp. (AL)
EARNINGS: 5/5/2022 (AMC)
Air Lease Corp. engages in the provision of aircraft leasing business. It focuses on purchasing new commercial jet transport aircraft directly from aircraft manufacturers, and leasing those aircraft to airlines throughout the world with the intention to generate attractive returns on equity. The company was founded by Steven F. Udvar-Hazy in January 2010 and is headquartered in Los Angeles, CA.
Predefined Scans Triggered: None.
Here are the comments and chart from Tuesday 3/15:
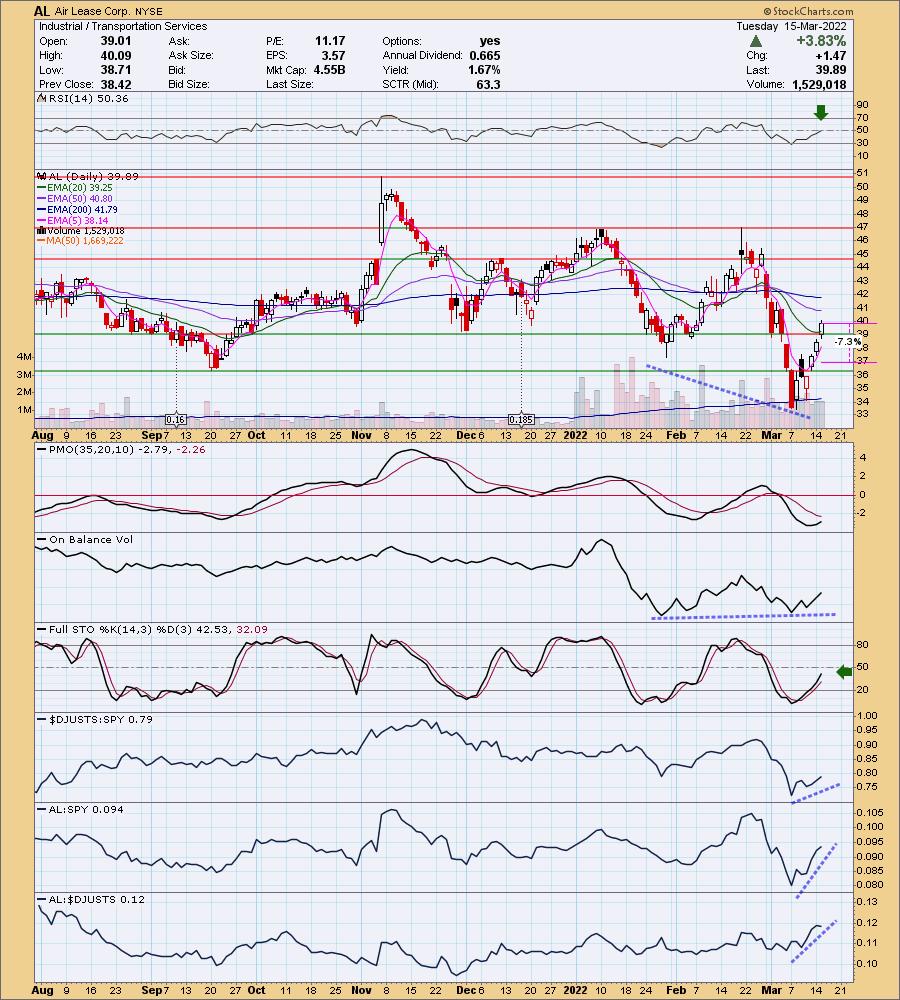
"AL is up +0.85% in after hours trading. I like the breakout above the 20-day EMA and the resistance level at $39. This one has a bit of a bearish bias given the 50-day EMA is below the 200-day EMA, but indicators are improving on this somewhat "V" shaped rally. The RSI just hit positive territory and the PMO has turned up in oversold territory. Stochastics are rising, but it's early as they haven't reached above 50 just yet. I primarily liked this one due to the positive OBV divergence (rising bottoms on OBV and declining price bottoms). We don't see these that often so I always pay attention when I do see them. Relative performance is very strong. I've set the stop below the January low. It is about a 10% stop level if you set it below the September low and that's too deep, particularly in a market like we have right now."
Here is today's chart:
Today price penetrated and closed above the 200-day EMA making this one look even better. It's been multiple days to the upside so I would expect to see a pause soon. The RSI isn't overbought, Stochastics are now above 80 and the PMO has since had a crossover BUY signal. Still very bullish.

Don't forget, on Thursdays I look at reader-requested symbols, so shoot me an email at erin@decisionpoint.com. I read every email I receive and try to answer them all!
Dud:
Celestica, Inc. (CLS)
EARNINGS: 4/27/2022 (AMC)
Celestica, Inc. engages in the provision of supply chain solutions globally to original equipment manufacturers and service providers. It operates through the Advanced Technology Solutions (ATS) and Connectivity and Cloud Solutions (CCS) business segments. The ATS segment comprises of aerospace and defense, industrial, smart energy, health tech, and capital equipment businesses. The CCS segment consists of enterprise communications, telecommunications, servers, and storage businesses. Celestica was founded in 1994 and is headquartered in Toronto, Canada.
Predefined Scans Triggered: None.
Here are the comments and chart from yesterday (3/17):
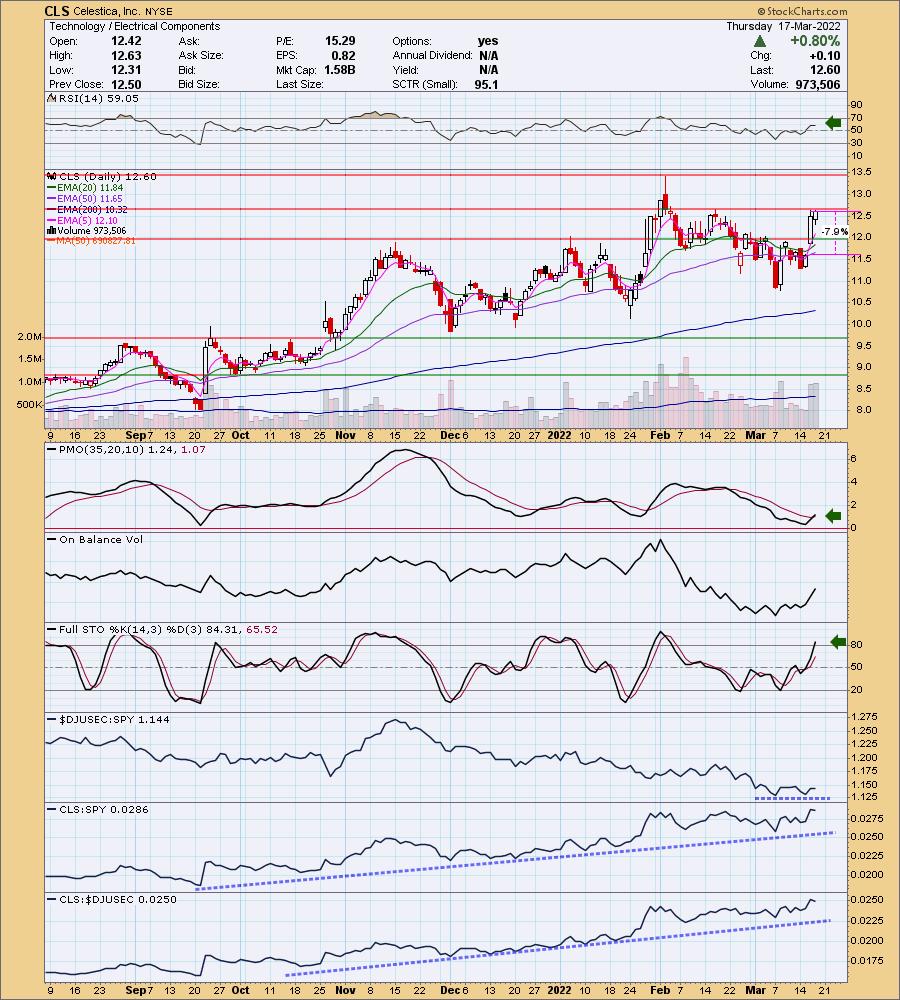
"CLS was up +1.98% in after hours trading. I covered CLS on November 4th 2021. The position is still open and is up +19.1%. I like the breakout above 20/50-day EMAs, still need to see a breakout above the mid-February high. Indicators suggest we will. Positive Stochastics, new PMO BUY signal, confirming rising trend on OBV and Stochastics reaching above 80. While the group may not be outperforming, CLS is outperforming the group and the market. The stop is set below the 50-day EMA."
Here is today's chart:
Here is today's chart:
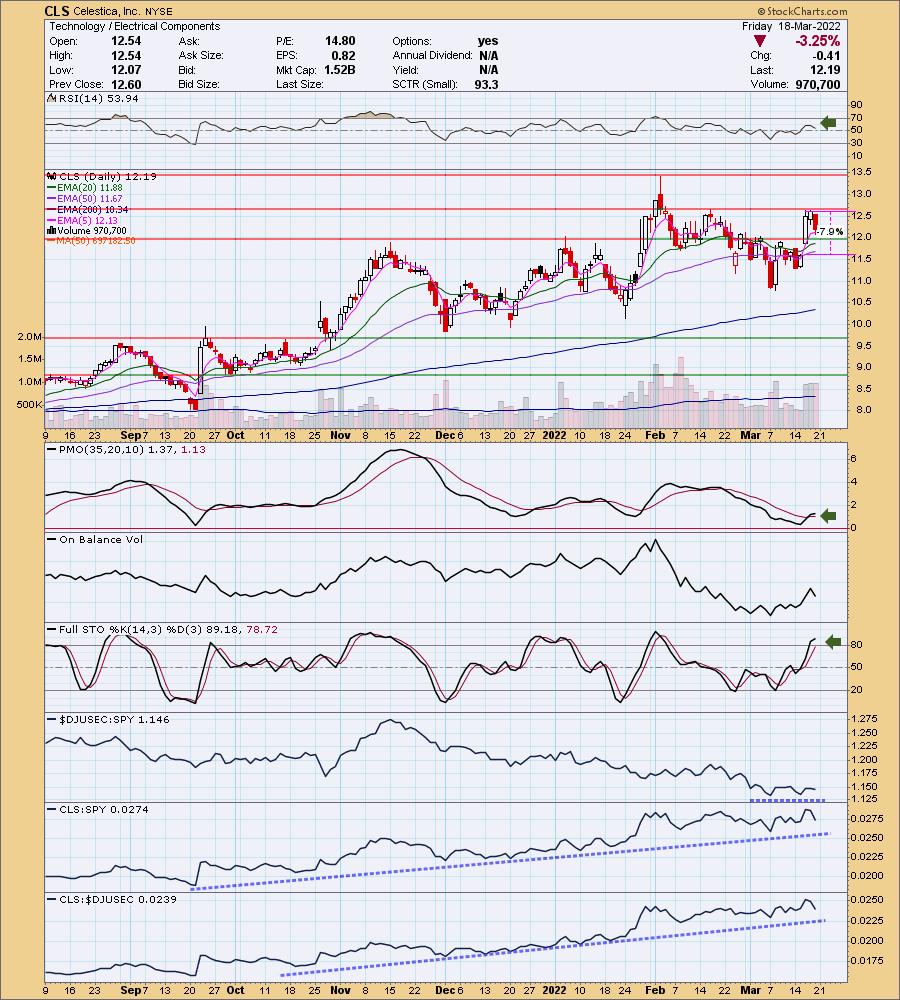
I don't like the pullback at overhead resistance. The RSI is still positive but the PMO is flattening already. Stochastics are still favorable. I mainly believe there are better choices out there which is why I gave it a Red Sparkle Factor.
TODAY'S Sector Performance:
DecisionPoint Sector Scoreboard (Mechanical Trend Model Signals):
Click Here to view Carl's annotated Sector ChartList!
Short-term (Daily) RRG:
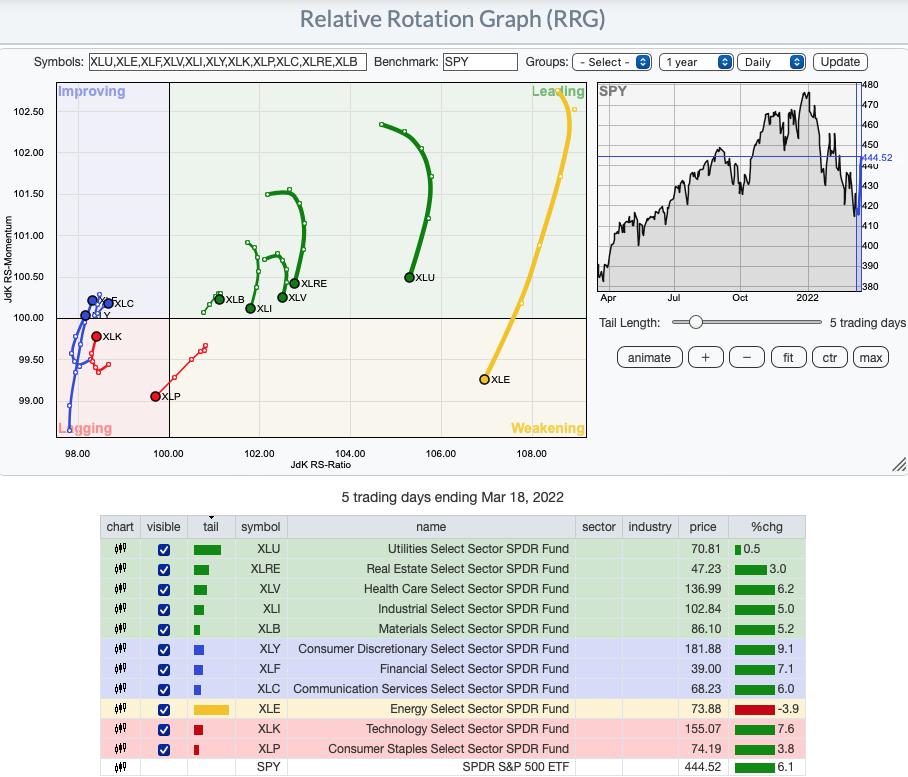
XLE has entered Weakening quickly. The pullback in Crude Oil likely pushed it there more quickly. Bullish sectors may surprise you. XLC, XLF and XLY all are in Improving and have bullish northeast headings. XLK is moving in a bullish northeast direction, but is still residing in Lagging.
XLP lost ground, has entered Lagging and is continuing in the bearish southwest direction.
All other sectors are losing steam. They are situated in Leading so it isn't bearish yet, but we can see that in the short term investors have rotated into Technology, Discretionary and Financials this week. The question is whether those sectors can maintain their leadership.
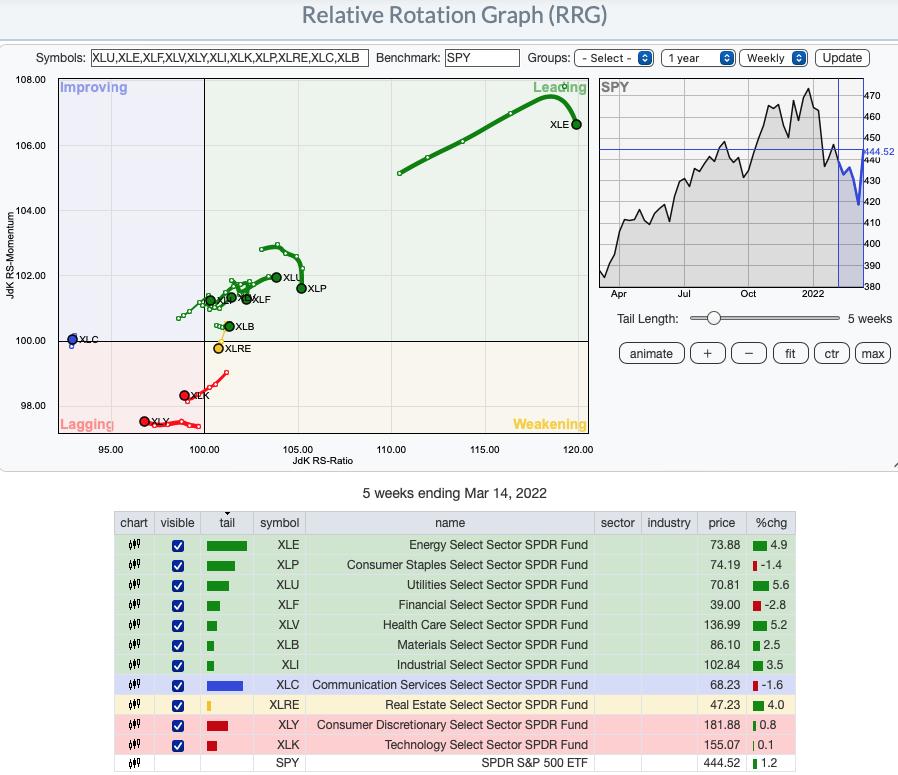
Intermediate-Term (Weekly) RRG:
Aggressive sectors XLK and XLY remain in Lagging although they are seeing a slight move northward toward Improving. Intermediate-term they don't look good.
XLC is maintaining position right between Improving and Lagging. Not bullish but not that bearish. XLE is still showing major outperformance against the SPY. It is in Leading, but is beginning to see some deterioration as it has begun to move southward.
I've made a "magnified" image of the RRG that takes out the outlier XLE.
Magnified view without XLE:
The "Sector to Watch", Healthcare (XLV), is the only sector in Leading that has a bullish northeast heading. The remainder in the Leading category (XLI, XLB, XLU, XLP and XLF) are seeing some deterioration of their headings. They are beginning to see south to southwest bearish headings.
XLRE has now entered Weakening and continues with a bearish southwest heading toward Lagging.
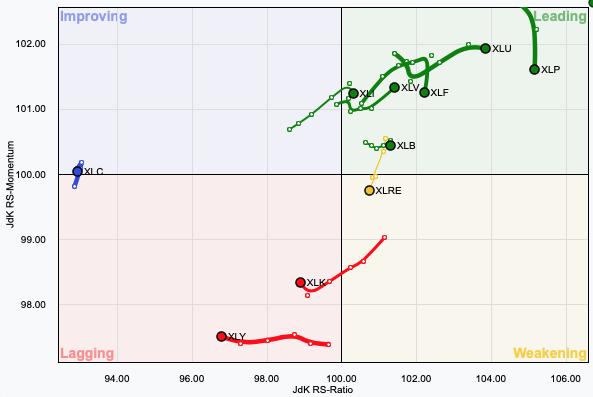
RRG® charts show you the relative strength and momentum for a group of stocks. Stocks with strong relative strength and momentum appear in the green Leading quadrant. As relative momentum fades, they typically move into the yellow Weakening quadrant. If relative strength then fades, they move into the red Lagging quadrant. Finally, when momentum starts to pick up again, they shift into the blue Improving quadrant.
CLICK HERE for an animated version of the RRG charts.
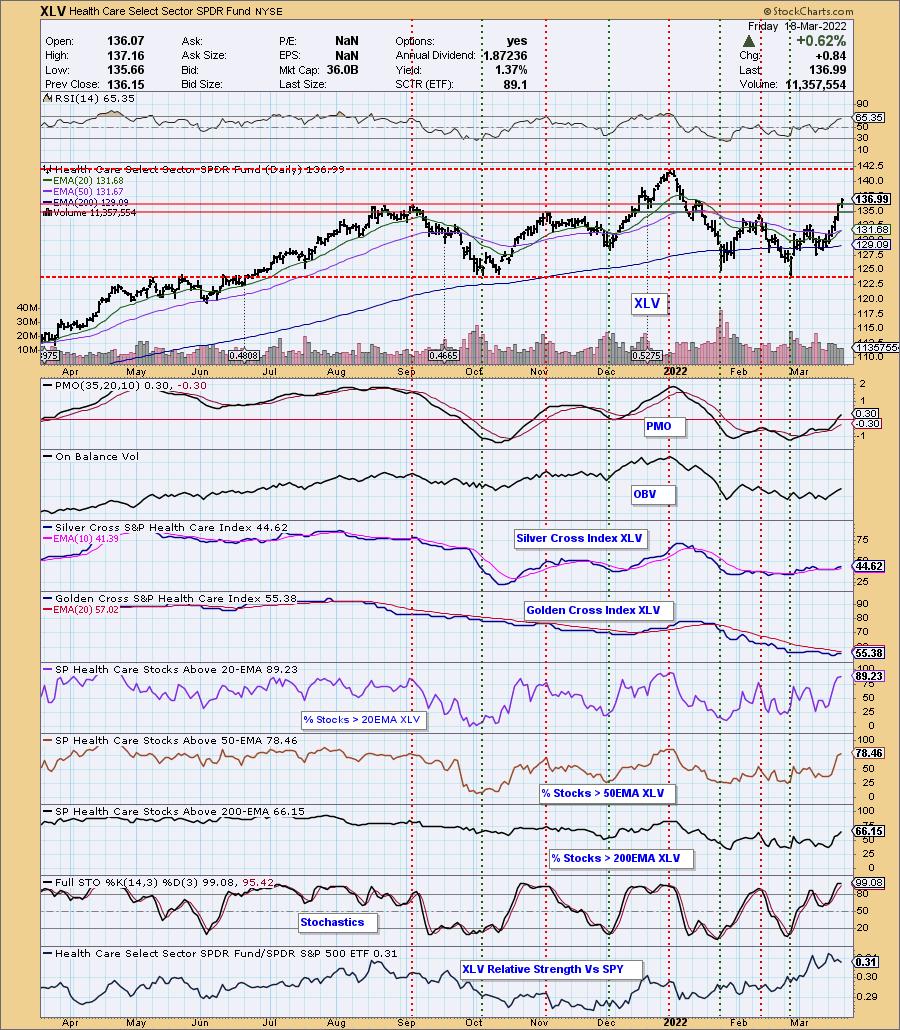
Sector to Watch: Healthcare (XLV)
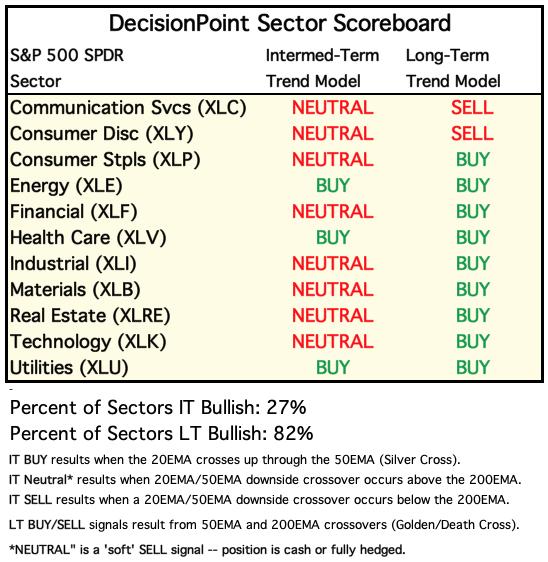
Most of the sectors now have PMO BUY signals and rallies starting. However, I like Healthcare best given its bullishness on the weekly RRG. Today we saw an IT Trend Model "Silver Cross" BUY signal as the 20-day EMA crossed above the 50-day EMA. We also can see a breakout from a strong resistance zone. The RSI is positive and not overbought and the PMO is on a BUY signal and has now made it above the zero line. While the Silver Cross Index (SCI) is still below the 70% bullish threshold, it is steading rising and has had a positive crossover. Additionally, we should see it continue to rise given the high percentages of stocks above their 20/50-day EMAs. The Golden Cross Index (GCI) hasn't seen marked improvement, it should soon given the much higher percentage of stocks > 50/200-day EMAs. I also like the relative strength against the SPY and Stochastics oscillating above 80.
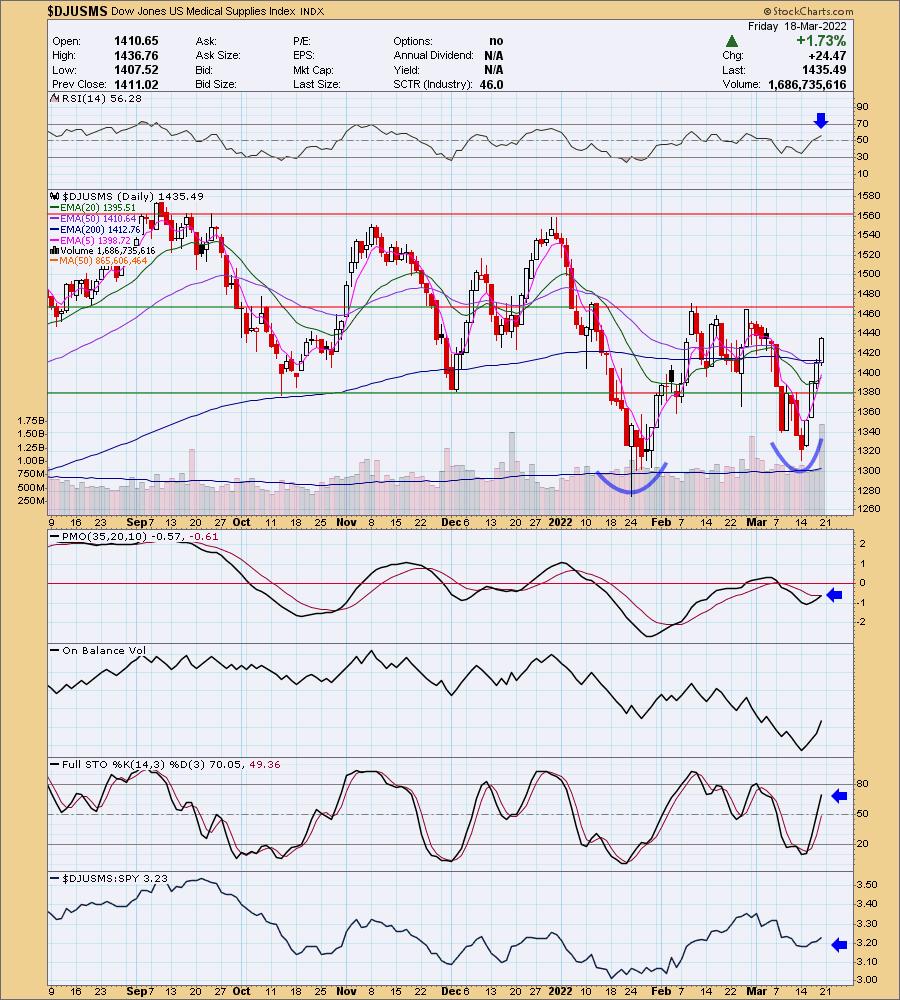
Industry Group to Watch: Medical Supplies ($DJUSMS)
I noted that all of the industry groups in Healthcare are now looking very bullish. I picked Medical Supplies because it is in the midst of a reversal whereas many of the other groups are getting overbought. The RSI is positive and the PMO is on a BUY signal. There is a large double-bottom pattern that will be confirmed when price overcomes the confirmation line at overhead resistance. Price has now overtaken all of the key moving averages and I also see a Short-Term Trend Model BUY signal as the 5-day EMA has just crossed above the 20-day EMA. Stochastics are rising in positive territory. Notice that the group is also starting to outperform the market. In another sense, we are in a group that isn't as aggressive like semiconductors and discretionary stocks.
Go to our Sector ChartList on DecisionPoint.com to get an in-depth view of all the sectors.
Have a great weekend! The next Diamonds Report is MONDAY 3/21.
- Erin
erin@decisionpoint.com
Full Disclosure: I'm 15% exposed to the market.
Watch the latest episode of DecisionPoint with Carl & Erin Swenlin on Mondays 7:00p EST or on the DecisionPoint playlist on the StockCharts TV YouTube channel here!
Technical Analysis is a windsock, not a crystal ball. --Carl Swenlin
NOTE: The stocks reported herein are from mechanical trading model scans that are based upon moving average relationships, momentum and volume. DecisionPoint analysis is then applied to get five selections from the scans. The selections given should prompt readers to do a chart review using their own analysis process. This letter is not a call for a specific action to buy, sell or short any of the stocks provided. There are NO sure things or guaranteed returns on the daily selection of "diamonds in the rough."
Helpful DecisionPoint Links:
DecisionPoint Shared ChartList and DecisionPoint Chart Gallery
Price Momentum Oscillator (PMO)
Swenlin Trading Oscillators (STO-B and STO-V)
(c) Copyright 2022 DecisionPoint.com