
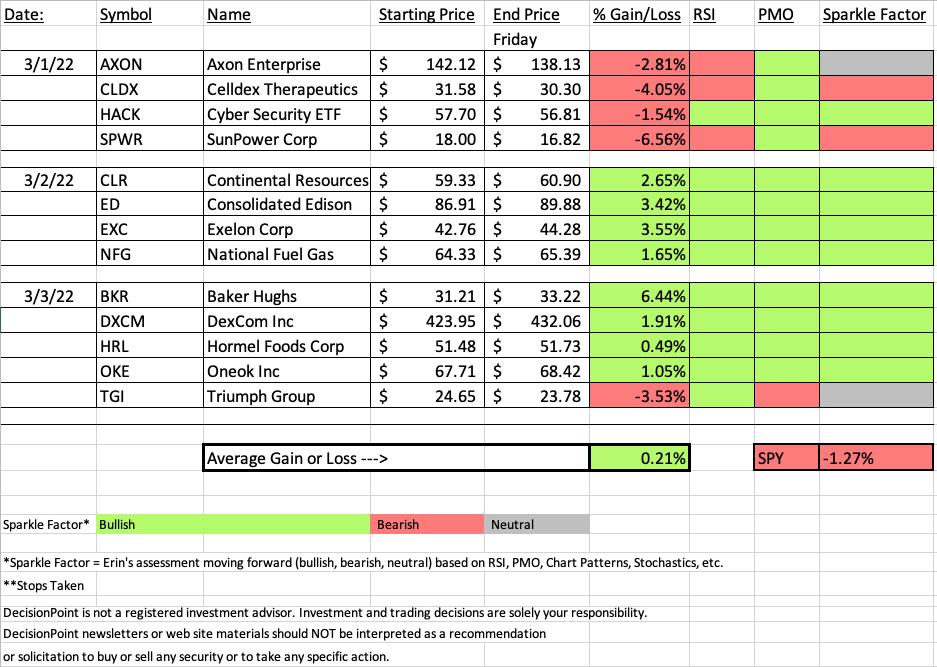
Considering the week we've had I was happy to see that "Diamonds in the Rough" mostly finished higher. Our average for the week was +0.21% while the SPY was down -1.27%. Granted "Diamonds in the Rough" have less time to mature since they are picked Tue-Thur. That be a good thing some weeks and a bad thing other weeks. This week it worked in our favor.
A few notes about today's spreadsheet:
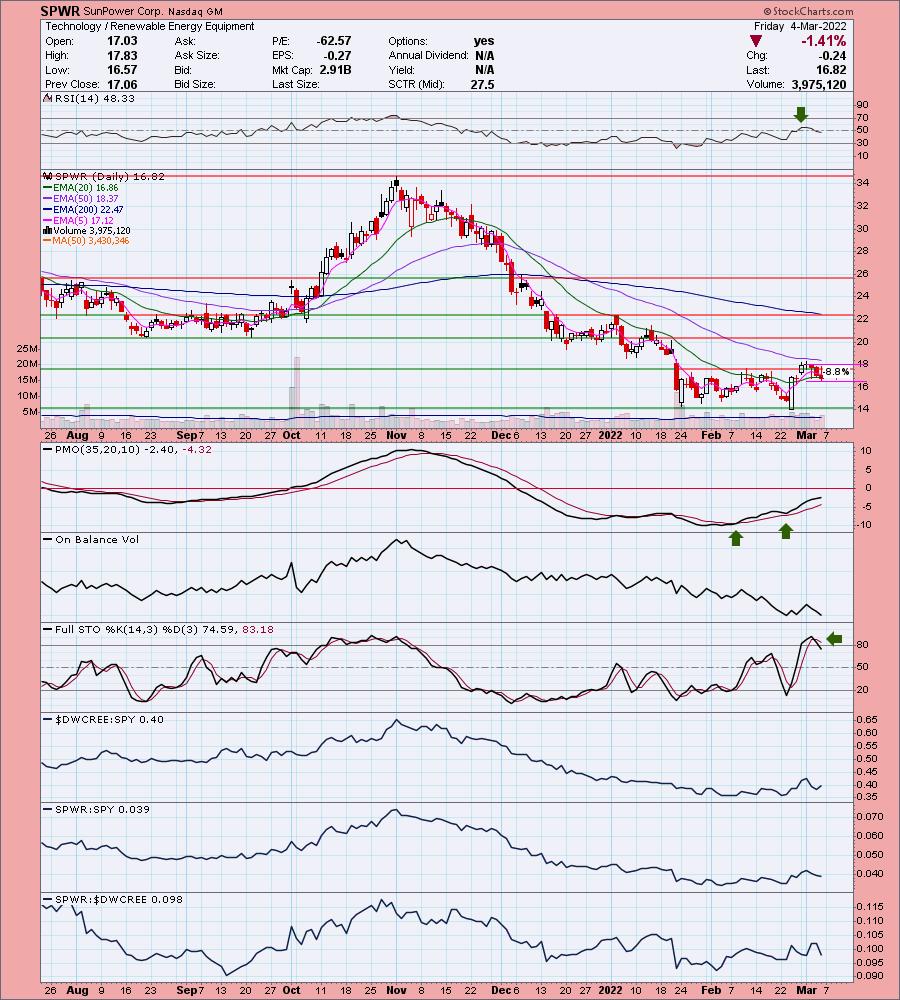
Renewable Energy was rallying on Monday and I picked SunPower (SPWR) as a "Diamond in the Rough". I also put it out there to viewers of the DecisionPoint Show. Solar reversed Wednesday which left SPWR as this week's "Dud". It didn't hit its stop but it certainly could have.
Cybersecurity ETF (HACK) is looking weak. I am watching it closely as I own it. My finger is on the trigger to sell. My sense is that growth areas like Technology could get the worst of this bear market (Did you know that the Nasdaq and Nasdaq 100 are both officially in bear markets?). Biotechs are similar which could explain why CLDX has a very bad week. I will be avoiding growth/aggressive sector stocks moving forward.
It was a strong week for Crude Oil. USO was over +20% this week! The Energy sector (XLE) looks very strong under the surface as far as participation and momentum. I don't see any weakness there yet. This would explain why Baker Hughes (BKR) is our "Darling" this week. It was picked only yesterday and was up +6.44% today.
The Defense industry group is clearly hit and miss. Lockheed (LMT) and Northrup Grumman (NOC) are soaring to all-time highs whereas our two "Diamonds in the Rough" in this group are really some of the worst performers this week. Likely we've missed the boat on the strong performing LMT and NOC (although the technicals are favorable enough to see them continue higher). I was thinking some of these beat down Defense stocks might see some love, but so far it isn't happening. This is why both TGI and AXON are listed as "neutral" for the Sparkle Factor.
Diamond Mine attendees won't be surprised by this week's "Sector to Watch", we pretty much narrowed it down to Utilities (XLU). All of the industry groups in this sector are bullish, but I'll share my pick later. Runner-up sectors would be Real Estate (XLRE) and of course, Energy (XLE) is still viable despite the run-up.
The recording link for to today's Diamond Mine trading room is below and will be in every DP Diamonds report as is the registration link for next week's.
***One last thing!*** I'll be doing a presentation on my market timing tools for trading at the "Women Teach Investing" online conference. They just told me opt-ins are very low right now. If you could do me the favor of signing up HERE, it would be much appreciated. The panel is full of outstanding women technicians that I'm sure you'll find interesting. Recordings are sent to registrants only. Of course my presentation will be the best!
Have a great weekend!
Erin

RECORDING LINK (3/4/2022):
Topic: DecisionPoint Diamond Mine (3/4/2022) LIVE Trading Room
Start Time: Mar 4, 2022 09:00 AM
Meeting Recording Link.
Access Passcode: March#4th
REGISTRATION FOR Friday 3/11 Diamond Mine:
When: Mar 11, 2022 09:00 AM Pacific Time (US and Canada)
Topic: DecisionPoint Diamond Mine (3/11/2022) LIVE Trading Room
Register in advance for this webinar HERE.
Save the registration confirmation email with login instructions in case Zoom doesn't notify you in time.

Free DP Trading Room (2/28) RECORDING LINK:
Topic: DecisionPoint Trading Room
Start Time: Feb 28, 2022 09:00 AM
Meeting Recording Link.
Access Passcode: Feb#28th
For best results, copy and paste the access code to avoid typos.
A few items about the spreadsheet: I've put on the spreadsheet whether the RSI is positive (green) or negative (red). The PMO column tells you if it is rising (green) or falling (red). Finally I've added my own "Sparkle Factor" that gives you my assessment going forward, bullish (green), bearish (red) or neutral (gray). The Sparkle Factor is basically my thoughts on whether I expect it to rise or fall. A neutral means it could really go either way so it could be added to a watch list. If you're in a stock I consider "neutral" going forward, the ball is in your court.
Darling:
Baker Hughes Company (BKR)
EARNINGS: 4/20/2022 (BMO)
Baker Hughes Co. is a holding company. The firm engages in the provision of oilfield products, services, and digital solutions. It operates through the following segments: Oilfield Services (OFS), Oilfield Equipment (OFE), Turbomachinery & Process Solutions (TPS) and Digital Solutions (DS). The OFS segment provides products and services for on and offshore operations across the lifecycle of a well, ranging from drilling, evaluation, completion, production, and intervention. The OFE segment provides a broad portfolio of products and services required to facilitate the safe and reliable flow of hydrocarbons from the subsea wellhead to the surface production facilities. The TPS segment provides equipment and related services for mechanical-drive, compression and power-generation applications. The DS segment provides operating technologies helping to improve the health, productivity, and safety of asset intensive industries and enable the Industrial Internet of Things. The company was founded in April 1987 and is headquartered in Houston, TX.
Predefined Scans Triggered: New 52-week Highs, Moved Above Upper Bollinger Band, P&F Ascending Triple Top Breakout and P&F Double Top Breakout.
Below are the commentary and chart from yesterday (3/3):
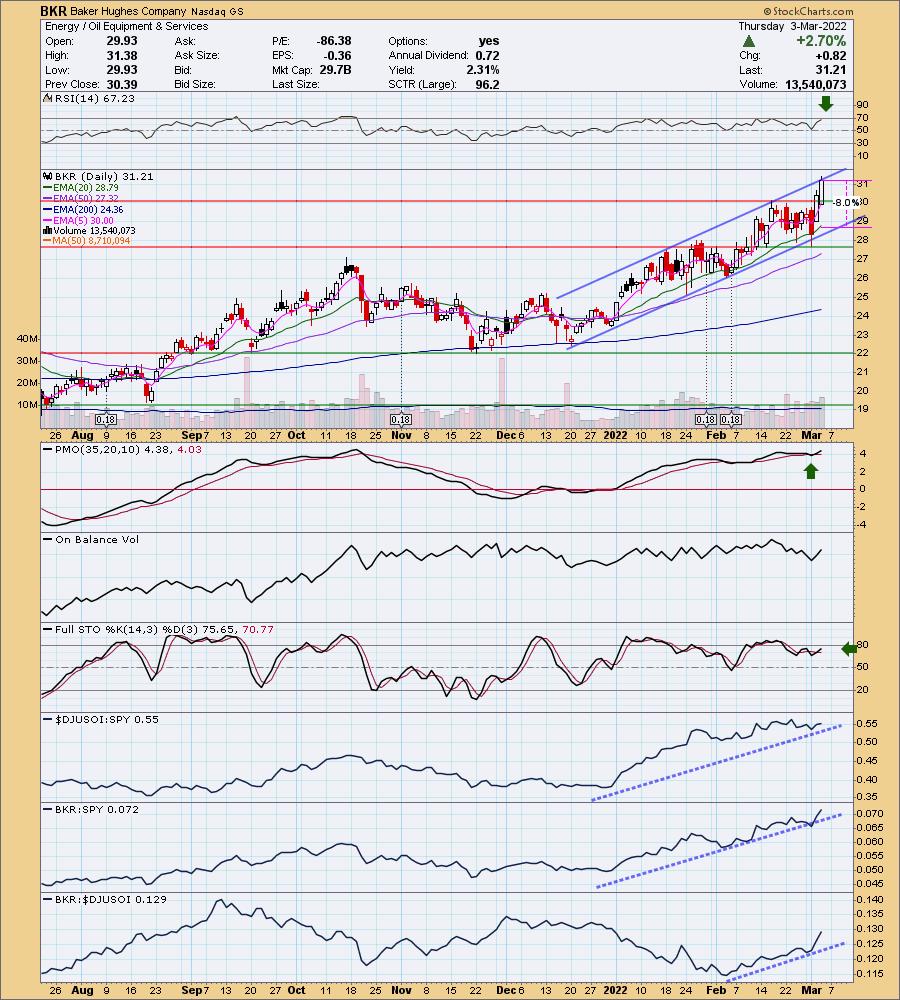
"BKR is unchanged in after hours trading. I covered BKR on December 7th 2021. If I'd made the stop a bit deeper the position would still be open, but the thin 6.6% stop was triggered and then BKR promptly took off. Setting stops is a tricky business for sure.
BKR is in a confirmed rising trend channel. It did just tap the top of it, so a pullback to the bottom of the channel is entirely possible. The PMO is on a whipsaw BUY signal. The RSI is positive and rising. Stochastics are positive, but not yet above 80 where we want it. Relative strength is positive amongst the group and BKR. The 8% stop is set at a level that would be hit should the rising trend be broken."
Here is today's chart:
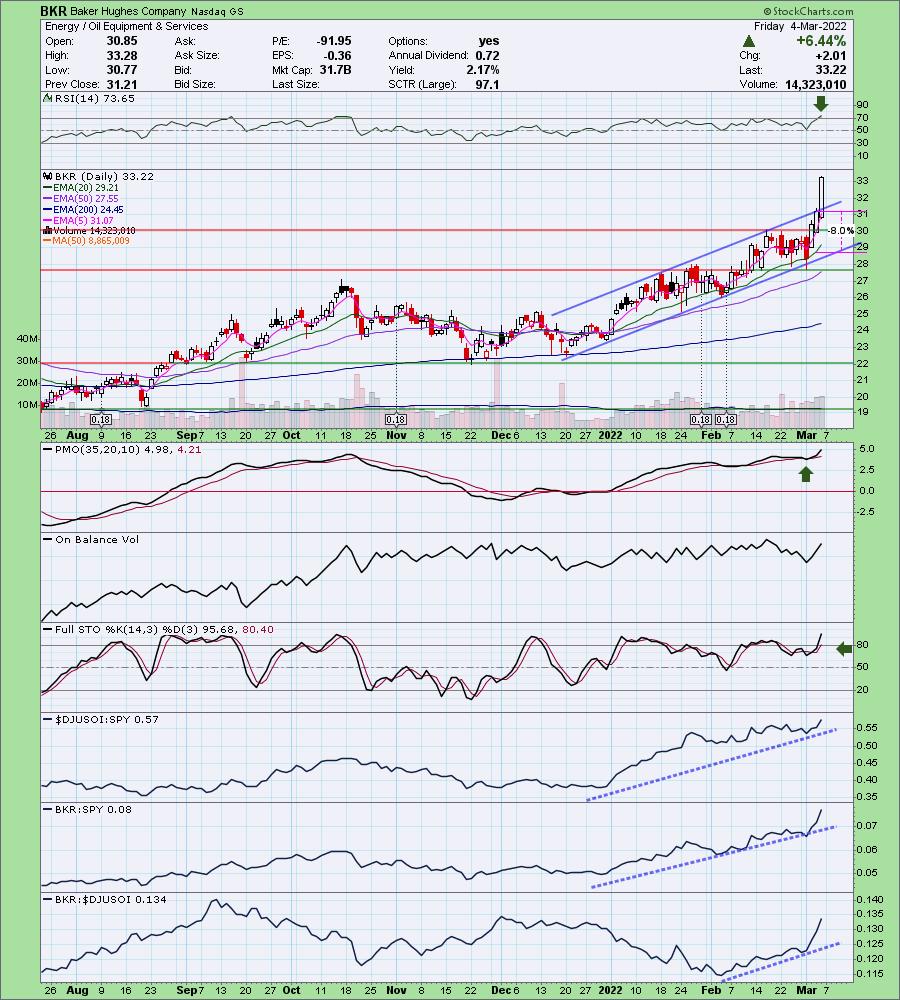
Huge breakout from an already rising trend channel today. It is very bullish right now, but overbought. I like this one going into next week, but I would look for a bit of pullback from today's high if you can get it. Certainly can't argue with the indicators and relative strength.
Don't forget, on Thursdays I look at reader-requested symbols, so shoot me an email at erin@decisionpoint.com. I read every email I receive and try to answer them all!
Dud:
SunPower Corp. (SPWR)
EARNINGS: 5/4/2022 (AMC)
SunPower Corp. engages in the design, manufacture, and delivery of solar panels and systems. It operates through the following business segments: Residential, Light Commercial, Commercial & Industrial Solutions, and Other. The Residential, Light Commercial segment refers to the sale of solar energy solutions, including sales to its third-party dealer network and resellers, storage solutions, cash and loan sales, and long-term leases directly to end customers. The Commercial and Industrial Solutions segment includes direct sales of turn-key engineering, procurement, and construction services and sales of energy under power purchase agreements. The Other Segment consists of worldwide power plant project development, project sales, and U.S. manufacturing. The company was founded by Thomas L. Dinwoodie, Robert Lorenzini and Richard M. Swanson in April 1985 and is headquartered in San Jose, CA.
Predefined Scans Triggered: P&F Double Top Breakout.
Below are the commentary and chart from Tuesday (3/1):
"SPWR is up +0.83% in after hours trading. I covered SPWR in the September 30th 2020 report. The position is still open and up +43.9%. At its parabolic top, the position was actually up over 322%! So while 43.9% is good, that is a big ouch if you held onto it this long.
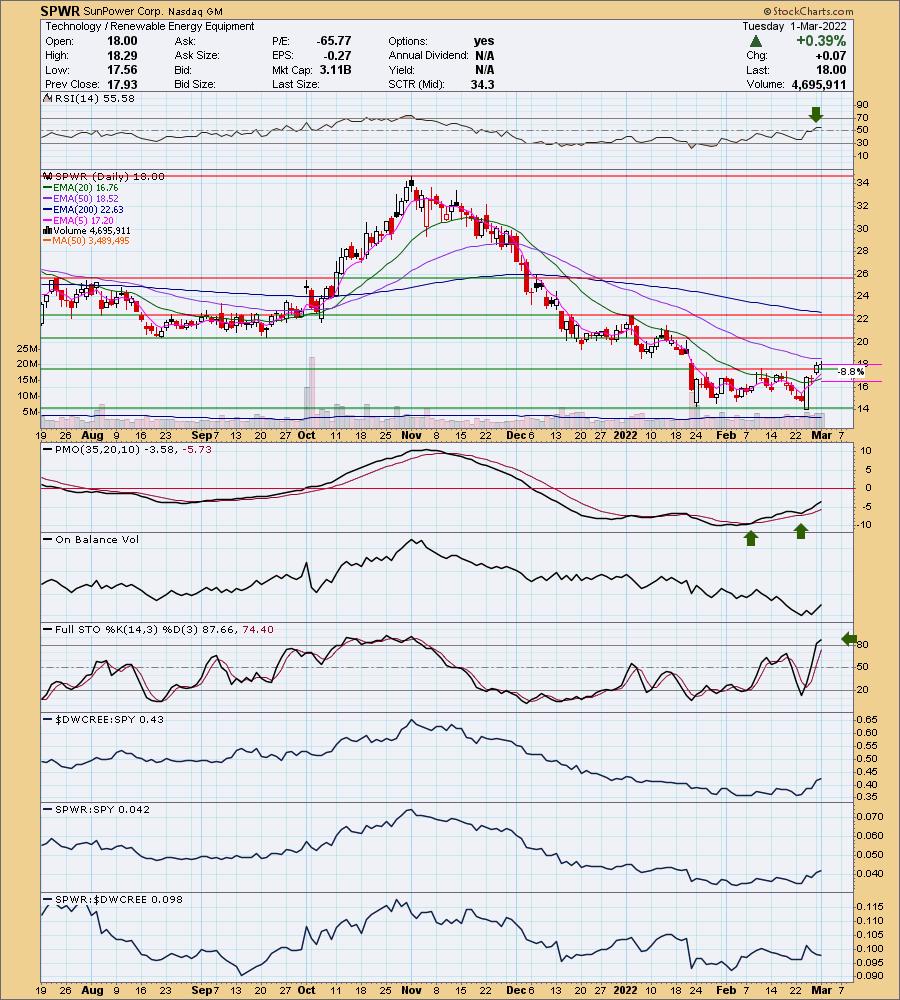
We have a trading range and a breakout this week. There are layers of overhead resistance for SPWR to power through (no pun intended). First up is the 50-day EMA and then the resistance from the August/September lows. The indicators are certainly in line with a continued rally. The RSI is positive and the PMO is rising after a crossover BUY signal from earlier in the month and a PMO bottom above the signal line. I'm not really impressed with volume, but Stochastics look strong. Relative strength against the group is erratic, but it is currently starting to outperform the SPY. The stop is set below the 20-day EMA."
Below is today's chart:
SPWR promptly nose-dived after it was listed as a "Diamond in the Rough". I miscalculated on Renewable Energy this week. It is in Technology and it can be volatile and speculative. I should've passed on this group. It was a learning experience. Notice that it is in its own bear market. It hadn't broken above the 50-day EMA yet. I will be more selective and as I noted in the intro, I will be avoiding growth/aggressive stocks.
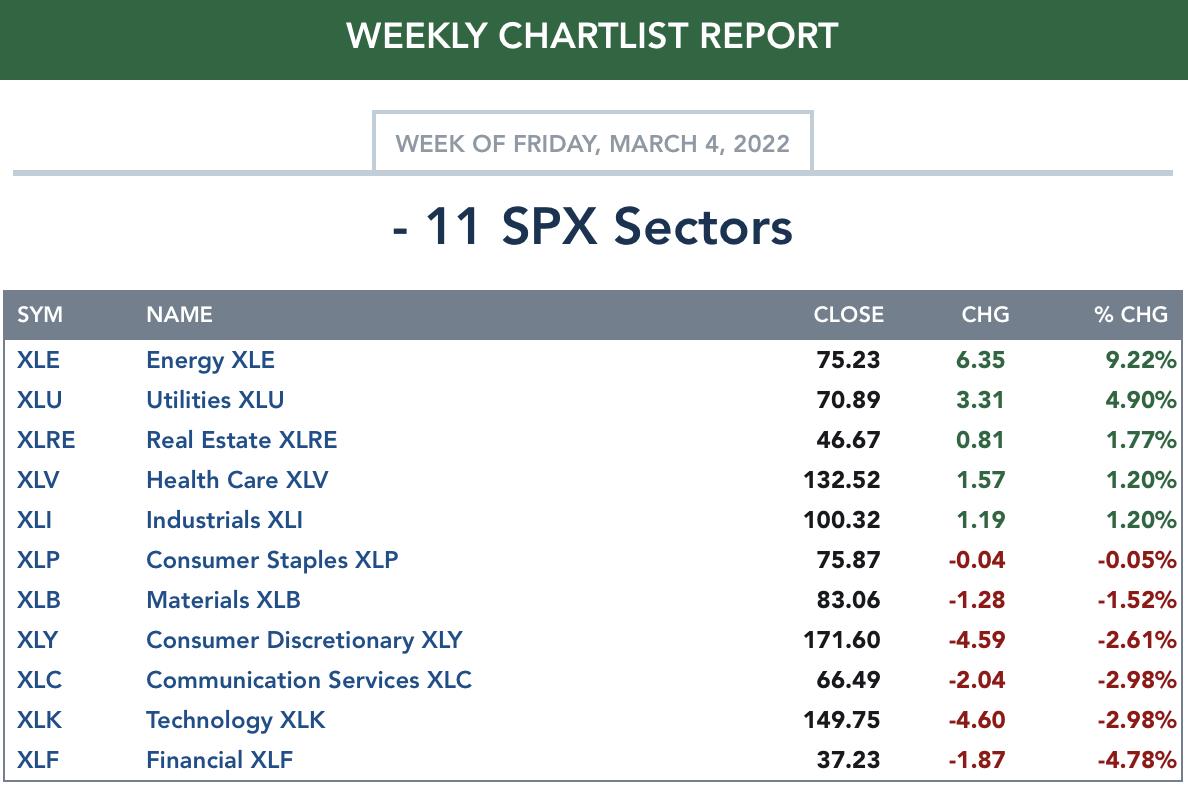
TODAY'S Sector Performance:
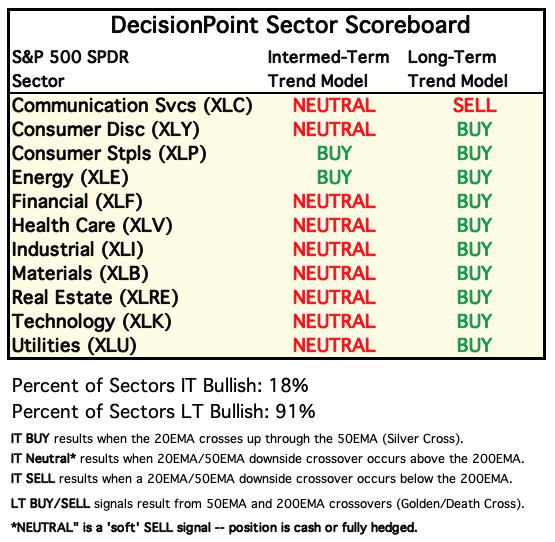
DecisionPoint Sector Scoreboard (Mechanical Trend Model Signals):
Click Here to view Carl's annotated Sector ChartList!
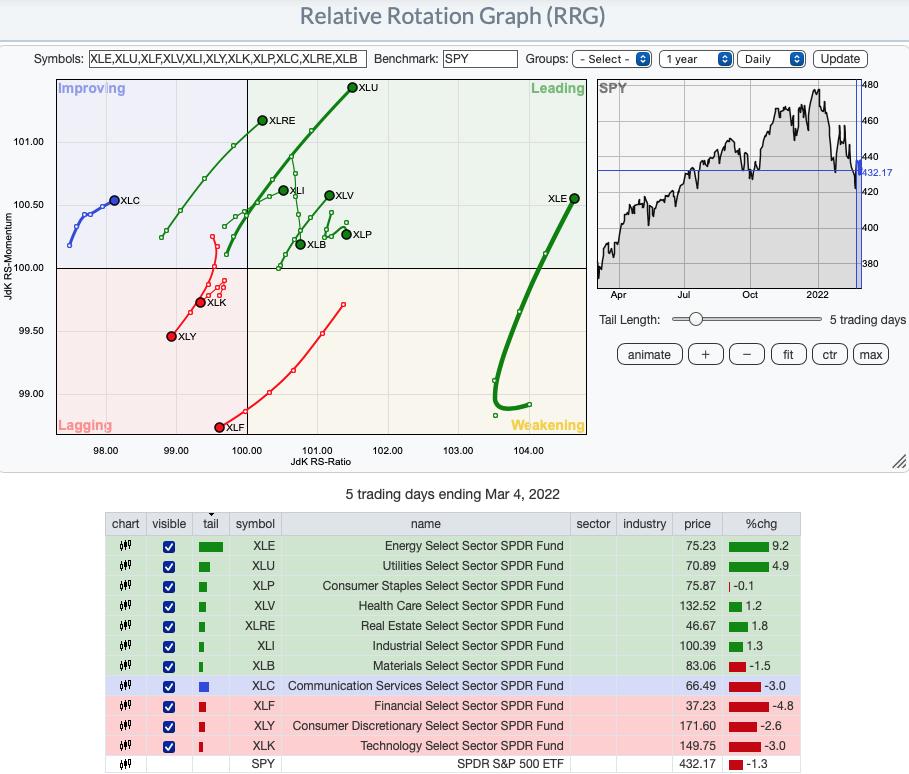
Short-term (Daily) RRG:
The most bearish sectors are not surprising. XLY, XLK and XLF are pushing further into Lagging. The war seems to be shaving investors' interest in more aggressive areas of the market. I'm sticking to more defense picks in DP Diamonds report.
XLU, XLRE and XLE are showing the most relative strength and it is just getting better as they move in the bullish northeast direction. Not far behind are XLI and XLV which are closer to the center (so not outperforming the SPY as much) and they also have bullish northeast headings.
XLB and XLP are showing some weakness despite being in Leading. XLB is hit and miss as far as relative strength within its industry groups and I believe that explains the southward heading. XLP was looking pretty good this week, but today it has reversed into a bearish southwest heading.
XLC is out on its own in Improving. It also has a bullish northeast heading. The bullish/bearish diversity within its industry groups (most of which are failing) makes me less confident investing in that sector. If you do, make sure the industry group is outperforming.
Intermediate-Term (Weekly) RRG:
XLE continues to be the strongest performer. I don't see this sector slowing down anytime soon. The most bearish in the intermediate term are XLK, XLY and interestingly XLRE which looks good on the short-term daily RRG above.
XLC just moved into Improving on the weekly RRG. As noted above I'm not fan of the sector. XLI which is in Improving currently should enter Leading very soon. XLF and XLU are moving away from the center (SPY) in a bullish northeast direction.
XLB is hooking back around unlike on the daily RRG. XLP looks strong even though it is traveling southeast. It's firmly within Leading. It will take some serious underperformance against the SPY before it reaches Weakening.
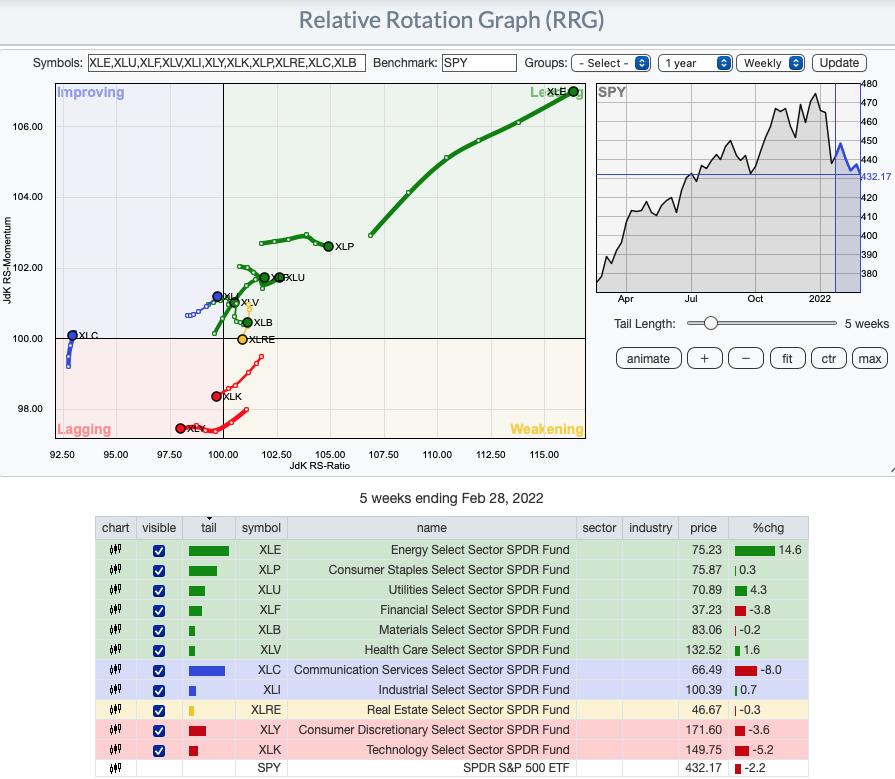
RRG® charts show you the relative strength and momentum for a group of stocks. Stocks with strong relative strength and momentum appear in the green Leading quadrant. As relative momentum fades, they typically move into the yellow Weakening quadrant. If relative strength then fades, they move into the red Lagging quadrant. Finally, when momentum starts to pick up again, they shift into the blue Improving quadrant.
CLICK HERE for an animated version of the RRG charts.
Sector to Watch: Utilities (XLU)
One thing that I preferred over XLRE was that the SCI is at 48%; whereas, the SCI on XLRE is at 28%. There is a stronger foundation on XLU. Also, %Stocks > 20/50/200-EMAs have bullish readings across the board (greater than 70%) and they are rising strongly. My other beef with XLRE is price hasn't overcome resistance at the 50-day EMA. I'll put the XLRE chart below XLU so you can see the comparisons.
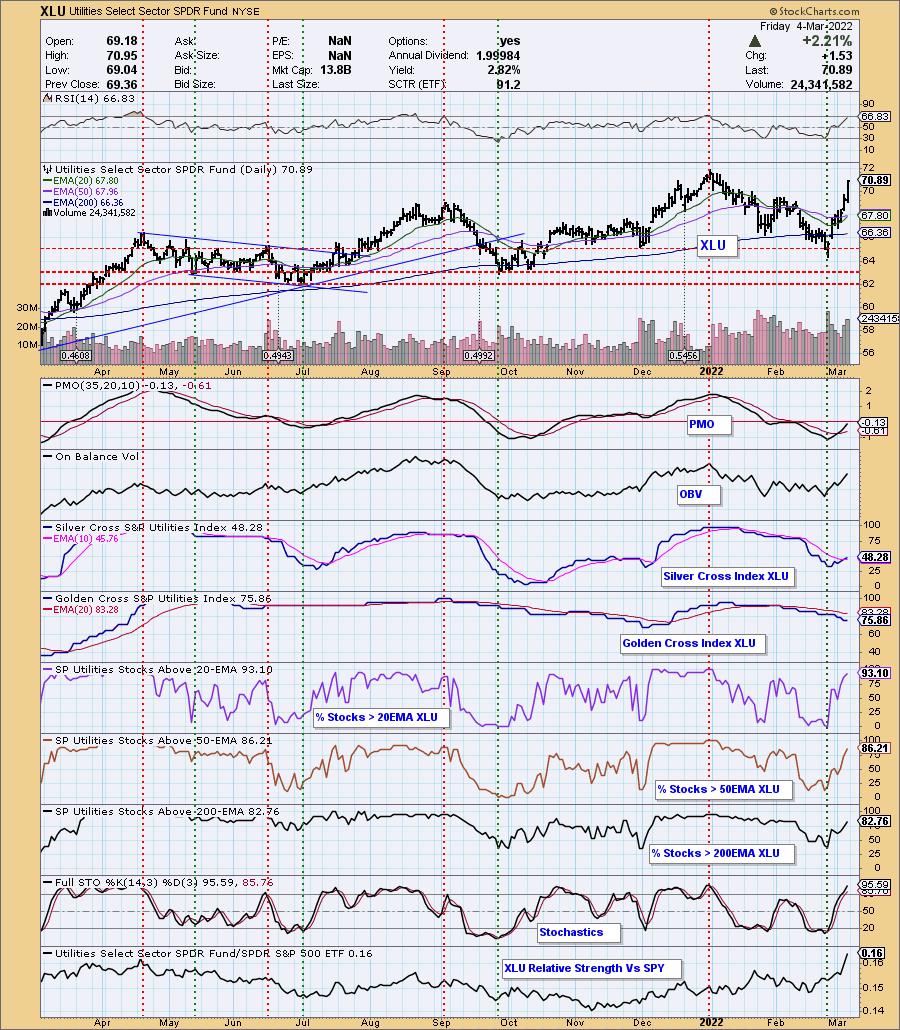
Real Estate chart for comparison:
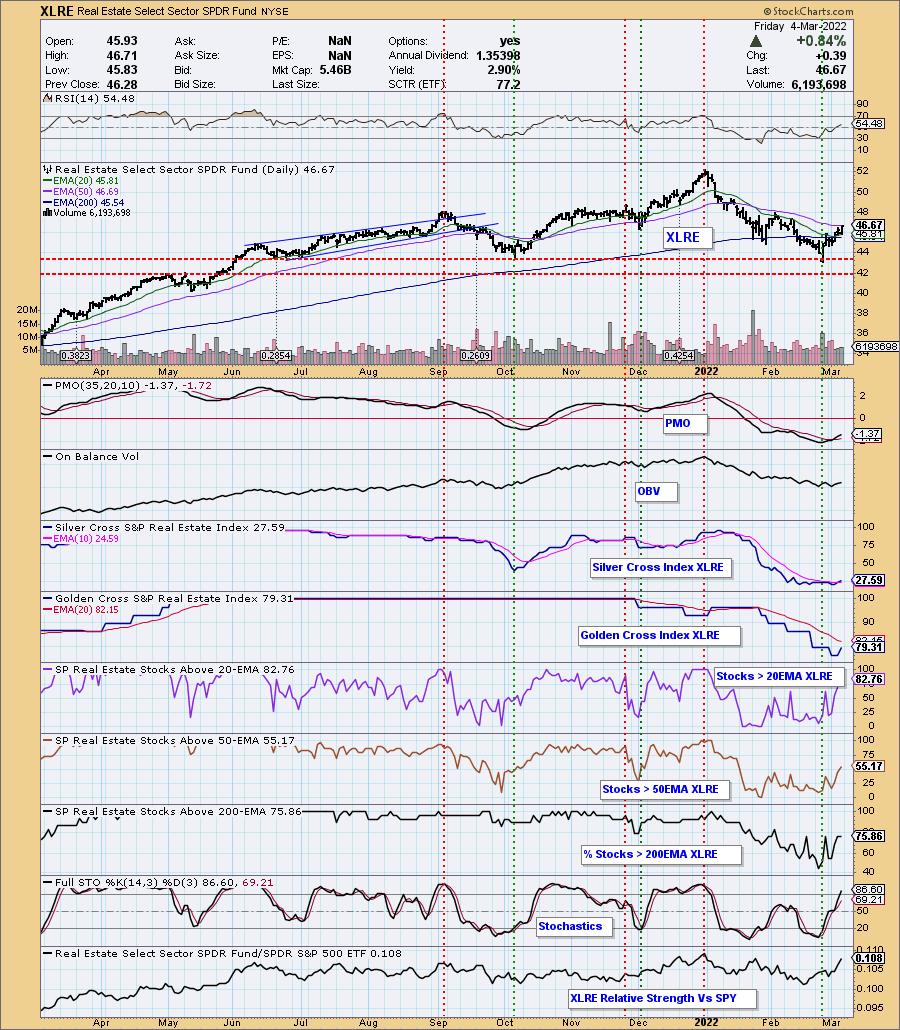
Industry Group to Watch: Conventional Electricity ($DJUSVE)
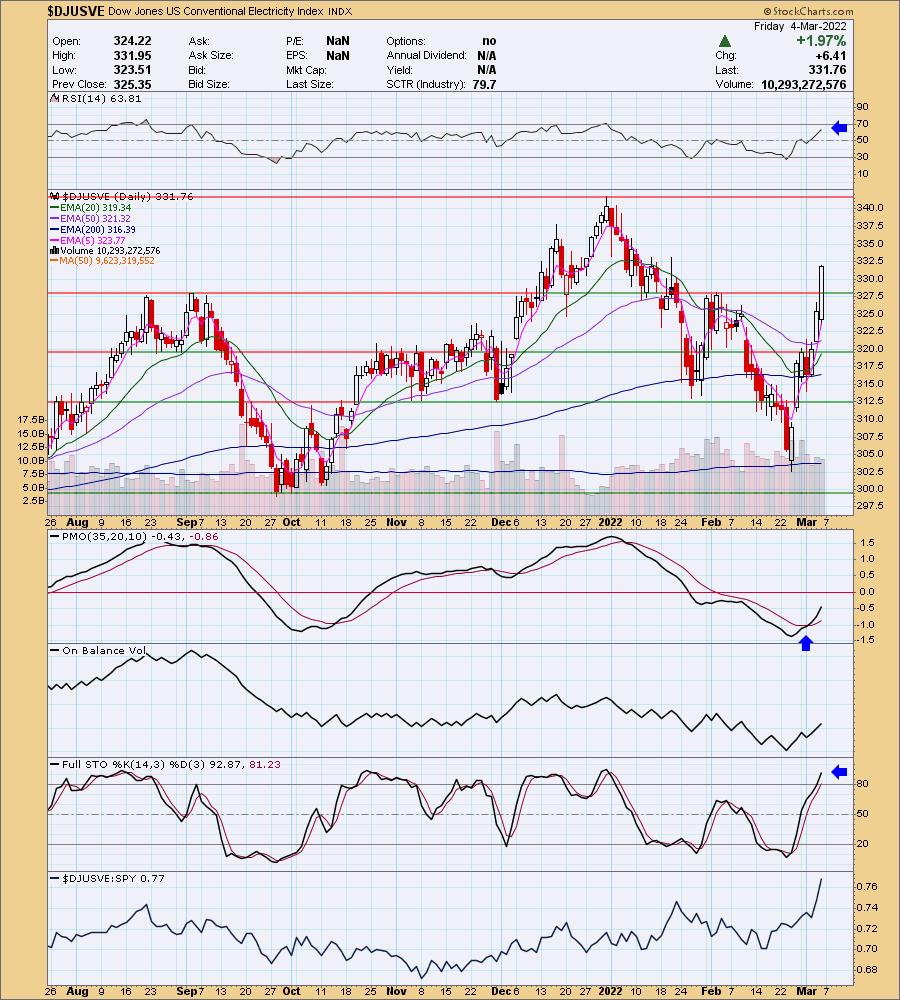
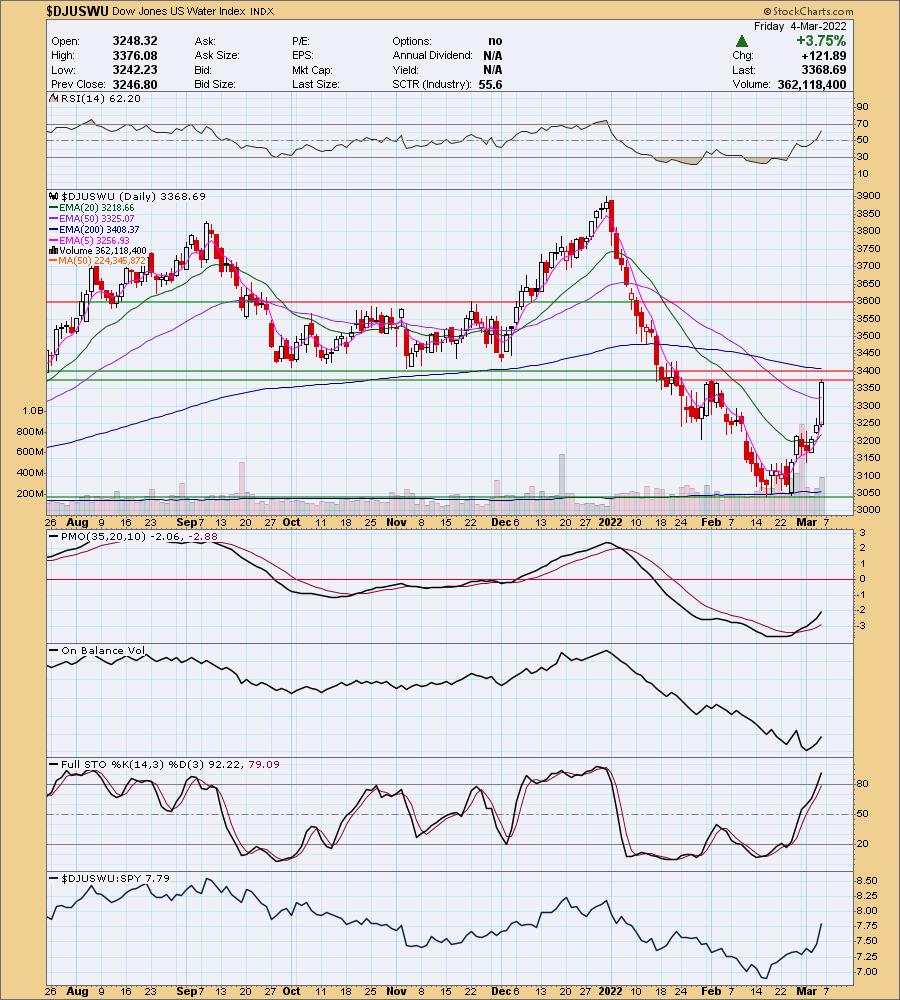
Literally all of the industry groups within XLU are very bullish. I picked Conventional Electricity over Water (which I talked about in the Diamond Mine this morning) because Water is coming up on overhead resistance. I still love the chart, but it was a judgement call. DJUSVE show a strong breakout above overhead resistance. It above all of the key moving averages. The RSI is positive and not overbought. PMO is on a BUY signal and Stochastics are rising strongly. I'll put the Water chart below for comparison.
Go to our Sector ChartList on DecisionPoint.com to get an in-depth view of all the sectors.
Have a great weekend! The next Diamonds Report is TUESDAY 3/8.
- Erin
erin@decisionpoint.com
Full Disclosure: I'm 10% exposed to the market.
Watch the latest episode of DecisionPoint with Carl & Erin Swenlin on Mondays 7:00p EST or on the DecisionPoint playlist on the StockCharts TV YouTube channel here!
Technical Analysis is a windsock, not a crystal ball. --Carl Swenlin
NOTE: The stocks reported herein are from mechanical trading model scans that are based upon moving average relationships, momentum and volume. DecisionPoint analysis is then applied to get five selections from the scans. The selections given should prompt readers to do a chart review using their own analysis process. This letter is not a call for a specific action to buy, sell or short any of the stocks provided. There are NO sure things or guaranteed returns on the daily selection of "diamonds in the rough."
Helpful DecisionPoint Links:
DecisionPoint Shared ChartList and DecisionPoint Chart Gallery
Price Momentum Oscillator (PMO)
Swenlin Trading Oscillators (STO-B and STO-V)
(c) Copyright 2022 DecisionPoint.com