
I really enjoyed looking at today's reader requests. Really interesting charts! I picked out the five requests that I liked best and then put the others I liked in the "Stocks to Review". All merited a spot in that list.
Wartime beneficiaries seem to be the theme of late. How couldn't it be? You'll find some Specialty Chemicals stocks in the "Stocks to Review" that will capitalize on fertilizer chemicals given Ukraine produces a huge portion. Demand won't be going down.
Other beneficiaries? Possibly ammunition producers. I liked the POWW chart, but the other SWBI (Smith Wesson) is dropping like a rock in after hours trading after reporting earnings. Not sure how that will effect POWW except to say that POWW is down -0.60% versus the -15.15% SWBI is down in after hours trading.
Crude Oil related stocks are of course still flying high. I don't think we've missed the boat on that just yet. I believe a determination still needs to be made as to whether the west will continue to buy oil from Russia. If we want to cripple them, I believe we should endure energy costs going up double or triple for awhile. That would be painful, but I remember wartime rationing during prior wars and I think we can all agree that we should take all economic measures we can possibly handle to shut this war down before it infects more countries. Just my two cents that you know I will often throw at you. Here's an article on US/Russia Crude Oil implications.
Other industries we should consider are Aerospace and Defense. These stocks are 'runners' right now, but if this war is prolonged, I suspect that these stocks will continue higher.
Cybersecurity is still a good area. It has had a rough two days (probably because I picked them), but I still see upside potential there. I was informed of another trading vehicle in this area that I forgot about, CIBR. So the three out there you may want to investigate (as well as their holdings) are HACK, BUG and CIBR. (Full disclosure: I own HACK).
We'll have lots to talk about in tomorrow's Diamond Mine so register now using the link below or this one.
Today's "Diamonds in the Rough": BKR, DXCM, HRL, OKE and TGI.
Stocks to Review (no order): SI, SWBI, CIBR, POWW, CTRA, KBR, CNC, CMRE, KOS, NXST, CF and NTR.

RECORDING LINK (2/25/2022):
Topic: DecisionPoint Diamond Mine (2/25/2022) LIVE Trading Room
Start Time: Feb 25, 2022 09:00 AM PT
Meeting Recording Link.
Access Passcode: Feb@25th
REGISTRATION FOR Friday 3/4 Diamond Mine:
When: Mar 4, 2022 09:00 AM Pacific Time (US and Canada)
Topic: DecisionPoint Diamond Mine (3/4/2022) LIVE Trading Room
Register in advance for this webinar HERE.
Save the registration confirmation email with login instructions in case Zoom doesn't notify you in time.

Free DP Trading Room (2/28) RECORDING LINK:
Topic: DecisionPoint Trading Room
Start Time: Feb 28, 2022 09:00 AM PT
Meeting Recording Link.
Access Passcode: Feb#28th
For best results, copy and paste the access code to avoid typos.
Welcome to DecisionPoint Daily Diamonds, wherein I highlight ten "Diamonds in the Rough" per week. These are selected from the results of my DecisionPoint Scans, which search for stocks that could benefit from the trend and condition of the market. Remember, these are not recommendations to buy or sell, but are the most interesting of the stocks that surfaced in my scans. My objective is to save you the work of the initial, tedious culling process, but you need to apply your own analysis to see if these stocks pique your interest as well. There are no guaranteed winners here!
"Predefined Scans Triggered" are taken from StockCharts.com using the "Symbol Summary" option instead of a "SharpChart" on the workbench.
Baker Hughes Company (BKR)
EARNINGS: 4/20/2022 (BMO)
Baker Hughes Co. is a holding company. The firm engages in the provision of oilfield products, services, and digital solutions. It operates through the following segments: Oilfield Services (OFS), Oilfield Equipment (OFE), Turbomachinery & Process Solutions (TPS) and Digital Solutions (DS). The OFS segment provides products and services for on and offshore operations across the lifecycle of a well, ranging from drilling, evaluation, completion, production, and intervention. The OFE segment provides a broad portfolio of products and services required to facilitate the safe and reliable flow of hydrocarbons from the subsea wellhead to the surface production facilities. The TPS segment provides equipment and related services for mechanical-drive, compression and power-generation applications. The DS segment provides operating technologies helping to improve the health, productivity, and safety of asset intensive industries and enable the Industrial Internet of Things. The company was founded in April 1987 and is headquartered in Houston, TX.
Predefined Scans Triggered: New 52-week Highs, Moved Above Upper Bollinger Band, P&F Ascending Triple Top Breakout and P&F Double Top Breakout.
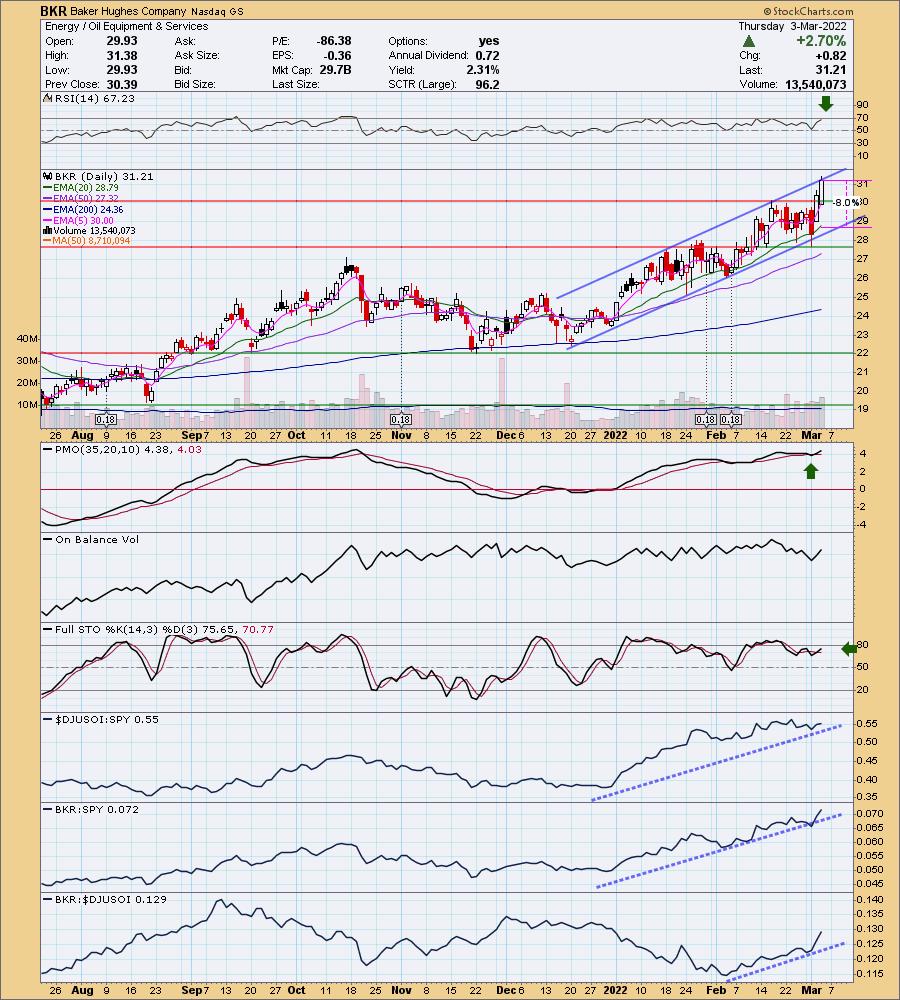
BKR is unchanged in after hours trading. I covered BKR on December 7th 2021. If I'd made the stop a bit deeper the position would still be open, but the thin 6.6% stop was triggered and then BKR promptly took off. Setting stops is a tricky business for sure.
BKR is in a confirmed rising trend channel. It did just tap the top of it, so a pullback to the bottom of the channel is entirely possible. The PMO is on a whipsaw BUY signal. The RSI is positive and rising. Stochastics are positive, but not yet above 80 where we want it. Relative strength is positive amongst the group and BKR. The 8% stop is set at a level that would be hit should the rising trend be broken.
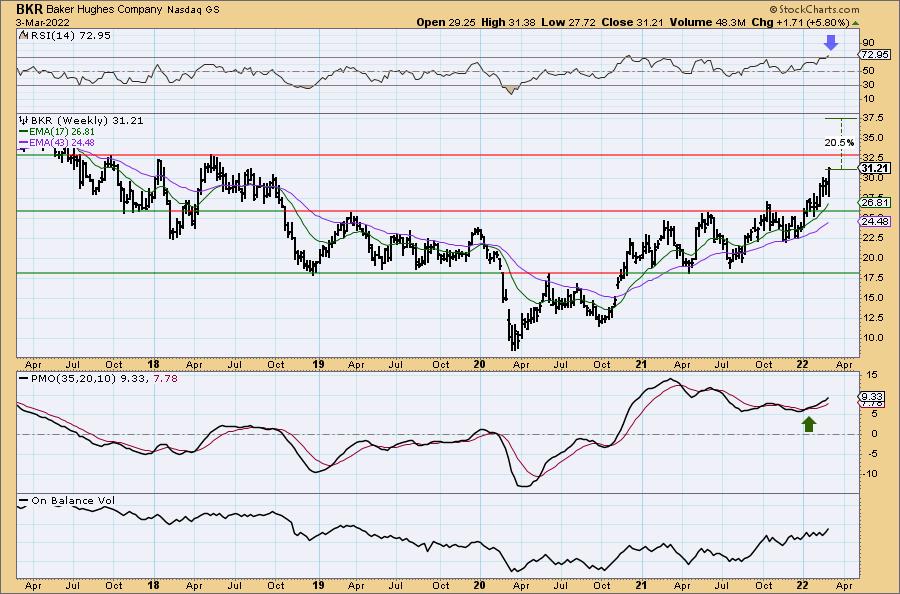
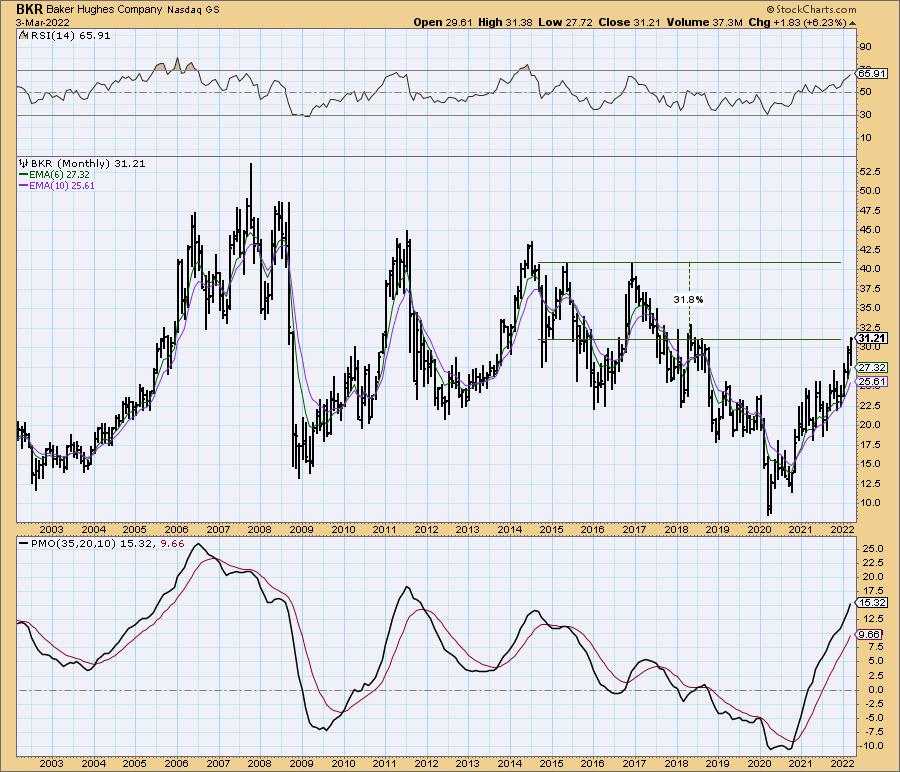
The weekly chart is bullish except possibly having an overbought weekly RSI. I think that will be the norm for these stocks so I'm not that worried about that. The weekly PMO looks fantastic as it rises on a crossover BUY signal and is not yet overbought. I've listed $37.50 as the upside target, but if you look at the monthly chart below this weekly chart, you'll see that the next area of resistance is at about $41. This one has plenty of room to run higher.
DexCom Inc. (DXCM)
EARNINGS: 4/28/2022 (AMC)
DexCom, Inc. is a medical device manufacturing company, which engages in the design, development and commercialization of glucose monitoring systems for ambulatory use by people with diabetes. Its products include Dexcom G6 CGM System, DexCom G6 CGM System for Medicare, Software and Mobile apps. The company was founded by John F. Burd on May 1, 1999 and is headquartered in San Diego, CA.
Predefined Scans Triggered: Filled Black Candles and P&F Double Top Breakout
DXCM is up +0.25% in after hours trading. I've covered DXCM multiple times. Pretty soon I won't be able to go back and check on these as it takes a lot of work. Here are the dates and results: April 1st 2020 (position open and up +66.4%), April 21st 2020 (position open and up +37.5%), April 30th 2020 (position open and up +26.5%) and June 22nd 2020 (stop hit so the position is closed).
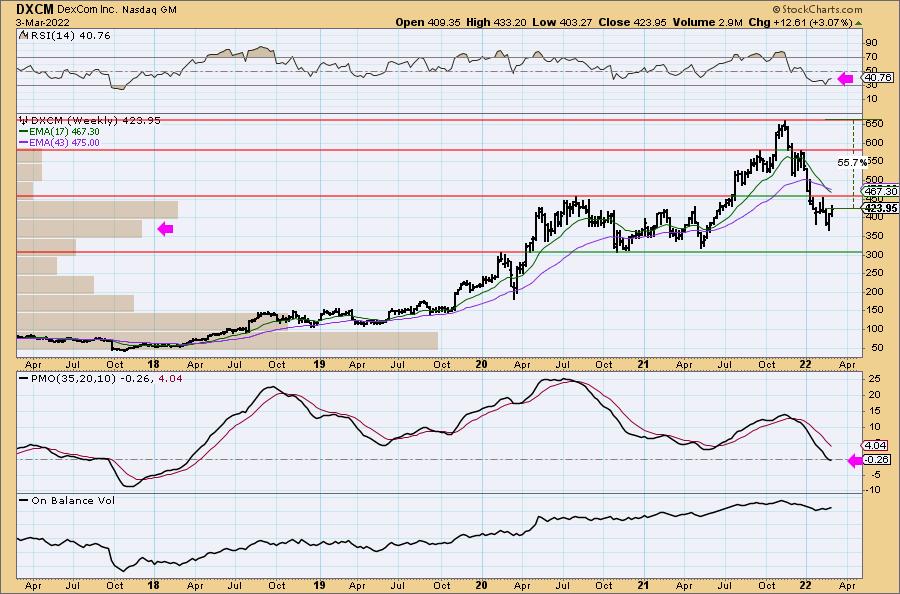
This is a promising chart, but DXCM is in a bear market as it is currently down over 35% since the November top. Therefore bear market rules apply. While this looks like a great foundation, this stock is actually quite beat down. Still, there are a lot of positives. First there is a bullish double-bottom pattern forming with an excellent OBV positive divergence between OBV bottoms and price lows. Price overcame resistance at the 20-day EMA. The PMO is rising on a whipsaw BUY signal. The RSI just hit positive territory. Stochastics look pretty good as they are in positive territory and rising. Relative strength lines look very bullish. The stop is set somewhat arbitrarily given it would be over 10% should I have set it below support at the bottom of the double-bottom pattern. 8% is my average stop.

I'm not thrilled with the weekly chart. The RSI is negative and flat. The PMO is still declining and just dropped below the zero line. I noticed that this double-bottom isn't aligned with any support levels. That's when I like to use the Volume by Price overlay. It tells you how much volume was seen at certain price points. We don't see huge volume on these lows so this may not be adequate support and we already know it is in a bear market. If it can overcome resistance at the confirmation line of the double-bottom (it aligns with the 2020 high) we could see price move to its all-time high. I'm not that confident, but a 15-20% gain seems reasonable.
Hormel Foods Corp. (HRL)
EARNINGS: 5/19/2022 (BMO)
Hormel Foods Corp. engages in the production of meat and food products. It operates through the following segments: Grocery Products, Refrigerated Foods, Jennie-O Turkey Store, and International and Other. The Grocery Products segment consists primarily of the processing, marketing, and sale of shelf-stable food products sold in the retail market. The Refrigerated Foods segment is involved in the processing, marketing, and sale of branded and unbranded pork, beef, and poultry products for retail, foodservice, deli, and commercial customers. The Jennie-O Turkey Store segment includes the processing, marketing, and sale of branded and unbranded turkey products for retail, foodservice, and fresh product customers. The International and Other segment comprises Hormel Foods International, which manufactures, markets, and sells company products internationally. The company was founded by George A. Hormel in 1891 and is headquartered in Austin, MN.
Predefined Scans Triggered: Moved Above Upper Keltner Channel, New 52-week Highs, Moved Above Upper Price Channel and P&F Double Top Breakout.
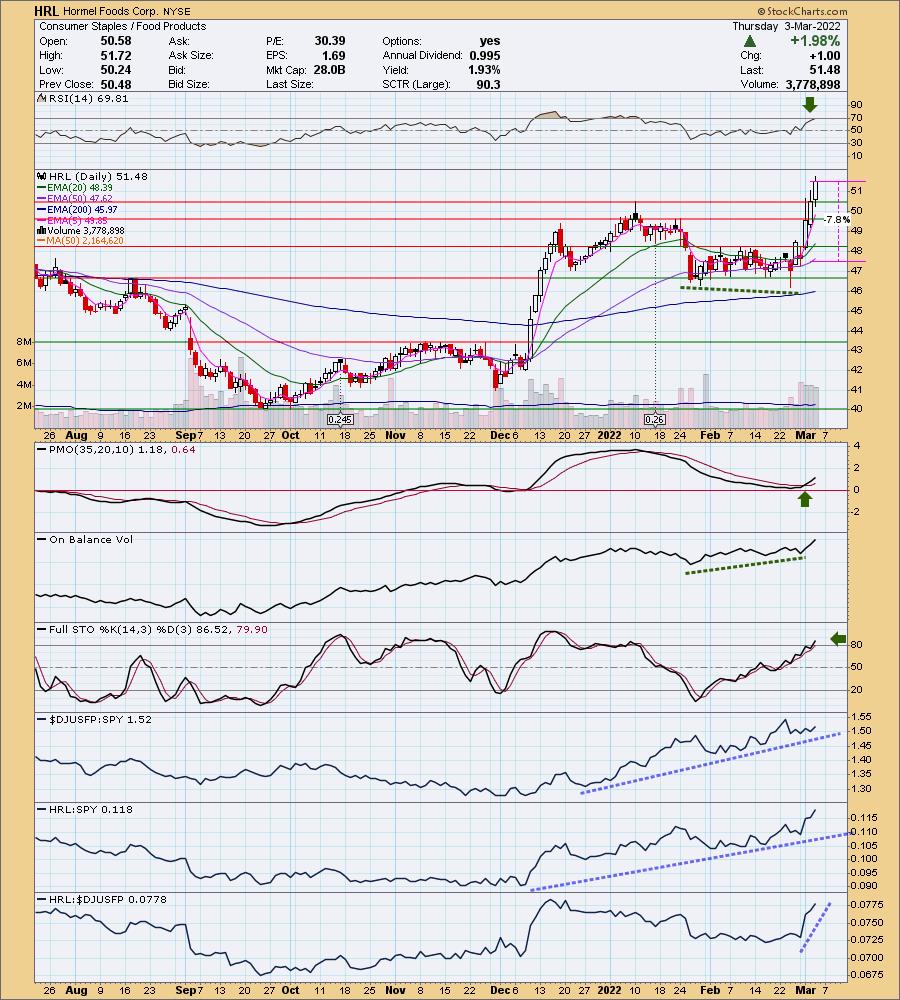
HRL is up +0.62% in after hours trading. I covered HRL on April 1st 2020. The position closed during volatile trading out of the 2020 lows. It is on fire right now having overcome two levels of overhead resistance. The PMO is rising on a BUY signal and is not overbought. There's a positive OBV divergence and the RSI is positive. Stochastics have been rising steadily and are now above 80. Relative strength lines are very bullish. The stop is set midway into the February trading range.
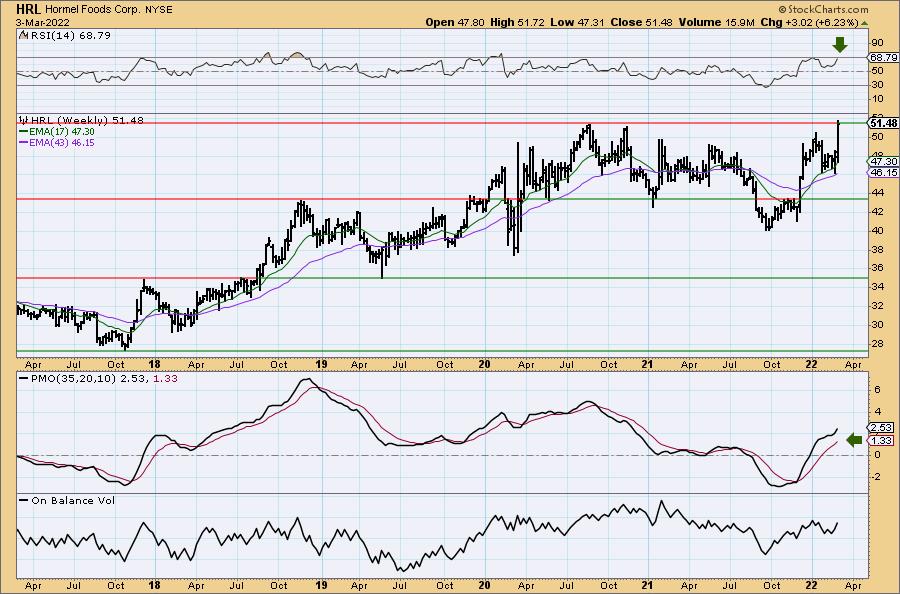
HRL just hit new all-time highs this week. Given the positive and not yet overbought weekly RSI and PMO rising after bottoming above the signal line, this one should move higher. Since it is at all-time highs, consider a 16% upside target at $59.72.
Oneok, Inc. (OKE)
EARNINGS: 4/26/2022 (AMC)
ONEOK, Inc. engages in gathering, processing, fractionating, transporting, storing and marketing of natural gas. It operates through the following segments: Natural Gas Gathering and Processing, Natural Gas Liquids and Natural Gas Pipelines. The Natural Gas Gathering and Processing segment offers midstream services to producers in North Dakota, Montana, Wyoming, Kansas and Oklahoma. The Natural Gas Liquids segment owns and operates facilities that gather, fractionate, treat and distribute NGLs and store NGL products, in Oklahoma, Kansas, Texas, New Mexico and the Rocky Mountain region, which includes the Williston, Powder River and DJ Basins, where it provides midstream services to producers of NGLs and deliver those products to the two market centers, one in the Mid-Continent in Conway, Kansas and the other in the Gulf Coast in Mont Belvieu, Texas. The Natural Gas Pipelines segment provides transportation and storage services to end users. The company was founded in 1906 and is headquartered in Tulsa, OK.
Predefined Scans Triggered: Moved Above Upper Keltner Channel, New 52-week Highs, P&F Ascending Triple Top Breakout and P&F Double Top Breakout.
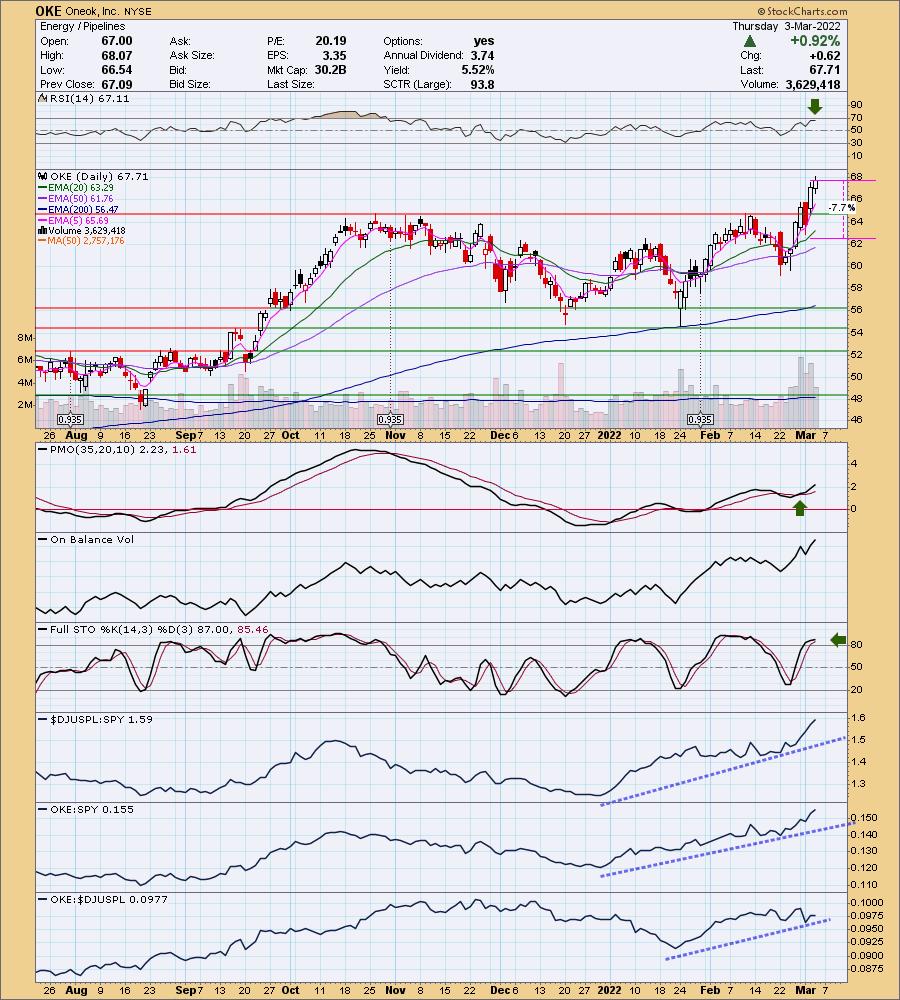
OKE is up +0.96% in after hours trading. I covered OKE on February 10th 2021 (position still open and up +51.3%) and on March 4th 2021 (position still open and up +40.3%). OKE broke out this week. The chart was already looking good at the end of February given that is when the PMO gave us crossover BUY signal and the RSI moved positive. Stochastics were also cluing us in. I've set the stop between the 20/50-day EMAs.
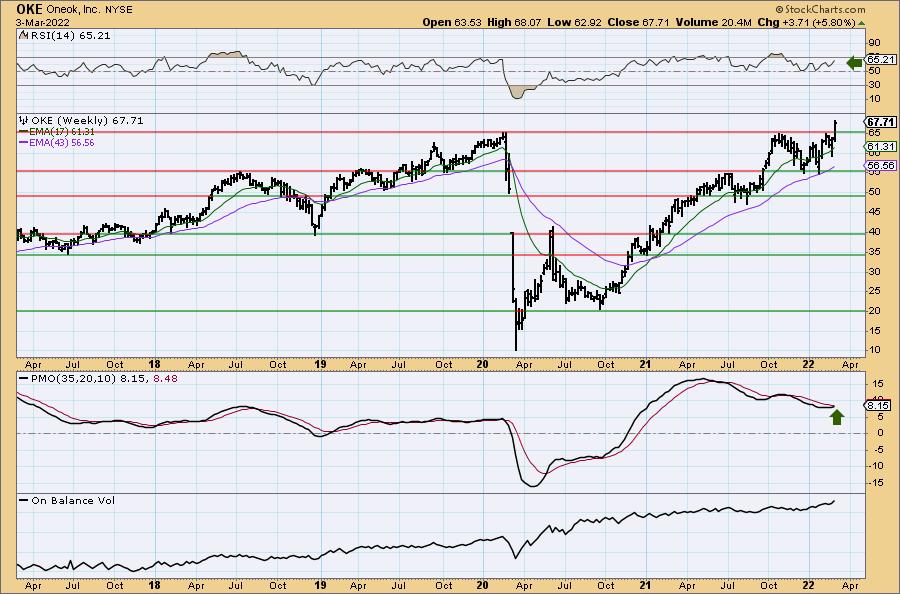
The weekly PMO is nearing a crossover BUY signal. The RSI has been positive for months. Since it is at all-time highs, consider an upside target of 16% at $78.54.
Triumph Group, Inc. (TGI)
EARNINGS: 5/19/2022 (BMO)
Triumph Group, Inc. engages in the designing, engineering, manufacturing, repairing and overhauling of aerospace and defense systems, components and structures. It operates through the following three segments: Triumph Integrated Systems, Triumph Aerospace Structures and Triumph Product Support. The Triumph Integrated Systems segment engages in designing, development and supporting proprietary components, subsystems and systems, as well as production of complex assemblies using external designs. The Triumph Aerospace Structures segment engages in supplying of commercial, business, regional and military manufacturers with large metallic and composite structures and produce close-tolerance parts. The Triumph Product Support segment provides full life cycle solutions for commercial, regional and military aircraft. The company was founded by Richard C. Ill in 1993 and is headquartered in Berwyn, PA.
Predefined Scans Triggered: P&F Double Top Breakout, Elder Bar Turned Blue and New 52-week Highs.
TGI is up +1.26% in after hours trading. I covered TGI on July 28th 2021 (position stopped out). TGI broke out and managed to close right on prior resistance. It is up quite a bit in after hours trading which suggests it will see follow-through on the breakout (after hours trading isn't necessarily a predictor, but helpful). The PMO is on the overbought side and looking flat. However, if we get the rally tomorrow, that will change. Stochastics are still oscillating above 80. Relative strength is great for the group given the war and TGI is outperforming it. The stop is set below the 20-day EMA.
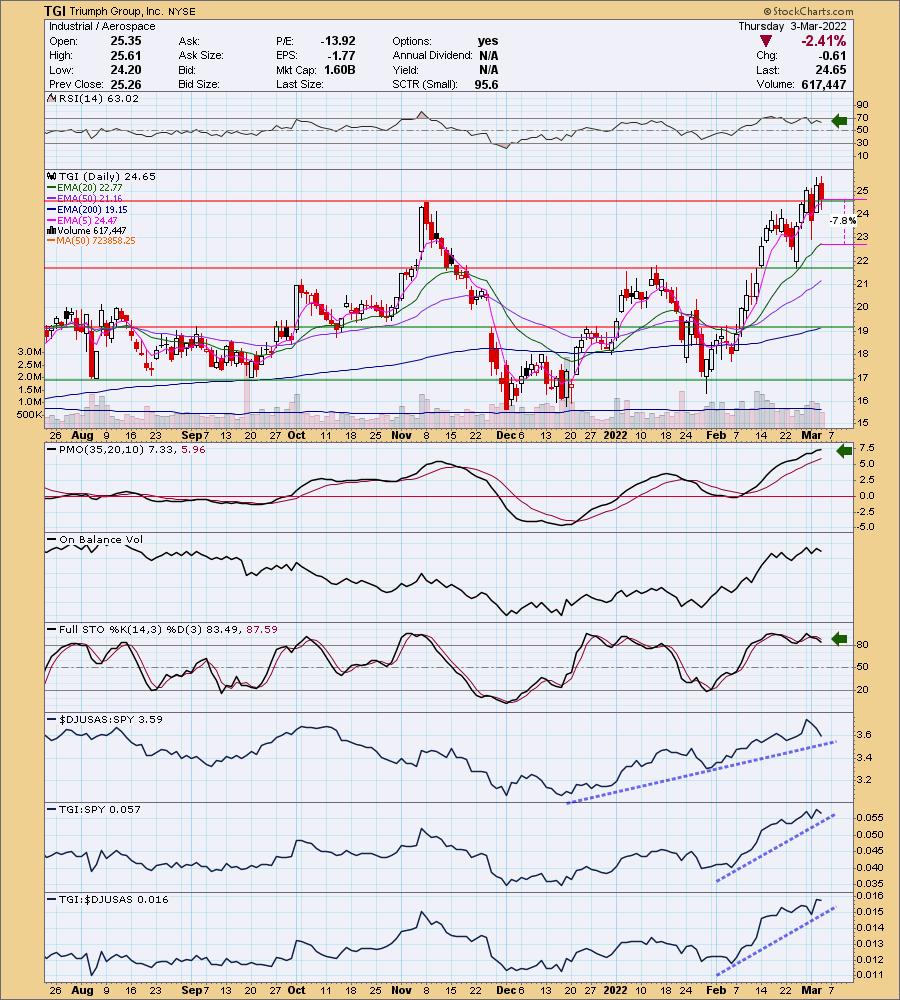
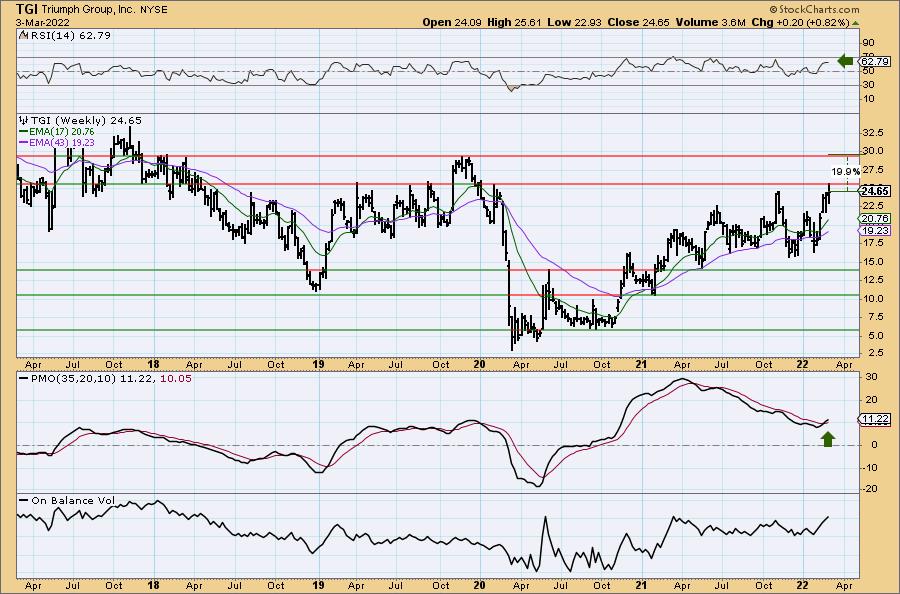
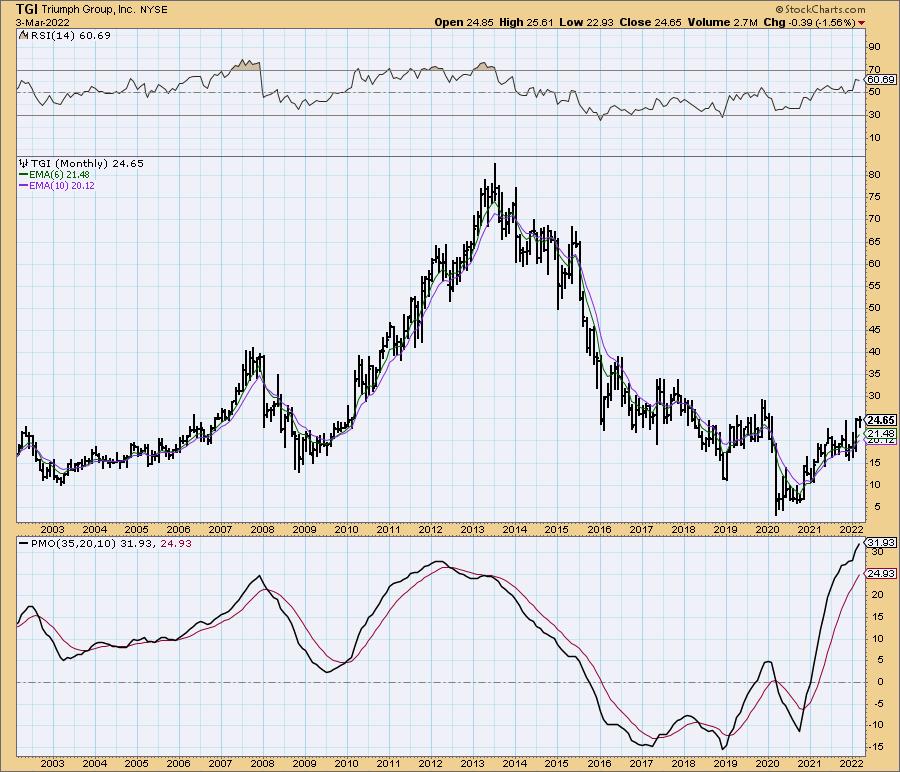
The subscriber who mentioned this stock was like me, wondering if Aerospace companies can move higher given Lockheed (LMT) and Northrup Grumman (NOC) are flying up and are at all-time highs. This one offers some upside potential you don't have necessarily on LMT and NOC. TGI is not at all-time highs and has plenty of headroom. Certainly a peek at the monthly chart below the weekly chart shows, it is far from all-time highs. While this might be worrisome to some, relative strength against the group is excellent right now against the group. The weekly RSI is positive and best of all, the weekly PMO just triggered a crossover BUY signal. I've set a "modest" upside target at the 2019 high.
Don't forget, on Thursdays I look at reader-requested symbols, click HERE to shoot me an email. I read every email I receive and try to answer them all!
Current Market Outlook:
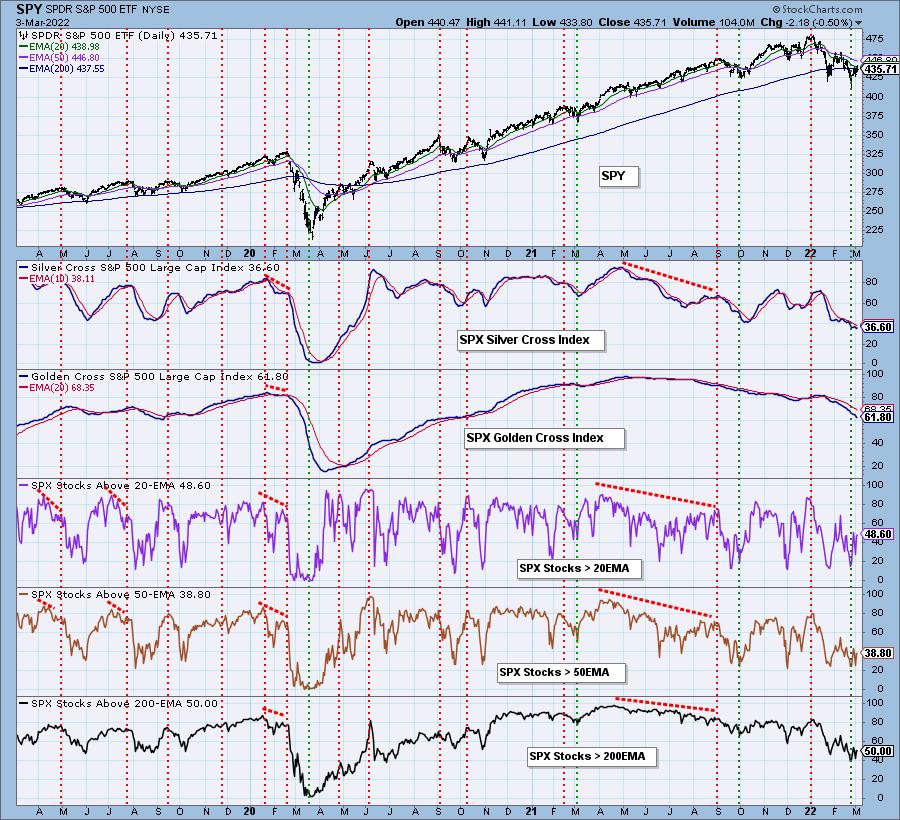
Market Environment: It is important to consider the odds for success by assessing the market tides. The following chart uses different methodologies for objectively showing the depth and trend of participation for intermediate- and long-term time frames.
- The Silver Cross Index (SCI) shows the percentage of SPX stocks on IT Trend Model BUY signals (20-EMA > 50-EMA)
- The Golden Cross Index (GCI) shows the percentage of SPX stocks on LT Trend Model BUY signals (50-EMA > 200-EMA)
Don't forget that as a "Diamonds" member, you have access to our GCI/SCI curated ChartList on DecisionPoint.com. You'll find it under "Members Only" links on the left side on the Blogs and Links Page.
Here is the current chart:
Full Disclosure: I'm 8% invested and 92% is in 'cash', meaning in money markets and readily available to trade with. I own HACK.
I'm required to disclose if I currently own a stock and/or may buy it within the next 72 hours.
Good Luck and Good Trading!
- Erin
"Technical Analysis is a windsock, not a crystal ball." - Carl Swenlin
(c) Copyright 2022 DecisionPoint.com
Watch the latest episode of DecisionPoint with Carl & Erin Swenlin on Mondays 7:00p EST or on the DecisionPoint playlist on the StockCharts TV YouTube channel here!
NOTE: The stocks reported herein are from mechanical trading model scans that are based upon moving average relationships, momentum and volume. DecisionPoint analysis is then applied to get five selections from the scans. The selections given should prompt readers to do a chart review using their own analysis process. This letter is not a call for a specific action to buy, sell or short any of the stocks provided. There are NO sure things or guaranteed returns on the daily selection of "Diamonds in the Rough."
Helpful DecisionPoint Links:
DecisionPoint Shared ChartList and DecisionPoint Chart Gallery
Price Momentum Oscillator (PMO)
Swenlin Trading Oscillators (STO-B and STO-V)
For more links, go to DecisionPoint.com
ds